
- Latest SAPUI Version 1.124
- SAPUI5 Version 1.122
- SAPUI5 Version 1.120
- SAPUI5 Version 1.118
- SAPUI5 Version 1.116
- SAPUI5 Version 1.114
- SAPUI5 Version 1.112
- SAPUI5 Version 1.110
- SAPUI5 Version 1.106
- SAPUI5 Version 1.104
- SAPUI5 Version 1.102
- SAPUI5 Version 1.100
- SAPUI5 Version 1.98
- SAPUI5 Version 1.96
- SAPUI5 Version 1.94
- SAPUI5 Version 1.92
- SAPUI5 Version 1.90
- SAPUI5 Version 1.88
- SAPUI5 Version 1.86
- SAPUI5 Version 1.84
- SAPUI5 Version 1.82
- SAPUI5 Version 1.80
- SAPUI5 Version 1.78
- SAPUI5 Version 1.76
- SAPUI5 Version 1.74
- SAPUI5 Version 1.72
- SAPUI5 Version 1.70
- SAPUI5 Version 1.68
- SAPUI5 Version 1.66
- SAPUI5 Version 1.64
- SAPUI5 Version 1.62
- SAPUI5 Version 1.60
- SAPUI5 Version 1.58
- SAPUI5 Version 1.56
- SAPUI5 Version 1.54
- SAPUI5 Version 1.52
- SAPUI5 Version 1.50
- SAPUI5 Version 1.48
- SAPUI5 Version 1.46
- SAPUI5 Version 1.44
- SAPUI5 Version 1.42
- SAPUI5 Version 1.40
- SAPUI5 Version 1.38
- SAPUI5 Version 1.36
- SAPUI5 Version 1.34
- SAPUI5 Version 1.32
- SAPUI5 Version 1.30
- SAPUI5 Version 1.28
- SAPUI5 Version 1.26
- Latest SAPUI Version 1.124
- SAPUI5 Version 1.122
- SAPUI5 Version 1.120
- SAPUI5 Version 1.118
- SAPUI5 Version 1.116
- SAPUI5 Version 1.114
- SAPUI5 Version 1.112
- SAPUI5 Version 1.110
- SAPUI5 Version 1.108
- SAPUI5 Version 1.106
- SAPUI5 Version 1.104
- SAPUI5 Version 1.102
- SAPUI5 Version 1.100
- SAPUI5 Version 1.98
- SAPUI5 Version 1.96
- SAPUI5 Version 1.94
- SAPUI5 Version 1.92
- SAPUI5 Version 1.90
- SAPUI5 Version 1.88
- SAPUI5 Version 1.86
- SAPUI5 Version 1.84
- SAPUI5 Version 1.82
- SAPUI5 Version 1.80
- SAPUI5 Version 1.78
- SAPUI5 Version 1.76
- SAPUI5 Version 1.74
- SAPUI5 Version 1.72
- SAPUI5 Version 1.70
- SAPUI5 Version 1.68
- SAPUI5 Version 1.66
- SAPUI5 Version 1.64
- SAPUI5 Version 1.62
- SAPUI5 Version 1.60
- SAPUI5 Version 1.58
- SAPUI5 Version 1.56
- SAPUI5 Version 1.54
- SAPUI5 Version 1.52
- SAPUI5 Version 1.50
- SAPUI5 Version 1.48
- SAPUI5 Version 1.46
- SAPUI5 Version 1.44
- SAPUI5 Version 1.42
- SAPUI5 Version 1.40
- SAPUI5 Version 1.38
- SAPUI5 Version 1.36
- SAPUI5 Version 1.34
- SAPUI5 Version 1.32
- SAPUI5 Version 1.30
- SAPUI5 Version 1.28
- SAPUI5 Version 1.26
P13n Dialog
sap.m.p13n.Popup
Intro
The P13n dialog control tabs allow users to personalize table and smart chart attributes.
Table Personalization Tabs
- Columns: Visibility and order of columns
- Sort: Sort criteria for table items
- Filter: Filter criteria for table items
- Group: Grouping table items by specific attributes
The tabs can be shown in any combination, as required by the use case.
The P13n dialog is intended for complex tables that have a large number of columns and require complex queries for sorting, grouping, and filtering.
For simple tables, see the view settings dialog and table personalization dialog.
Smart Chart Personalization Tabs
In addition to the Sort and Filter tabs, the P13n dialog for smart charts can include the Chart tab to allow users to set the visibility of chart dimensions and measures.
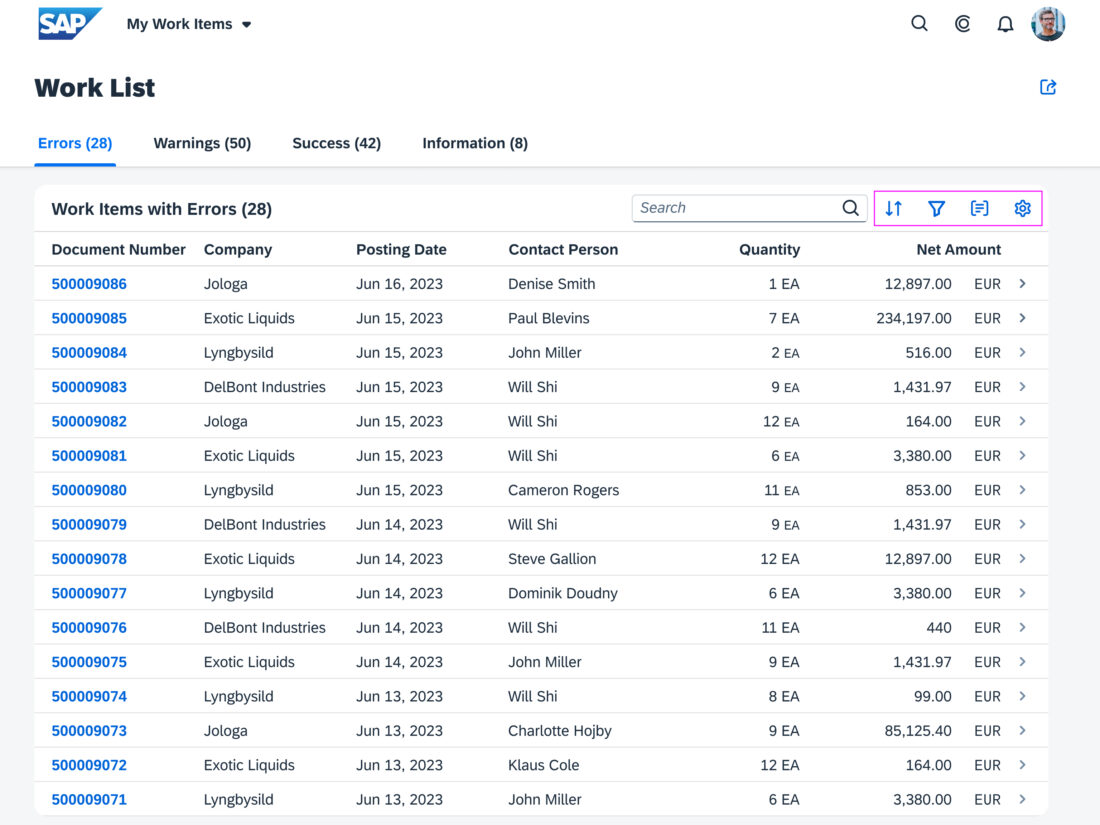
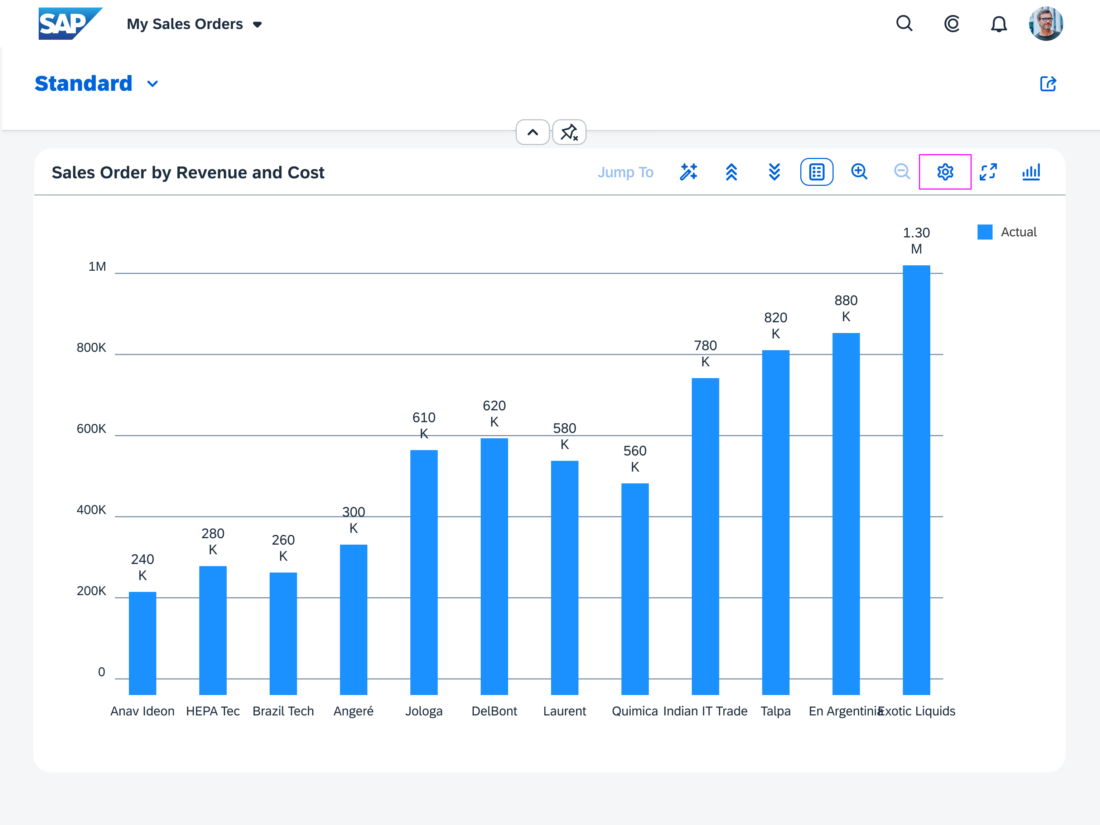
The P13n dialog is opened using the corresponding buttons on the right-hand side of the table or chart toolbar, as shown below.
Dialog buttons within the toolbar
Usage
Use the P13n dialog if:
- Users can personalize more than ~20 columns.
- You need multiple personalization functions (columns, sorting, filtering, grouping, …)
- You are using the analytical table.
- Complex queries have to be built for the table.
Do not use the P13n dialog if:
- Users can personalize fewer than ~20 columns.
- You only need a simple feature to show/hide columns.
Responsiveness
The P13n dialog is available for all display sizes. For sizes L/XL (desktop) and M (tablet), it shows as a centered dialog. For size S (smartphones), it displays as a full screen dialog.
Size S – Columns
Size M
Size L
Components
The P13n dialog can include the following tabs, separately or combined, as required by the use case:
- Sort
- Filter
- Columns (available only for tables)
- Group (available only for tables)
- Chart (available only for the Smart Chart)
App developers can add more tabs manually.
Behavior and Interaction
On the Sort tab, the user can specify the sort criteria and sort order (ascending or descending).
Each entry has two input fields:
- One for choosing the sort column in a table or the sort dimension or measure in a smart chart
- The second for choosing the sort order.
Users can enter multiple sort criteria. Once a sort criterion is entered, a new line appears for entering another one.
The order of the sort criteria reflects the order in which they are applied to the table or smart chart.
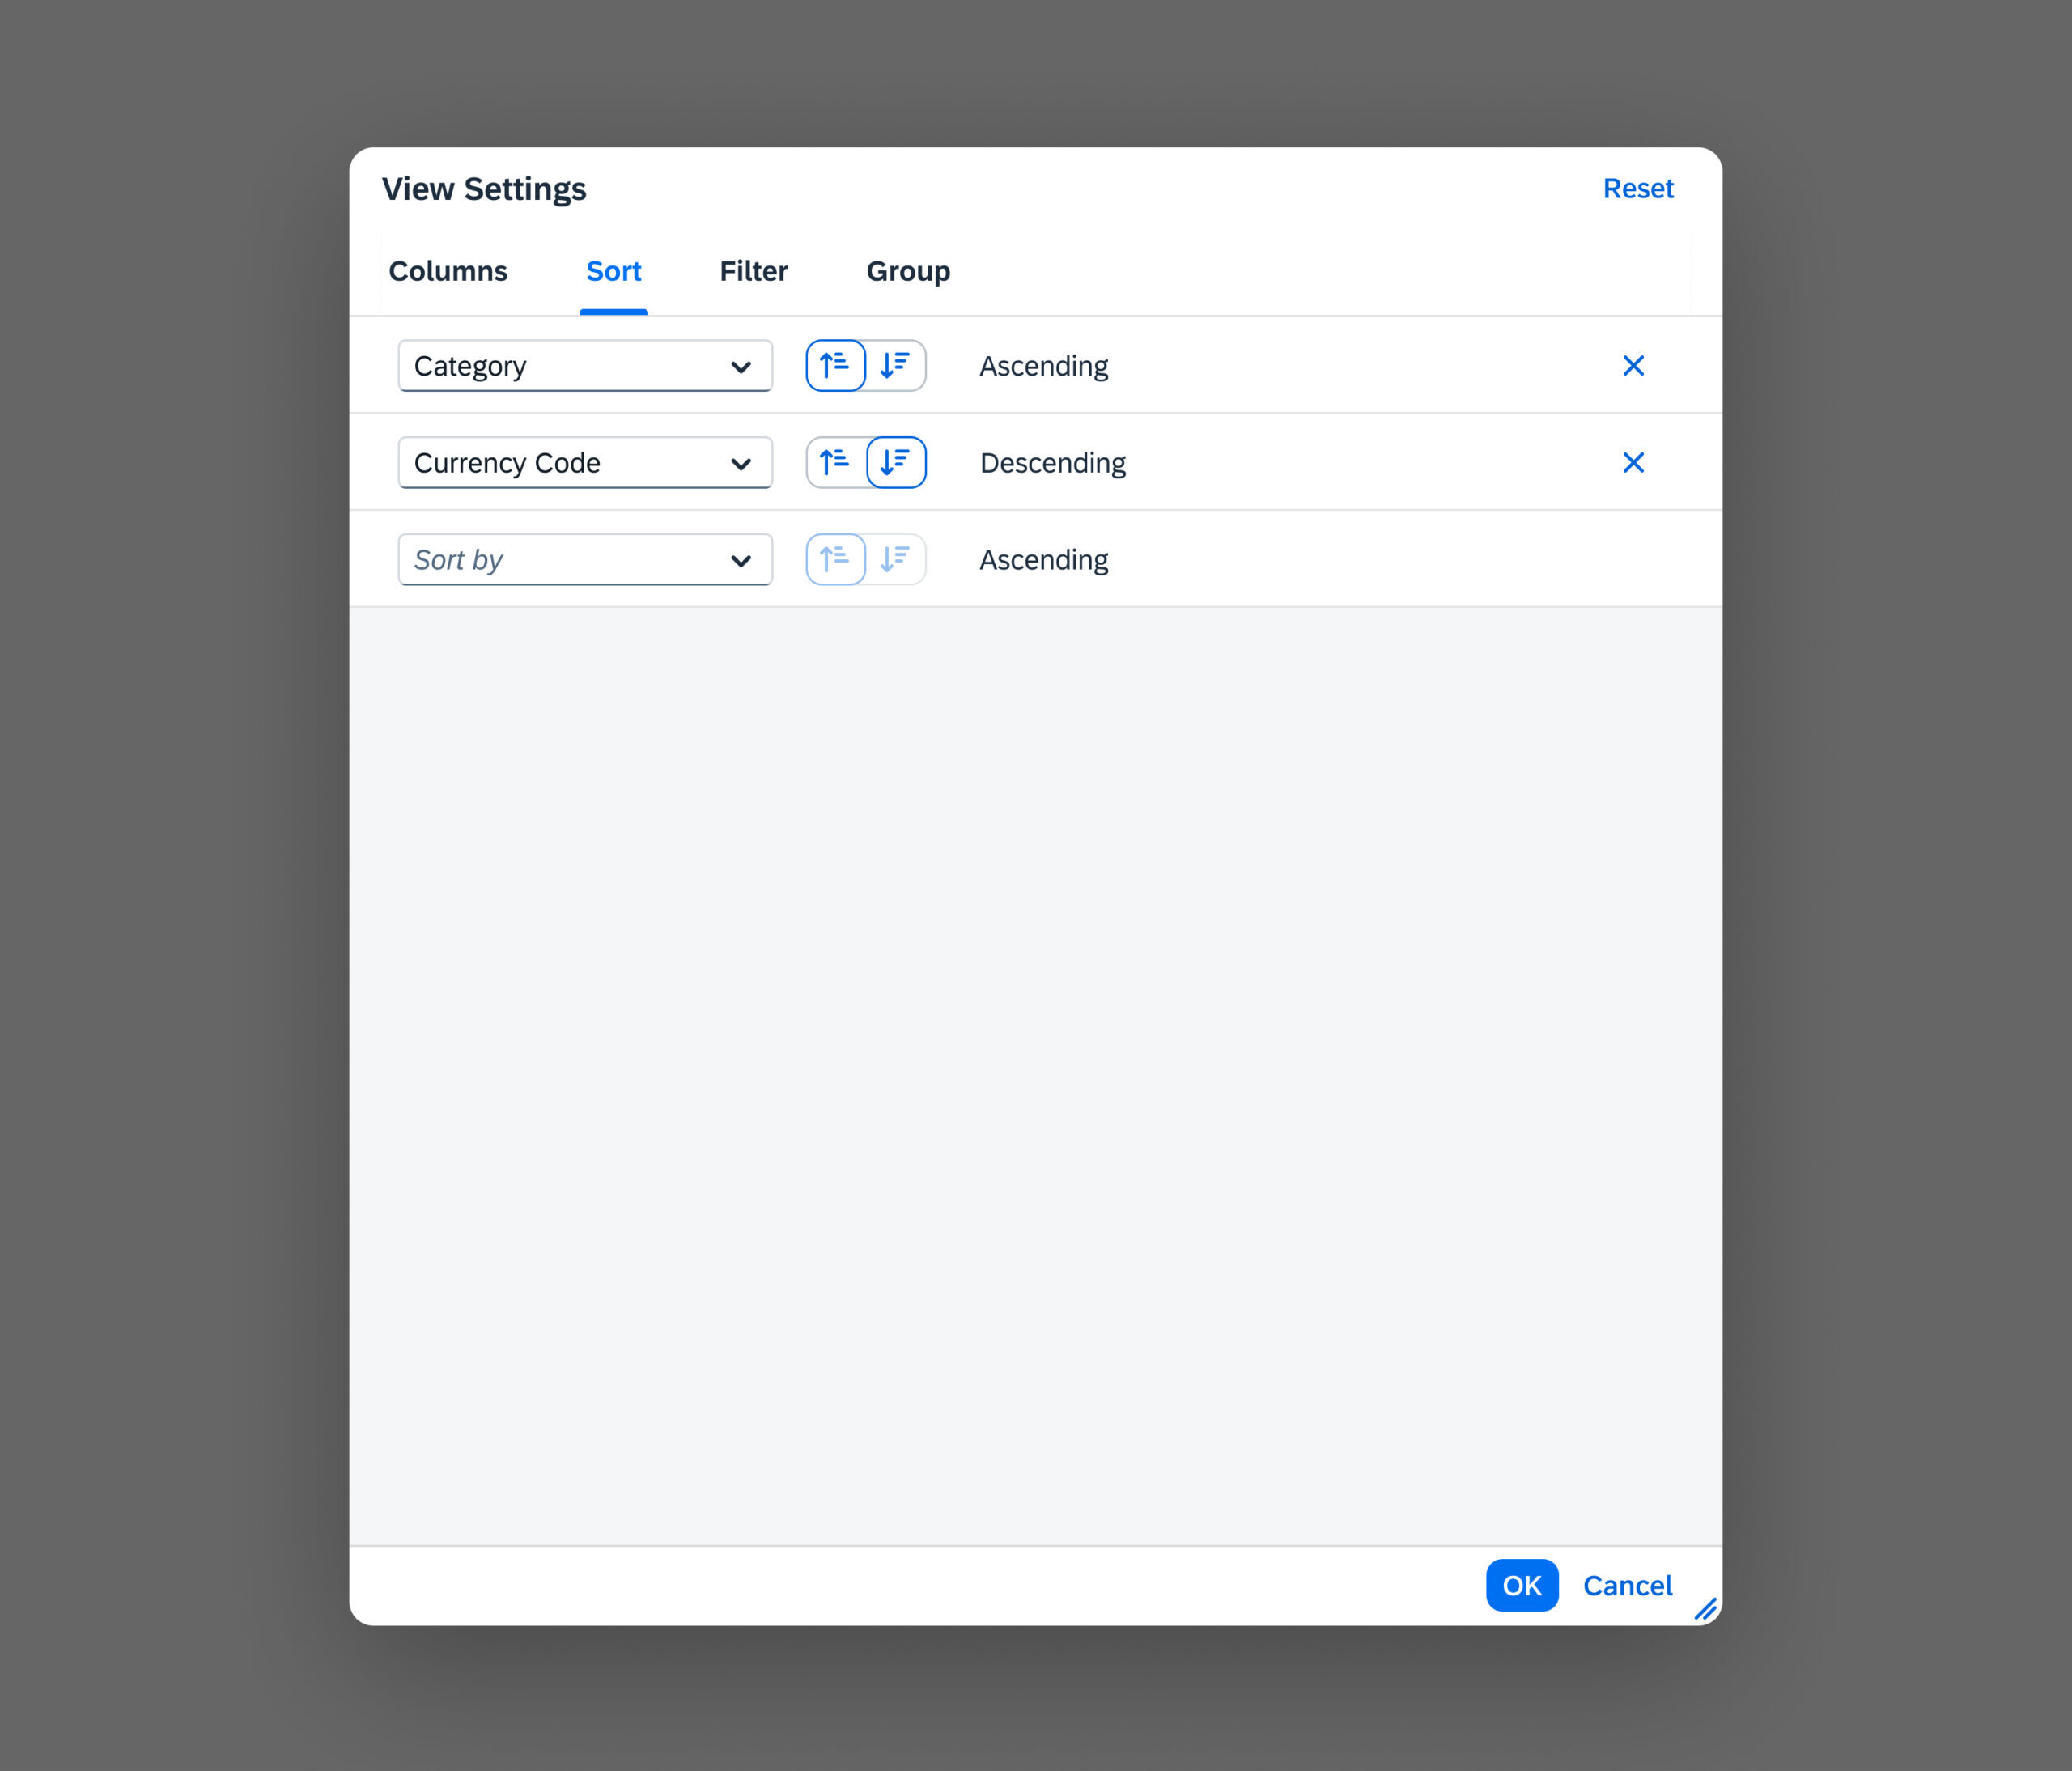
Sort settings in the P13n dialog
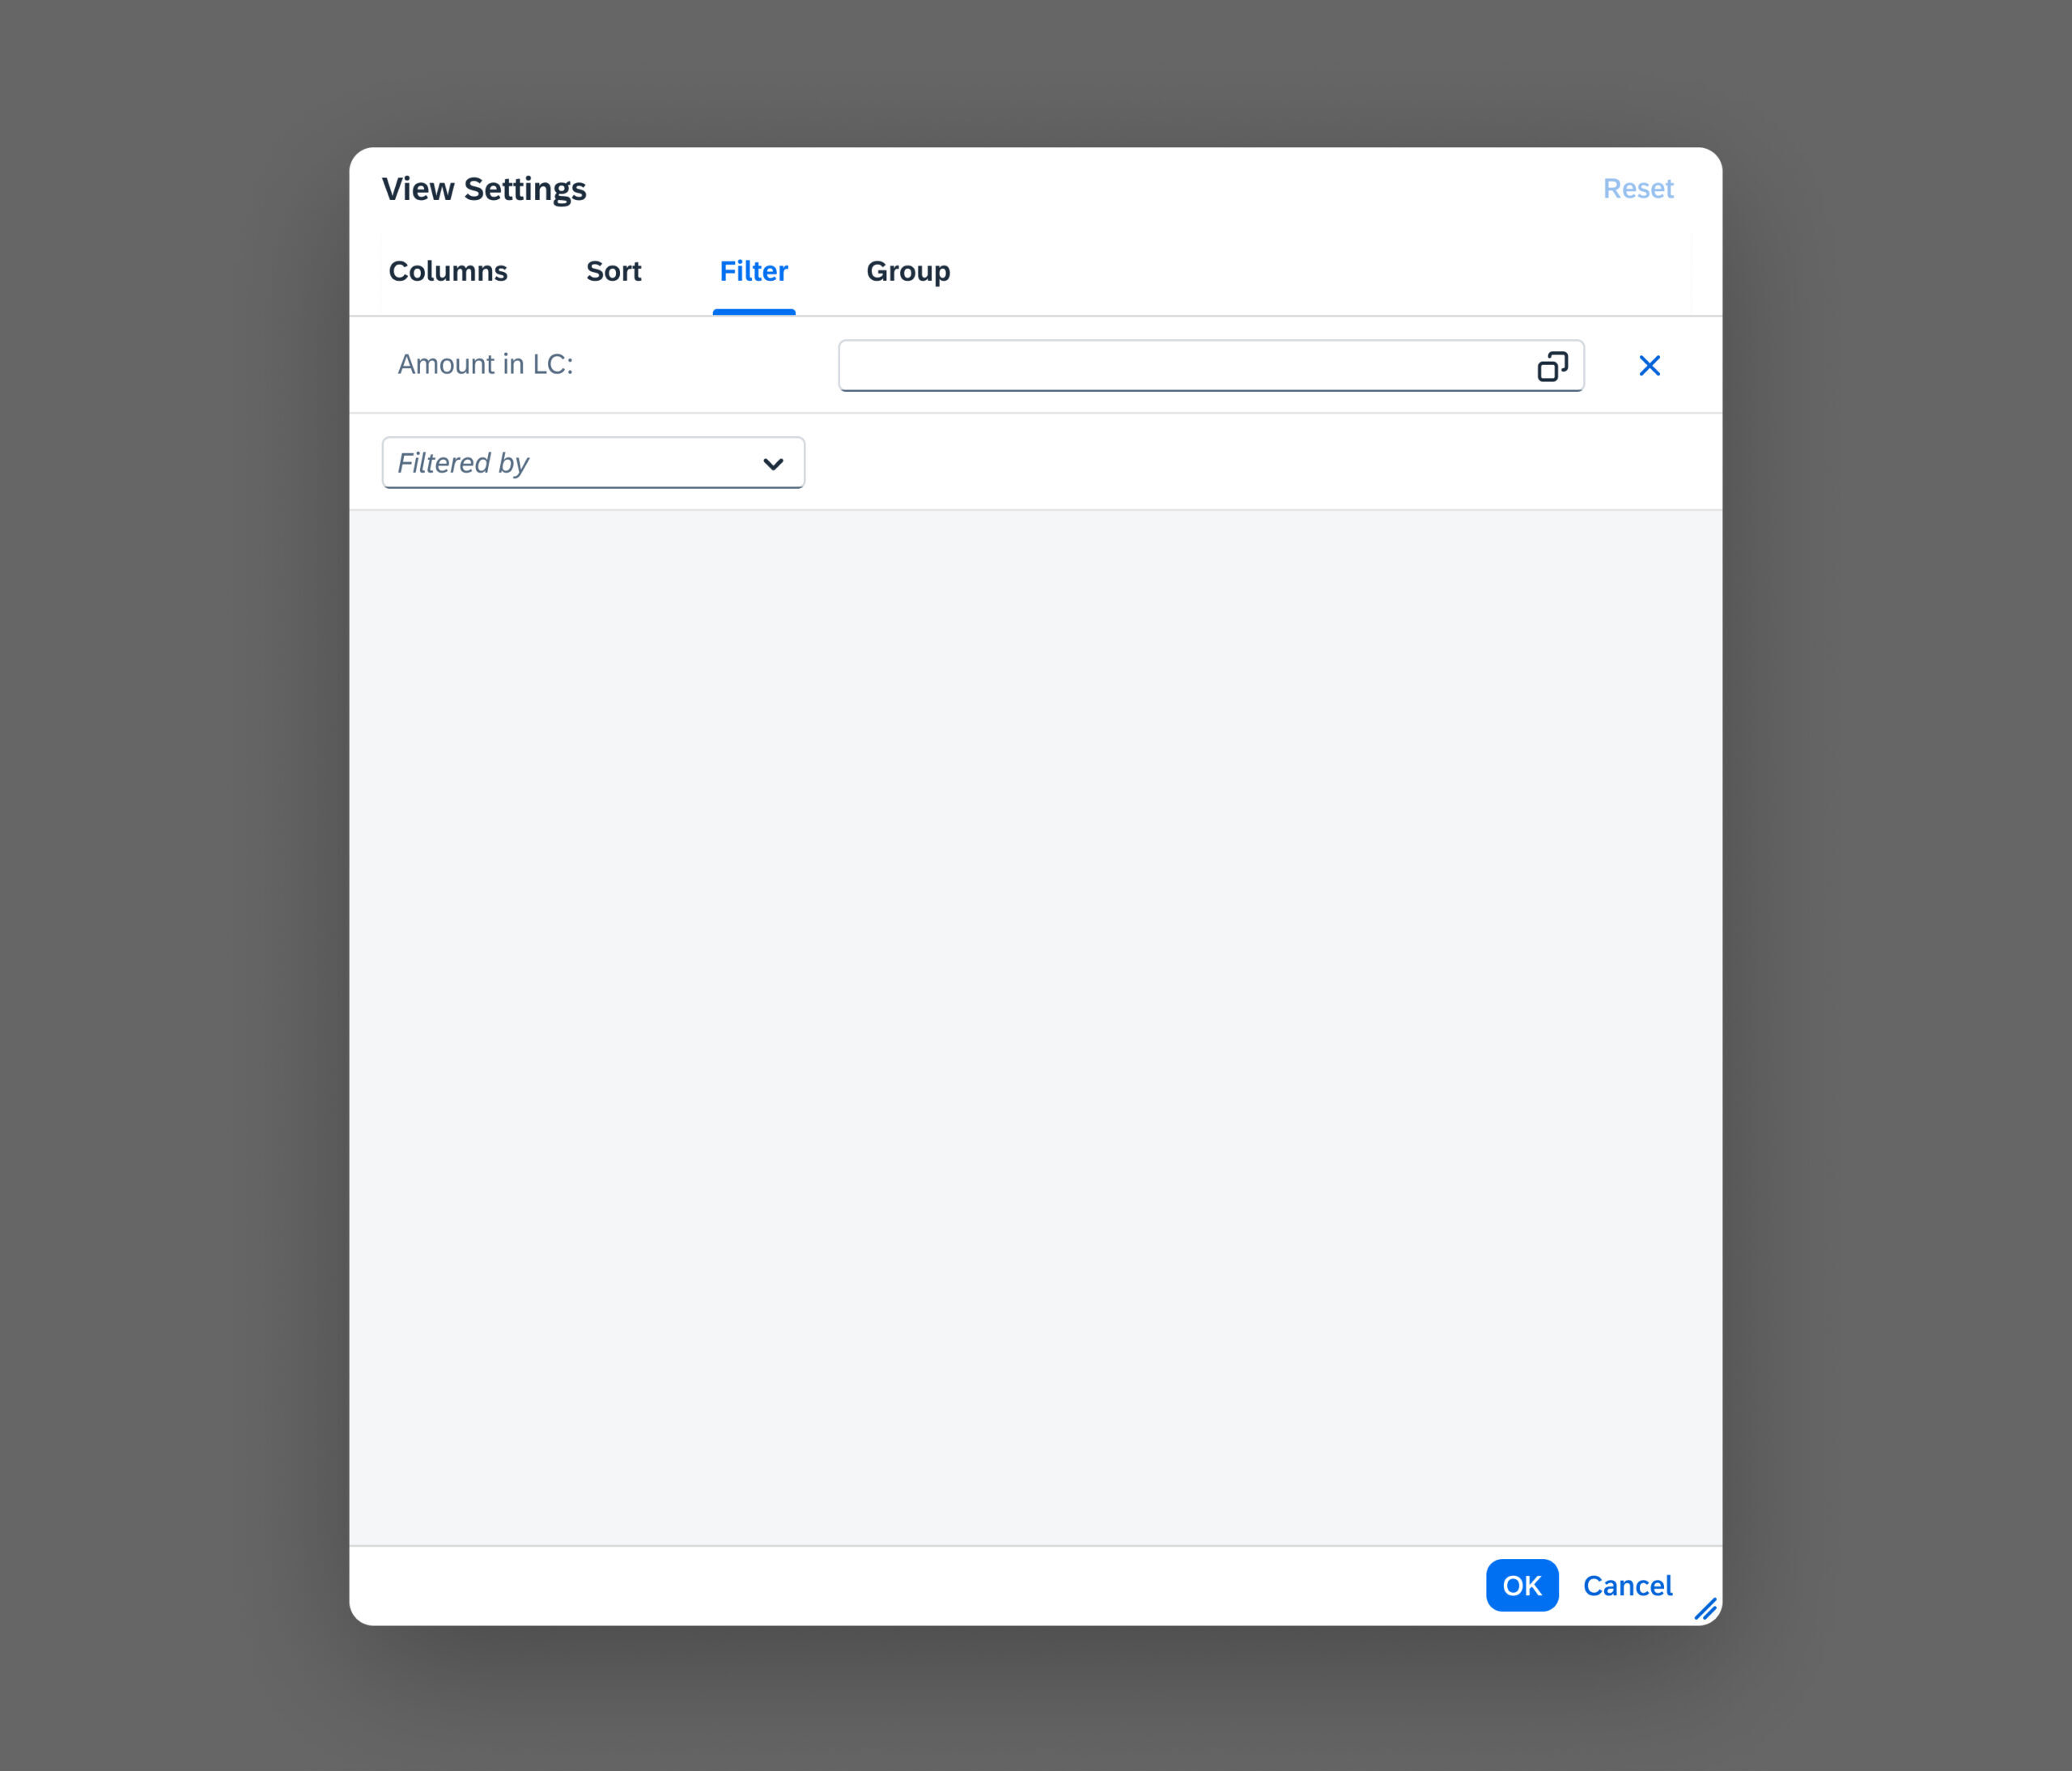
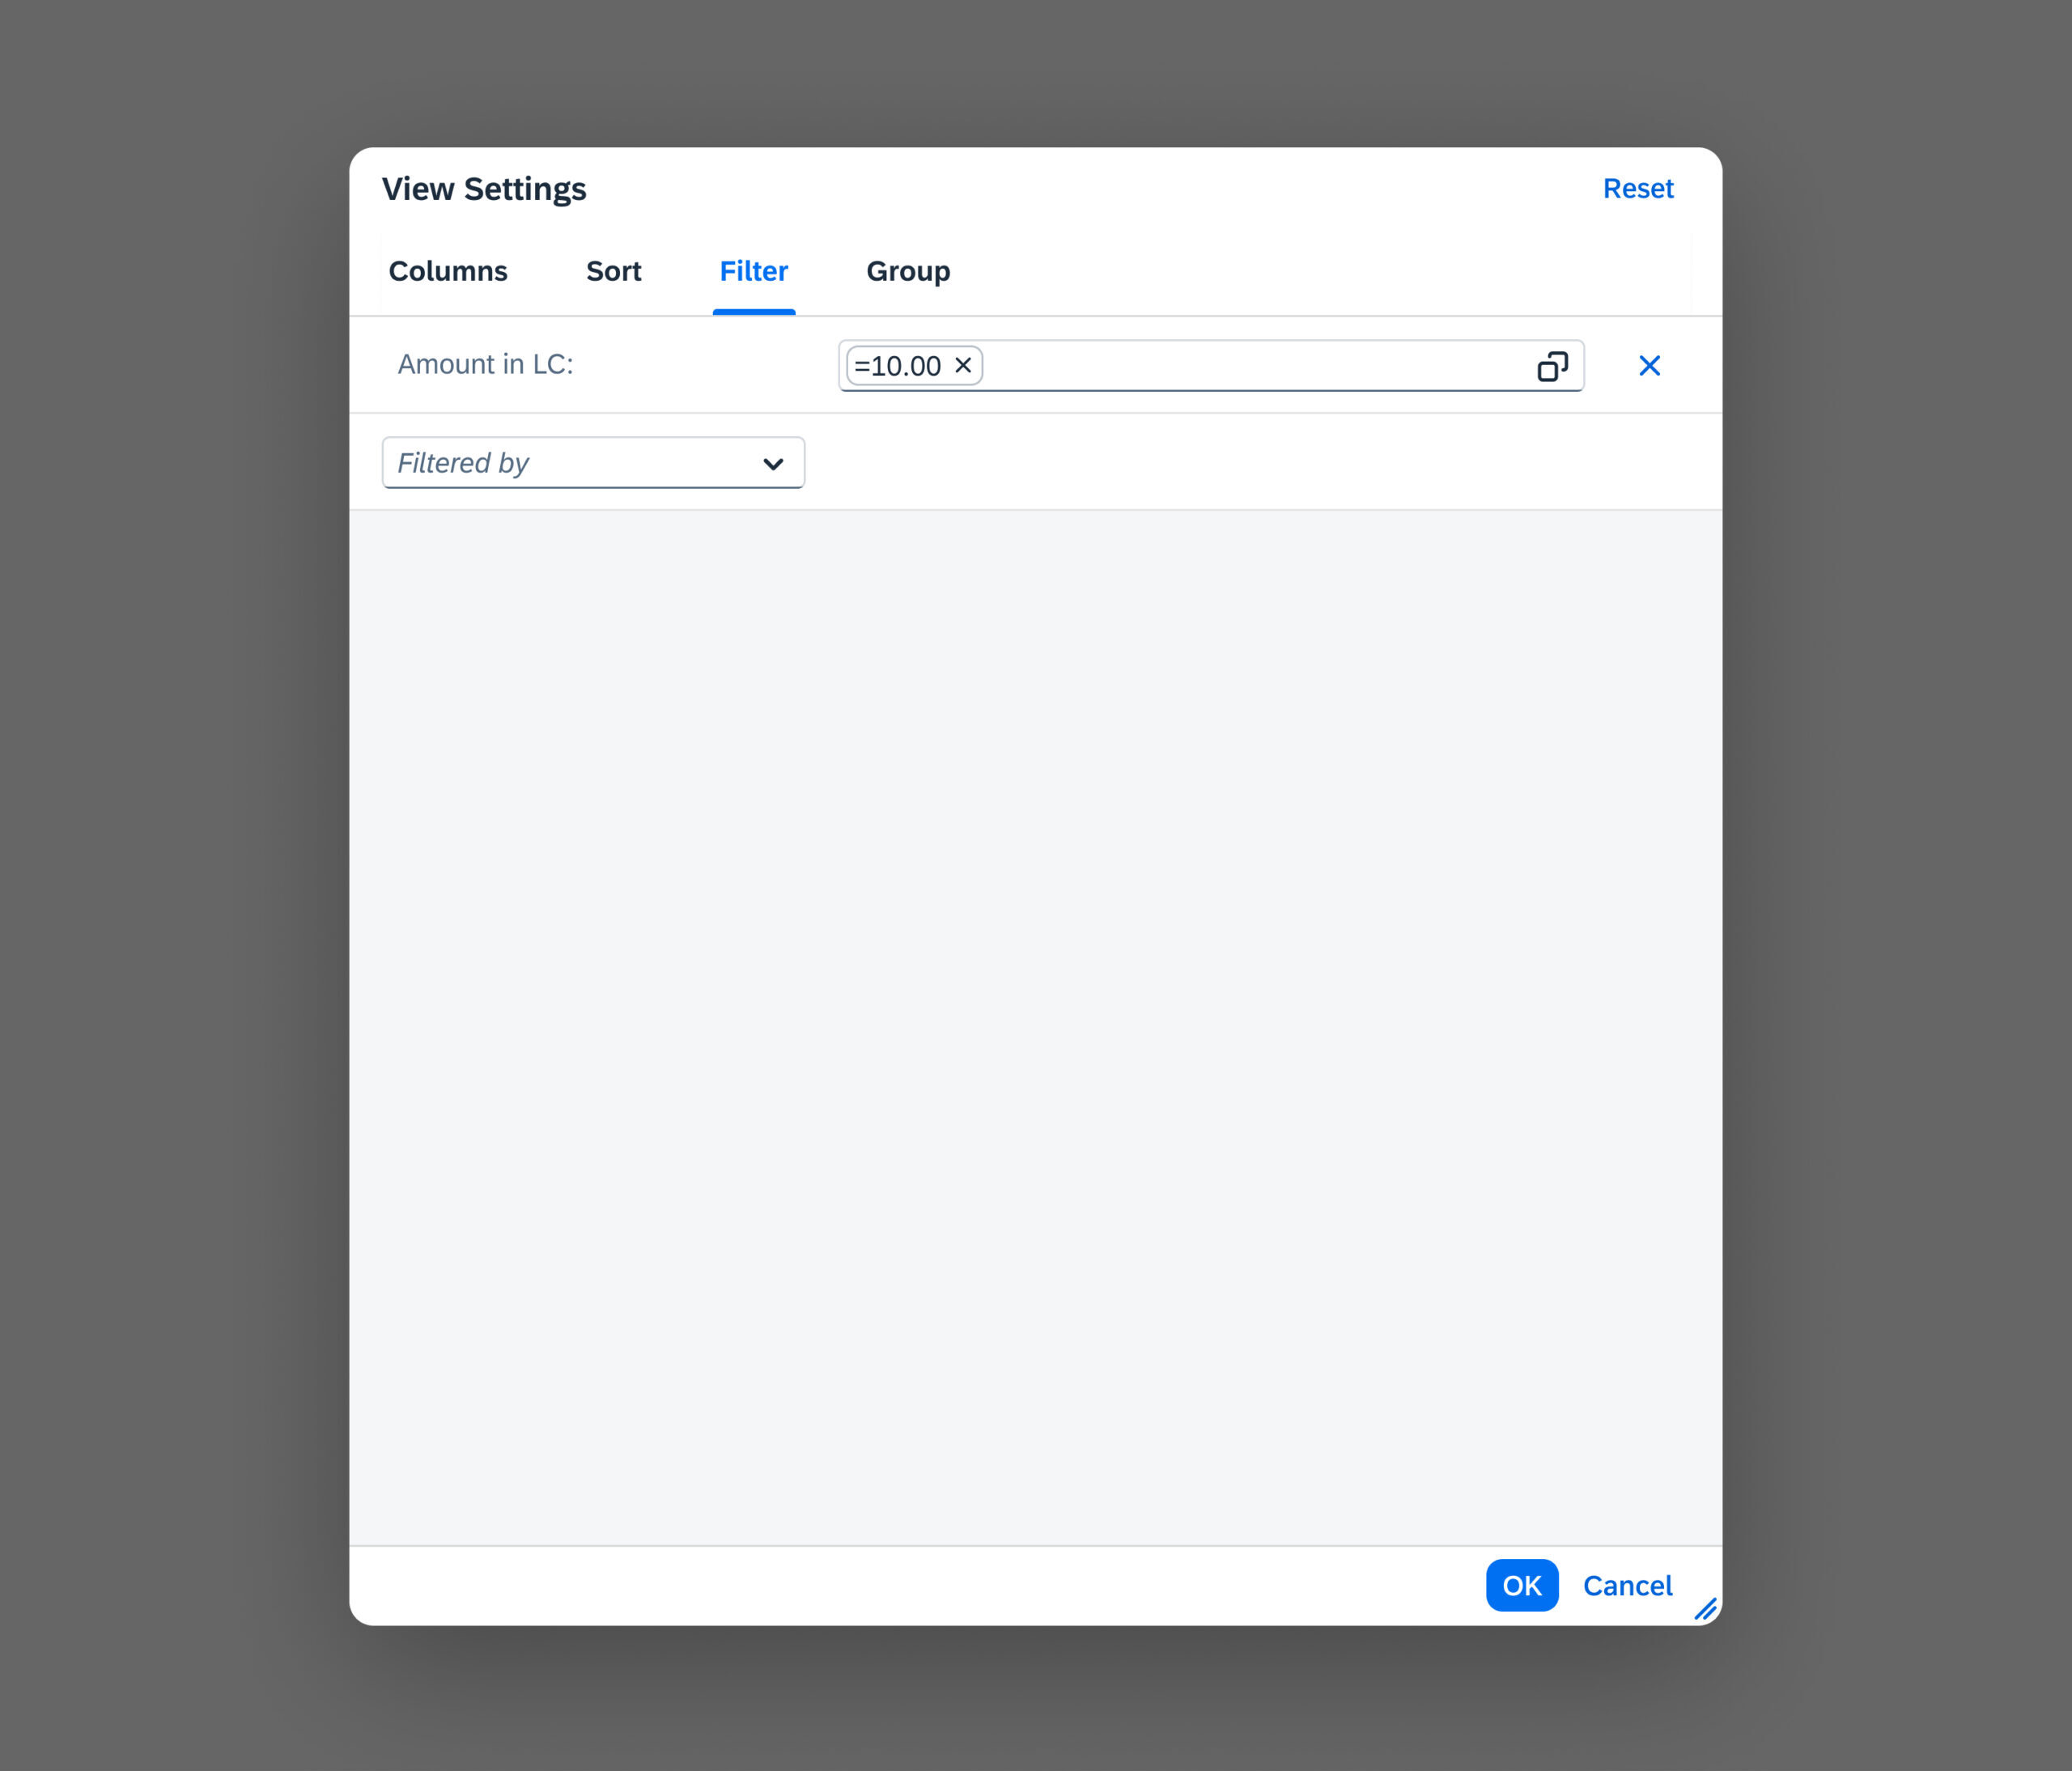
The Filter tab allows users to filter the table or chart information according to specific criteria.
Once a filter criterion is entered, a new line appears for entering another one. Users can remove filters by clicking the (Remove Filter) icon at the end of each filter item.
Filter Criterion
In the first input field, the user selects the column (for tables) or the dimension/measure (for charts) to be filtered. Any column or dimension/measure can be selected, including columns and dimensions/measures that are not currently visible.
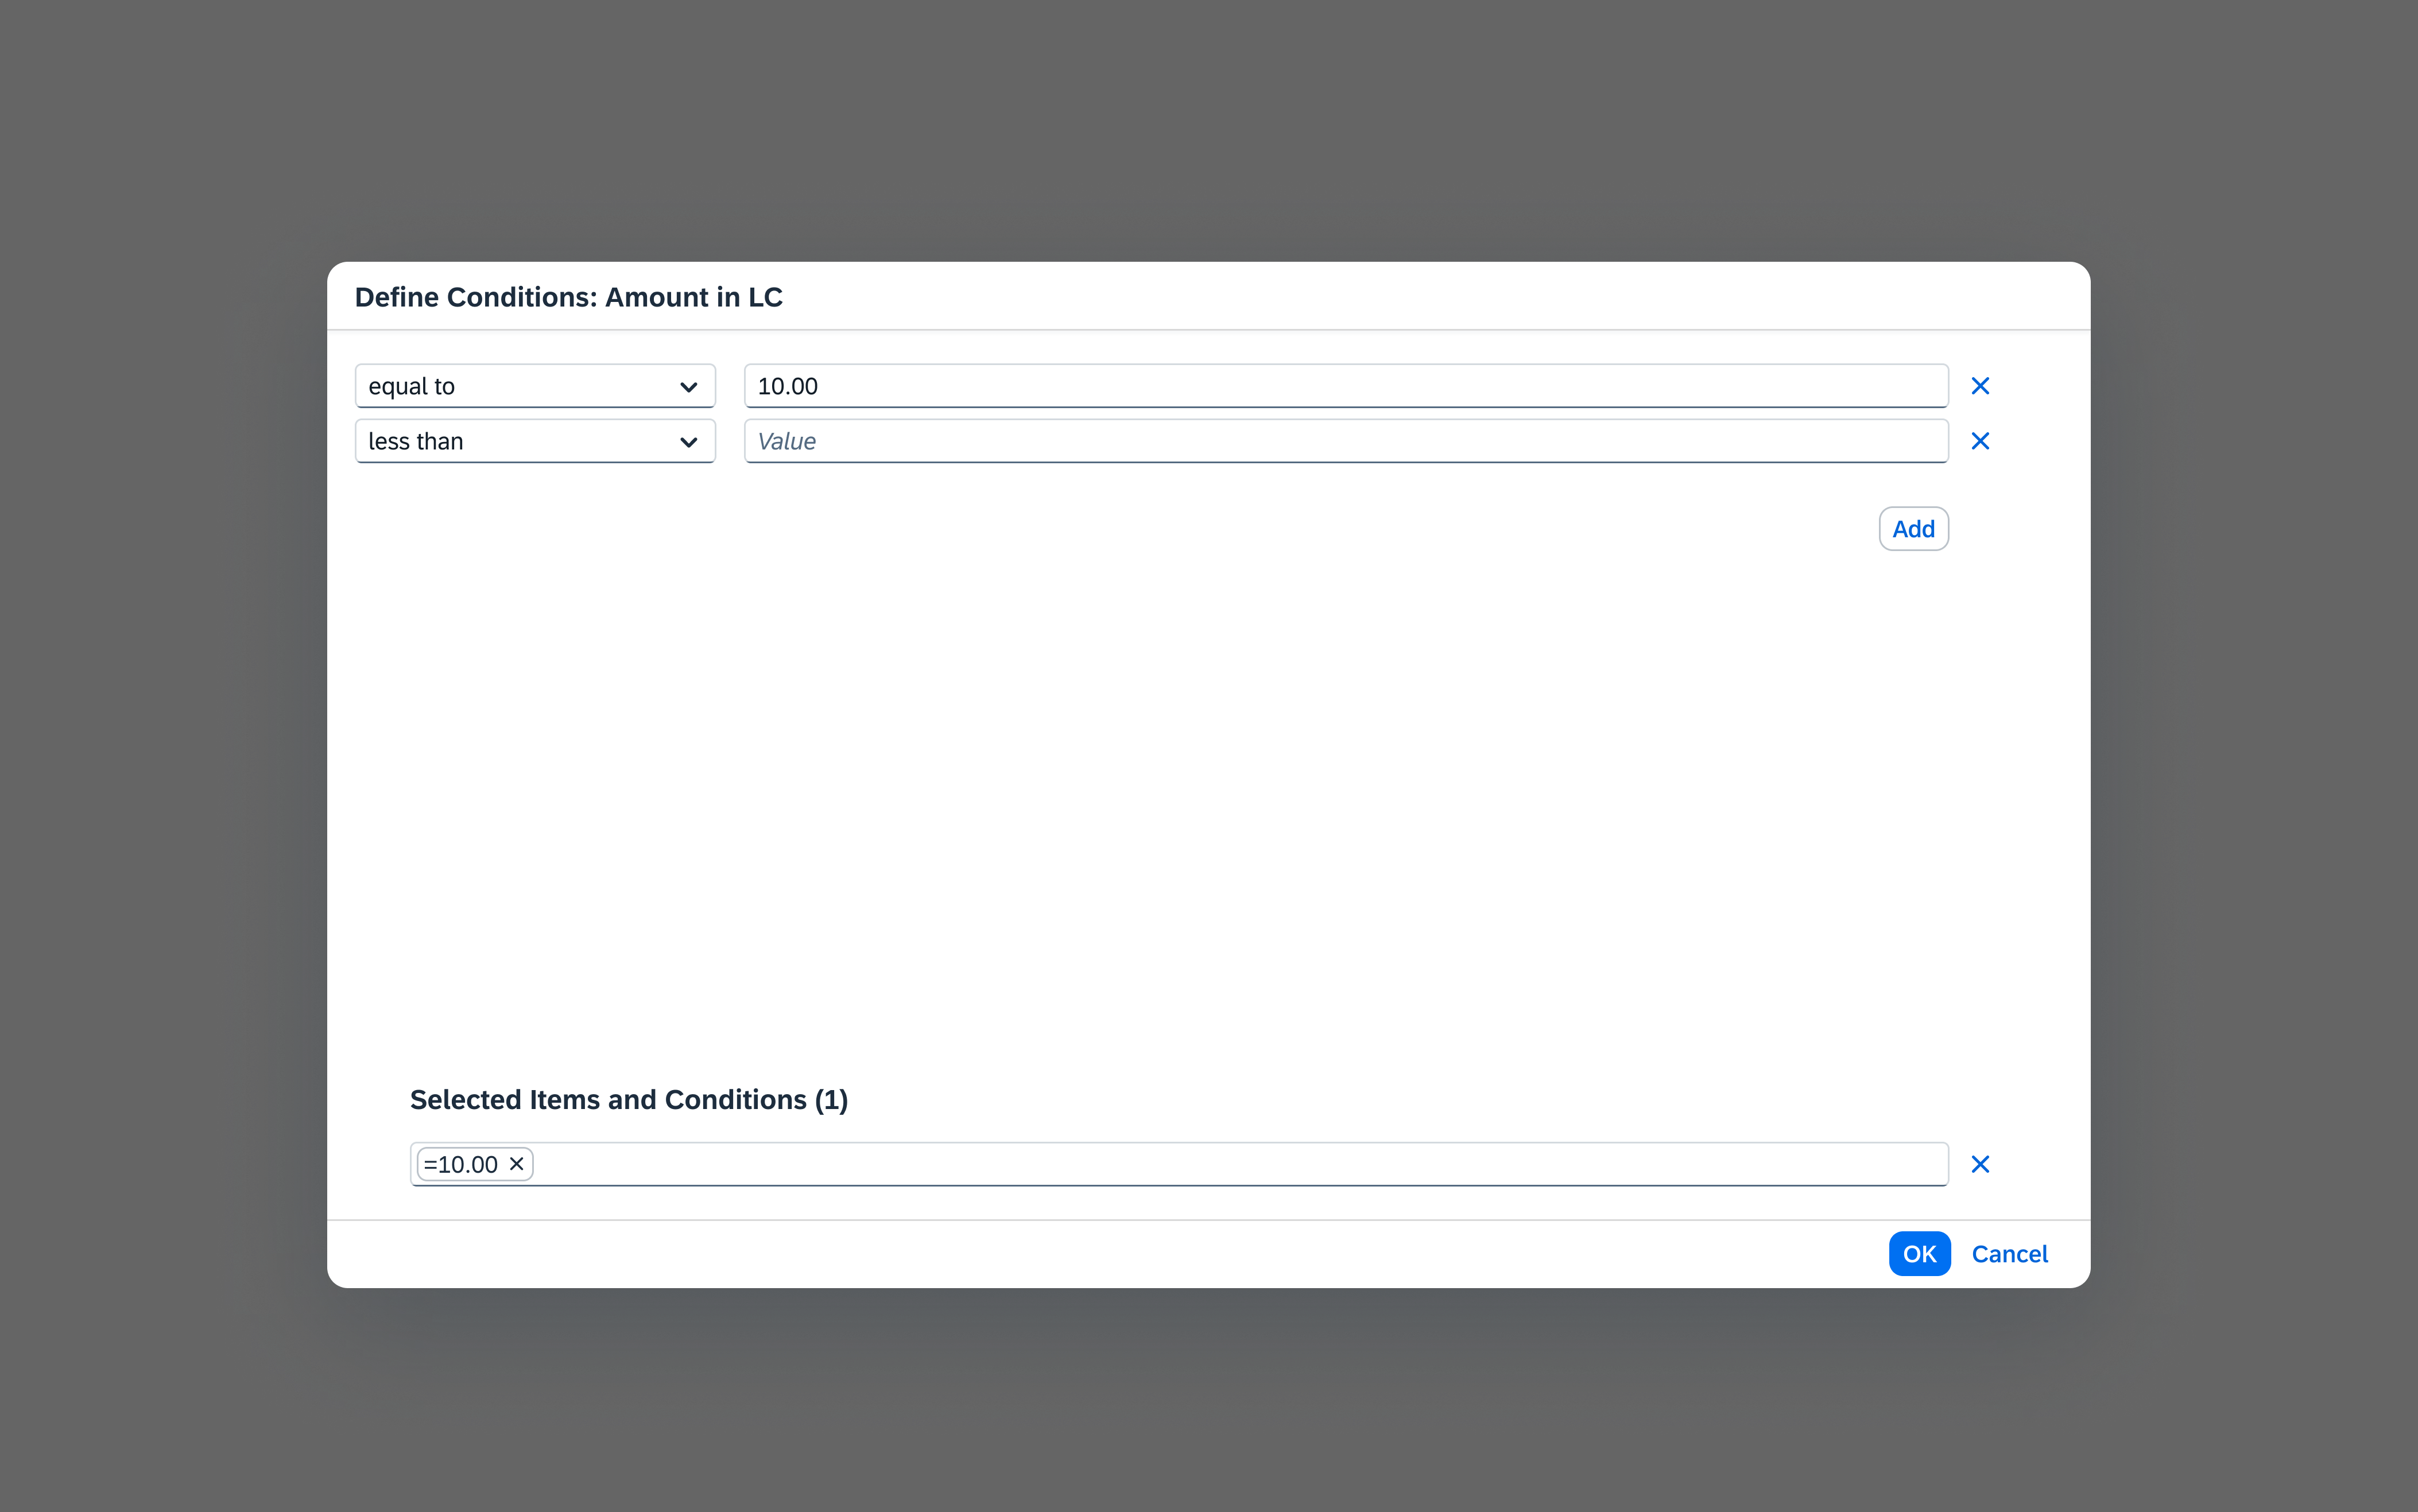
Define Conditions
The second field is an input field which calls a Value Help Dialog when the user clicks the selection icon (value help icon) in the input field.
The first input field in the value help dialog contains the operator that is applied to the filter value (such as greater than or not before).
To include or exclude filter criteria, the user selects the relevant operator from the Include or Exclude section of the dropdown list. For example, equal to to include a value, or not equal to to exclude it.
If individual filter criteria have Boolean values, the operator is always “equal to” and the operator dropdown is disabled.
P13n Filter Settings

Available operators:
String (Text)
- between
- contains
- equal to
- begins with
- ends with
- greater than
- greater than or equal to
- less than
- less than or equal to
Number
- between
- equal to
- greater than
- greater than or equal to
- less than
- less than or equal to
Date
- between
- equal to
- after
- on or after
- before
- before or on
Boolean (true/false)
- equal to
Value
The second field in the value help dialog contains the value by which the selected column is filtered. The kind of input field that is provided depends on the data type of the selected column and the selected operator. For example, the value field for fixed or Boolean values could be a dropdown list, an input field with suggestions, or a date picker. You can also offer two or even more fields if the use case requires it.
The above mentioned guidance for filtering is applied to both the table and chart personalization.
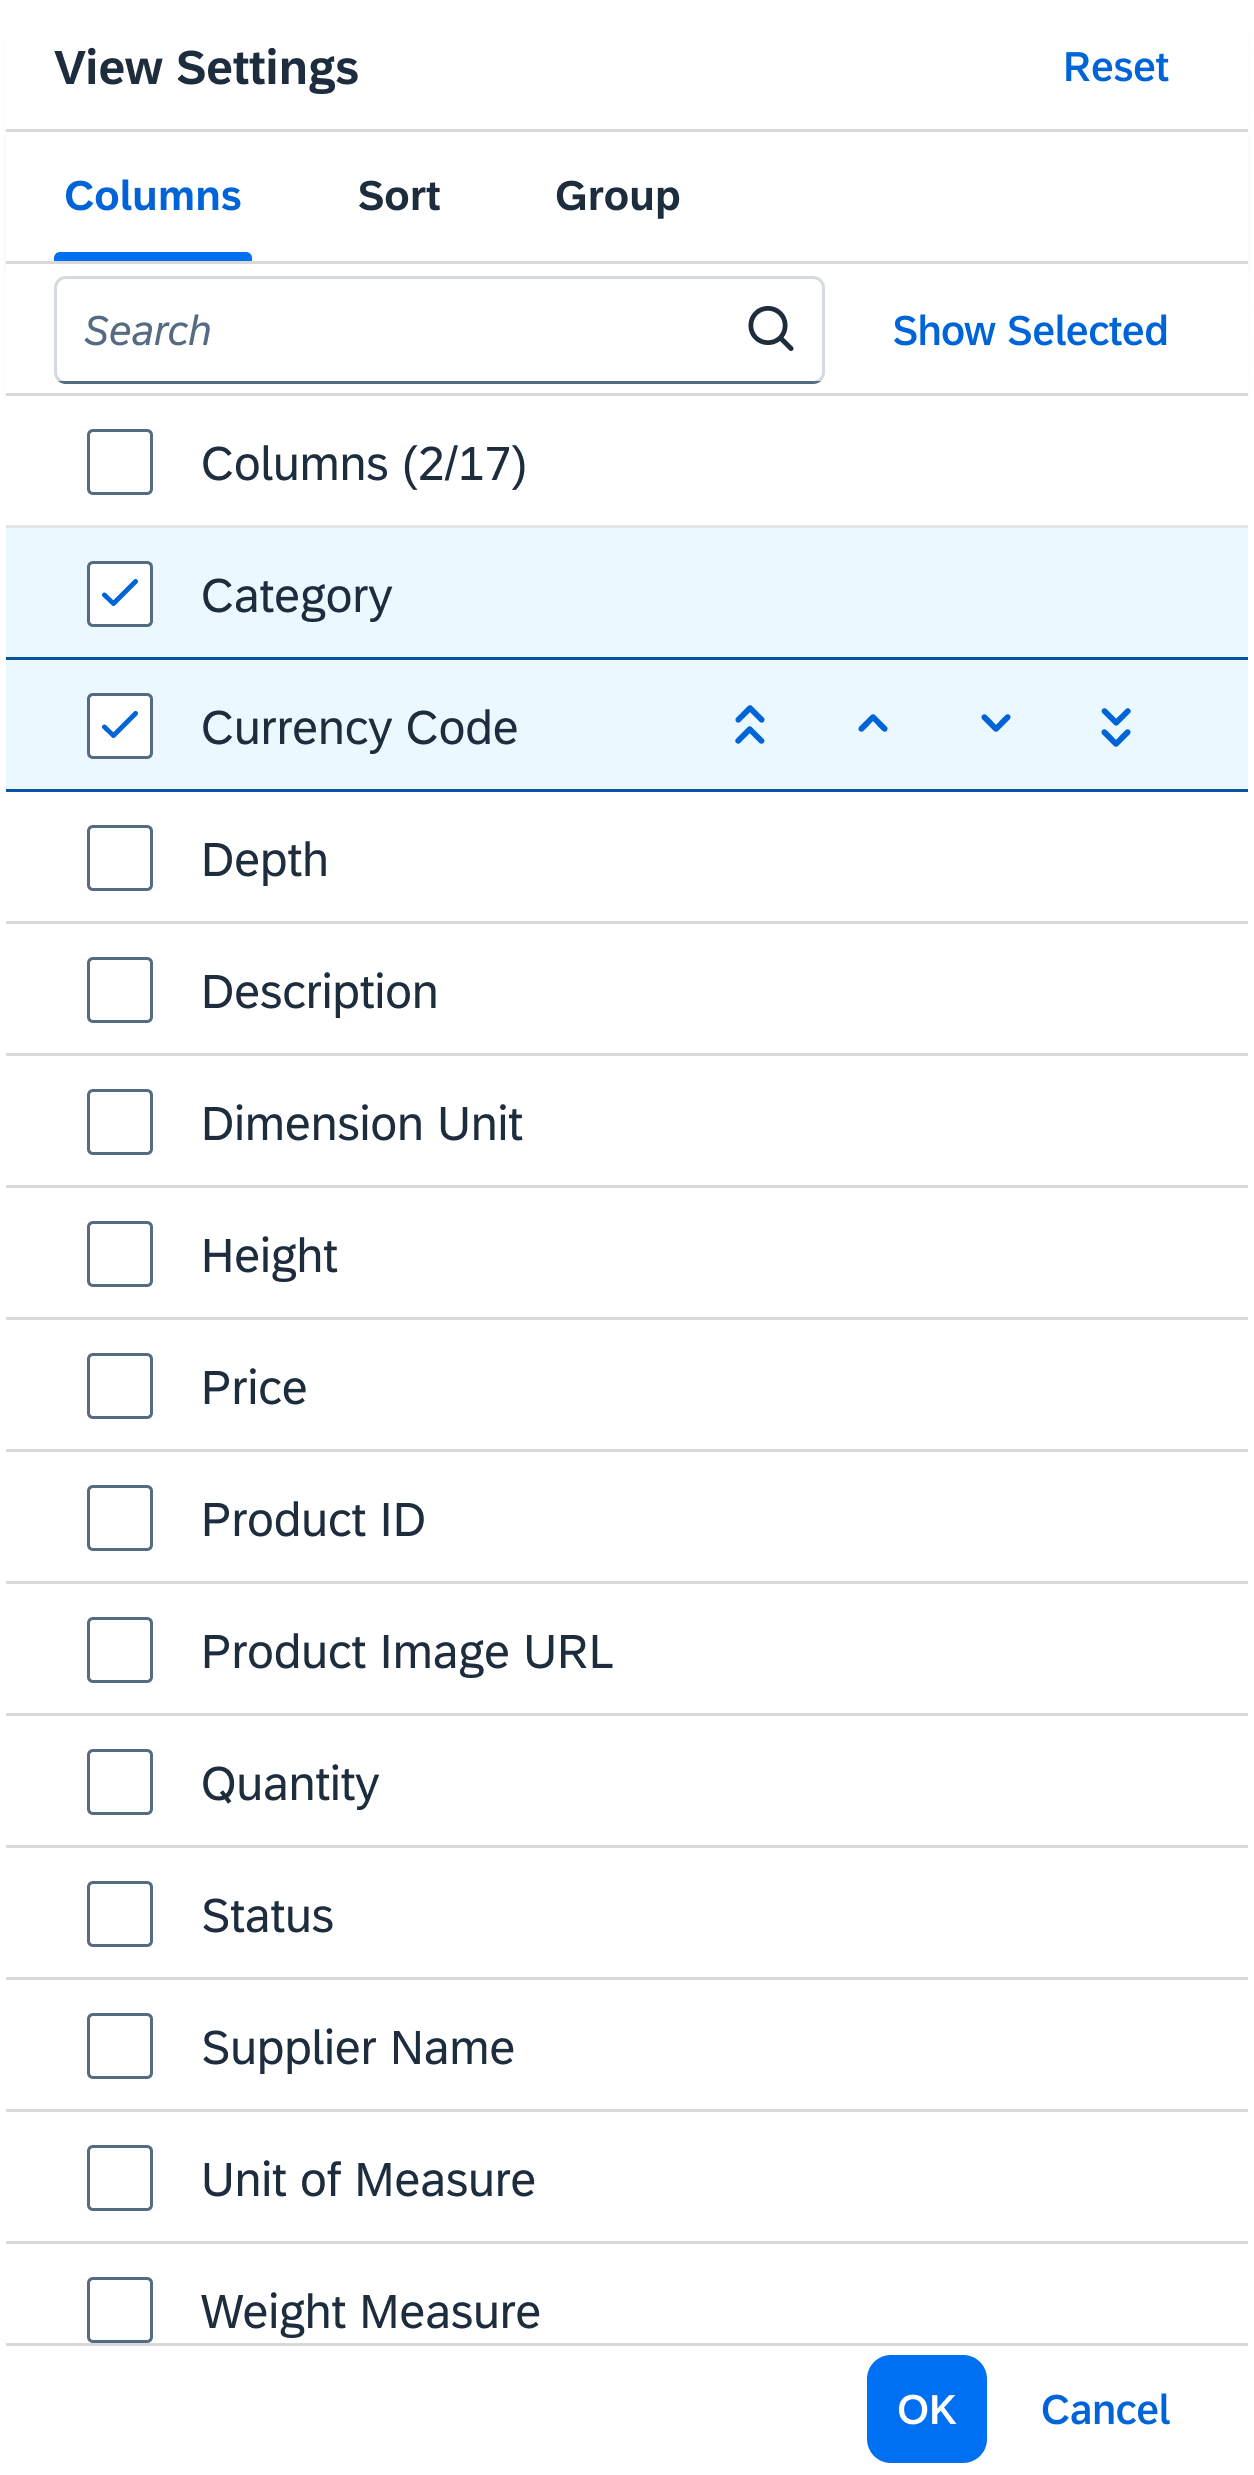
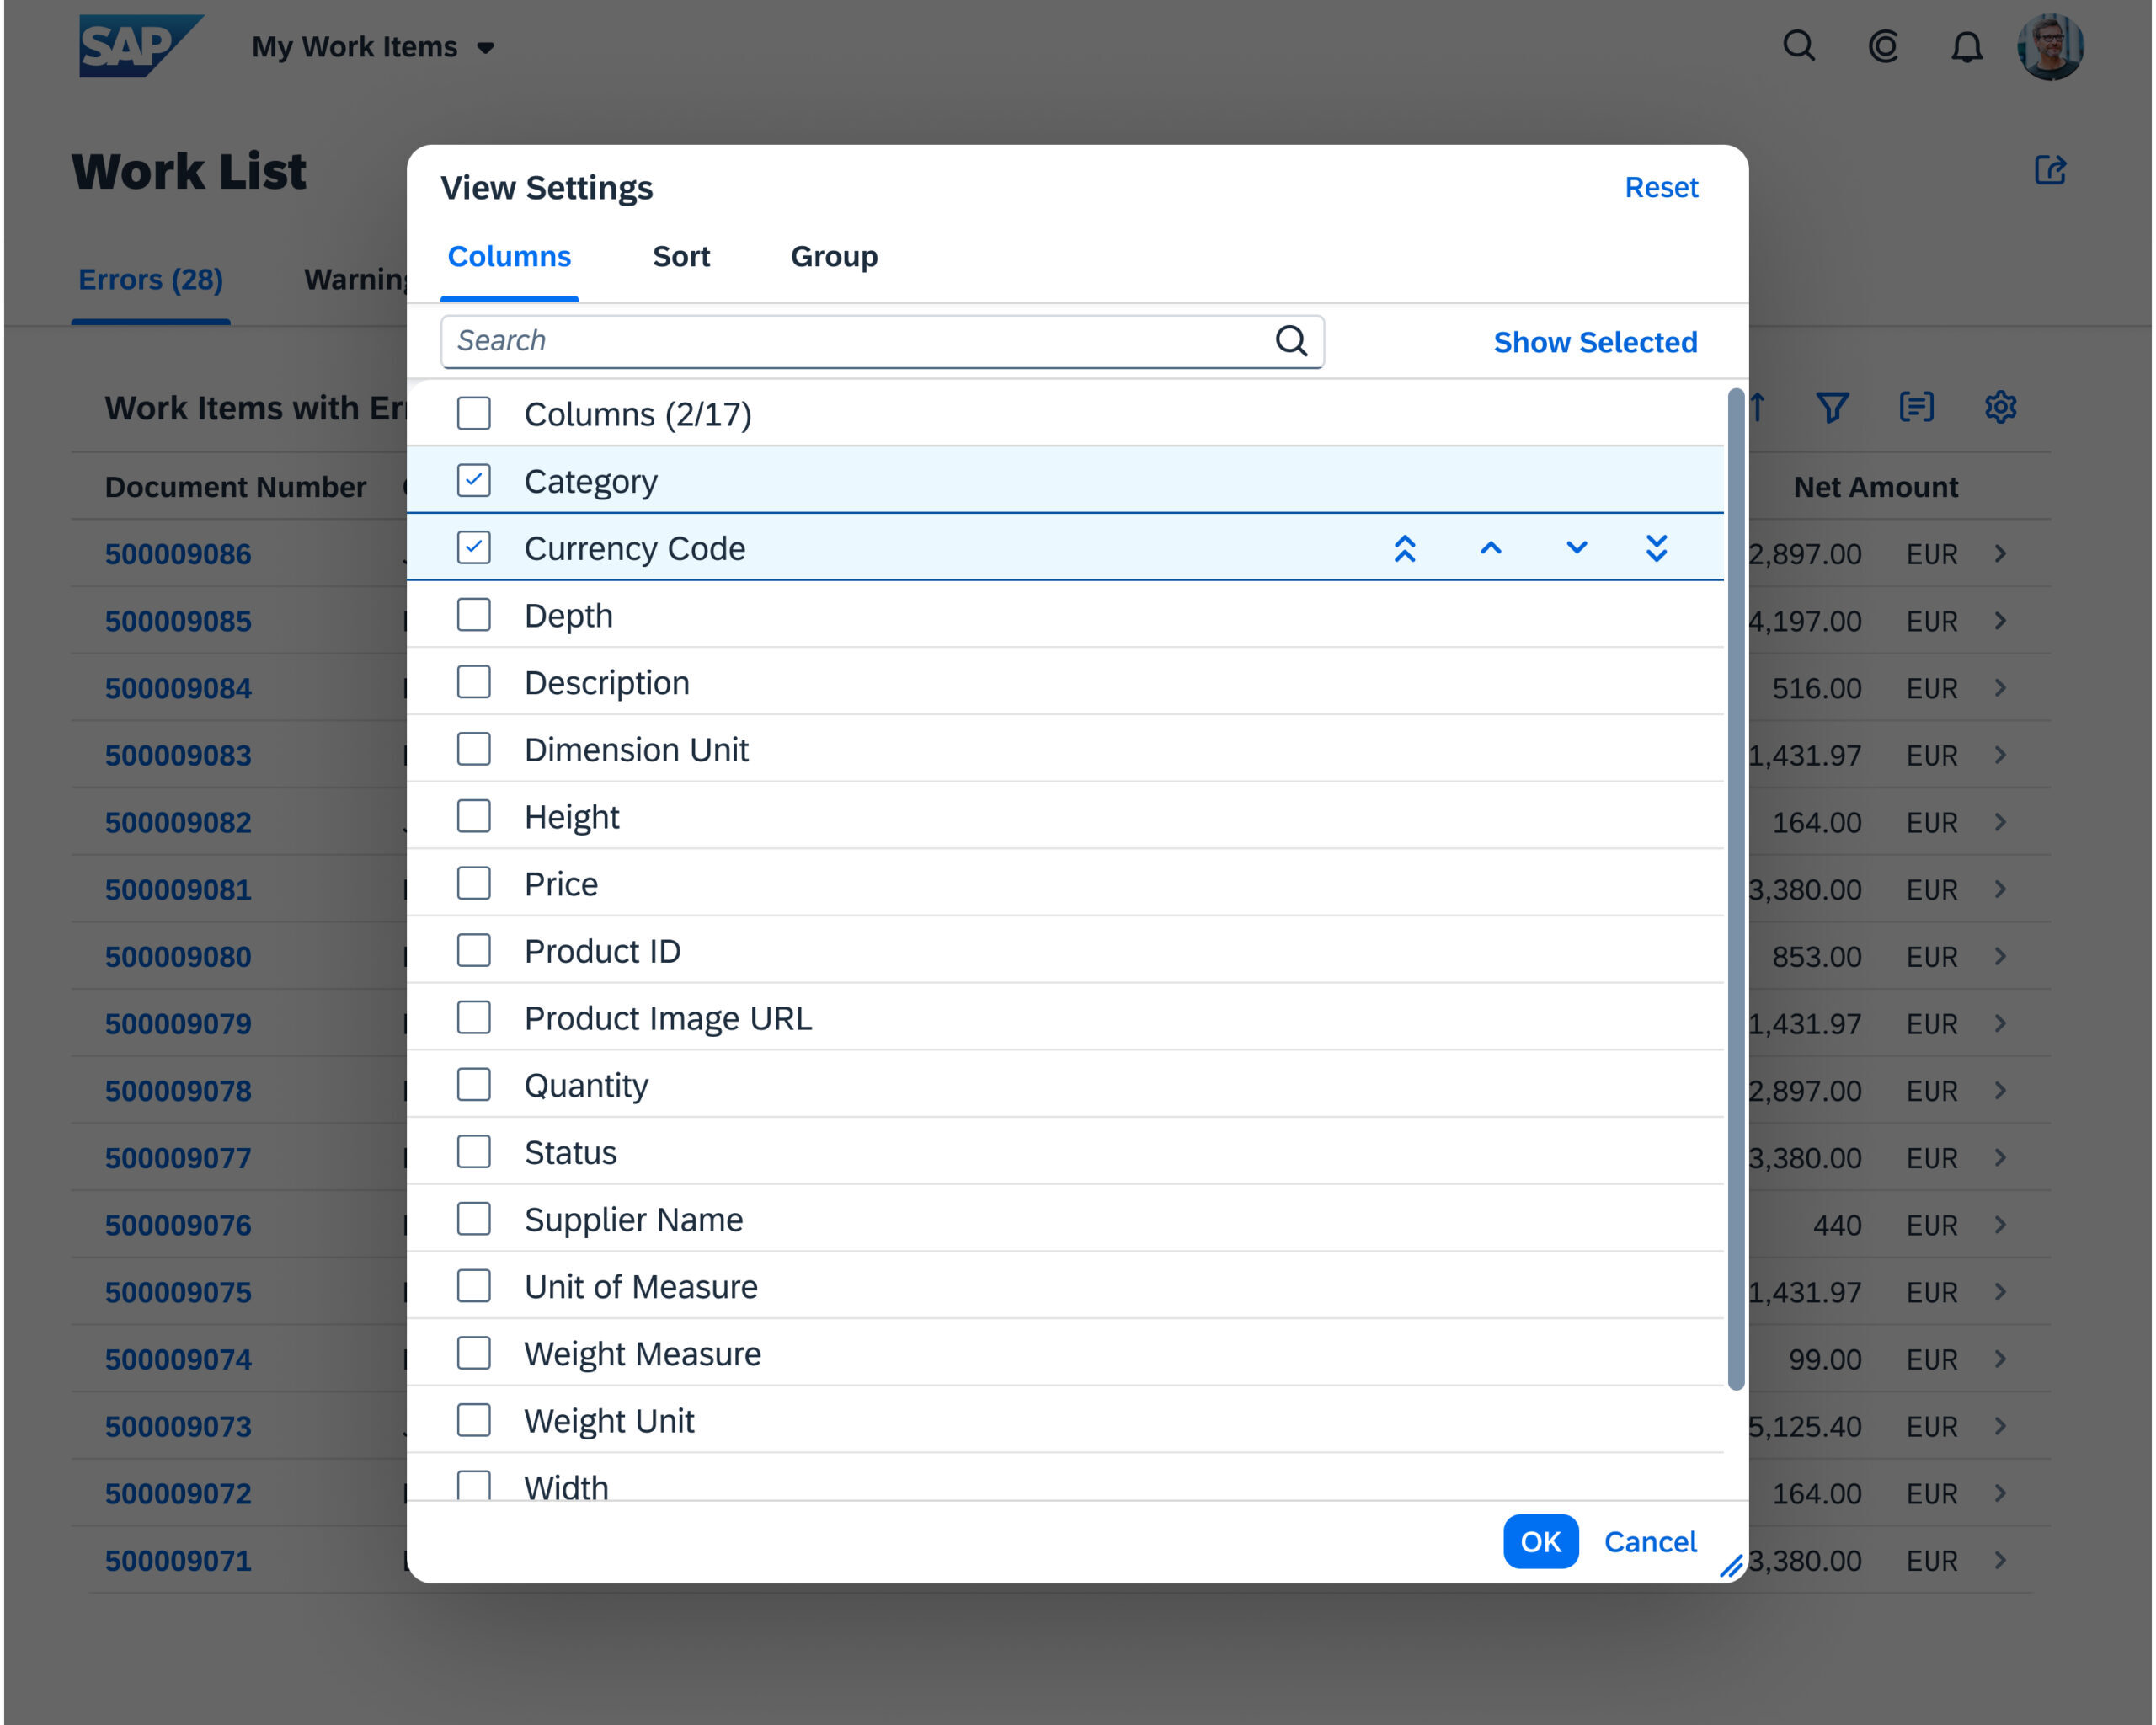
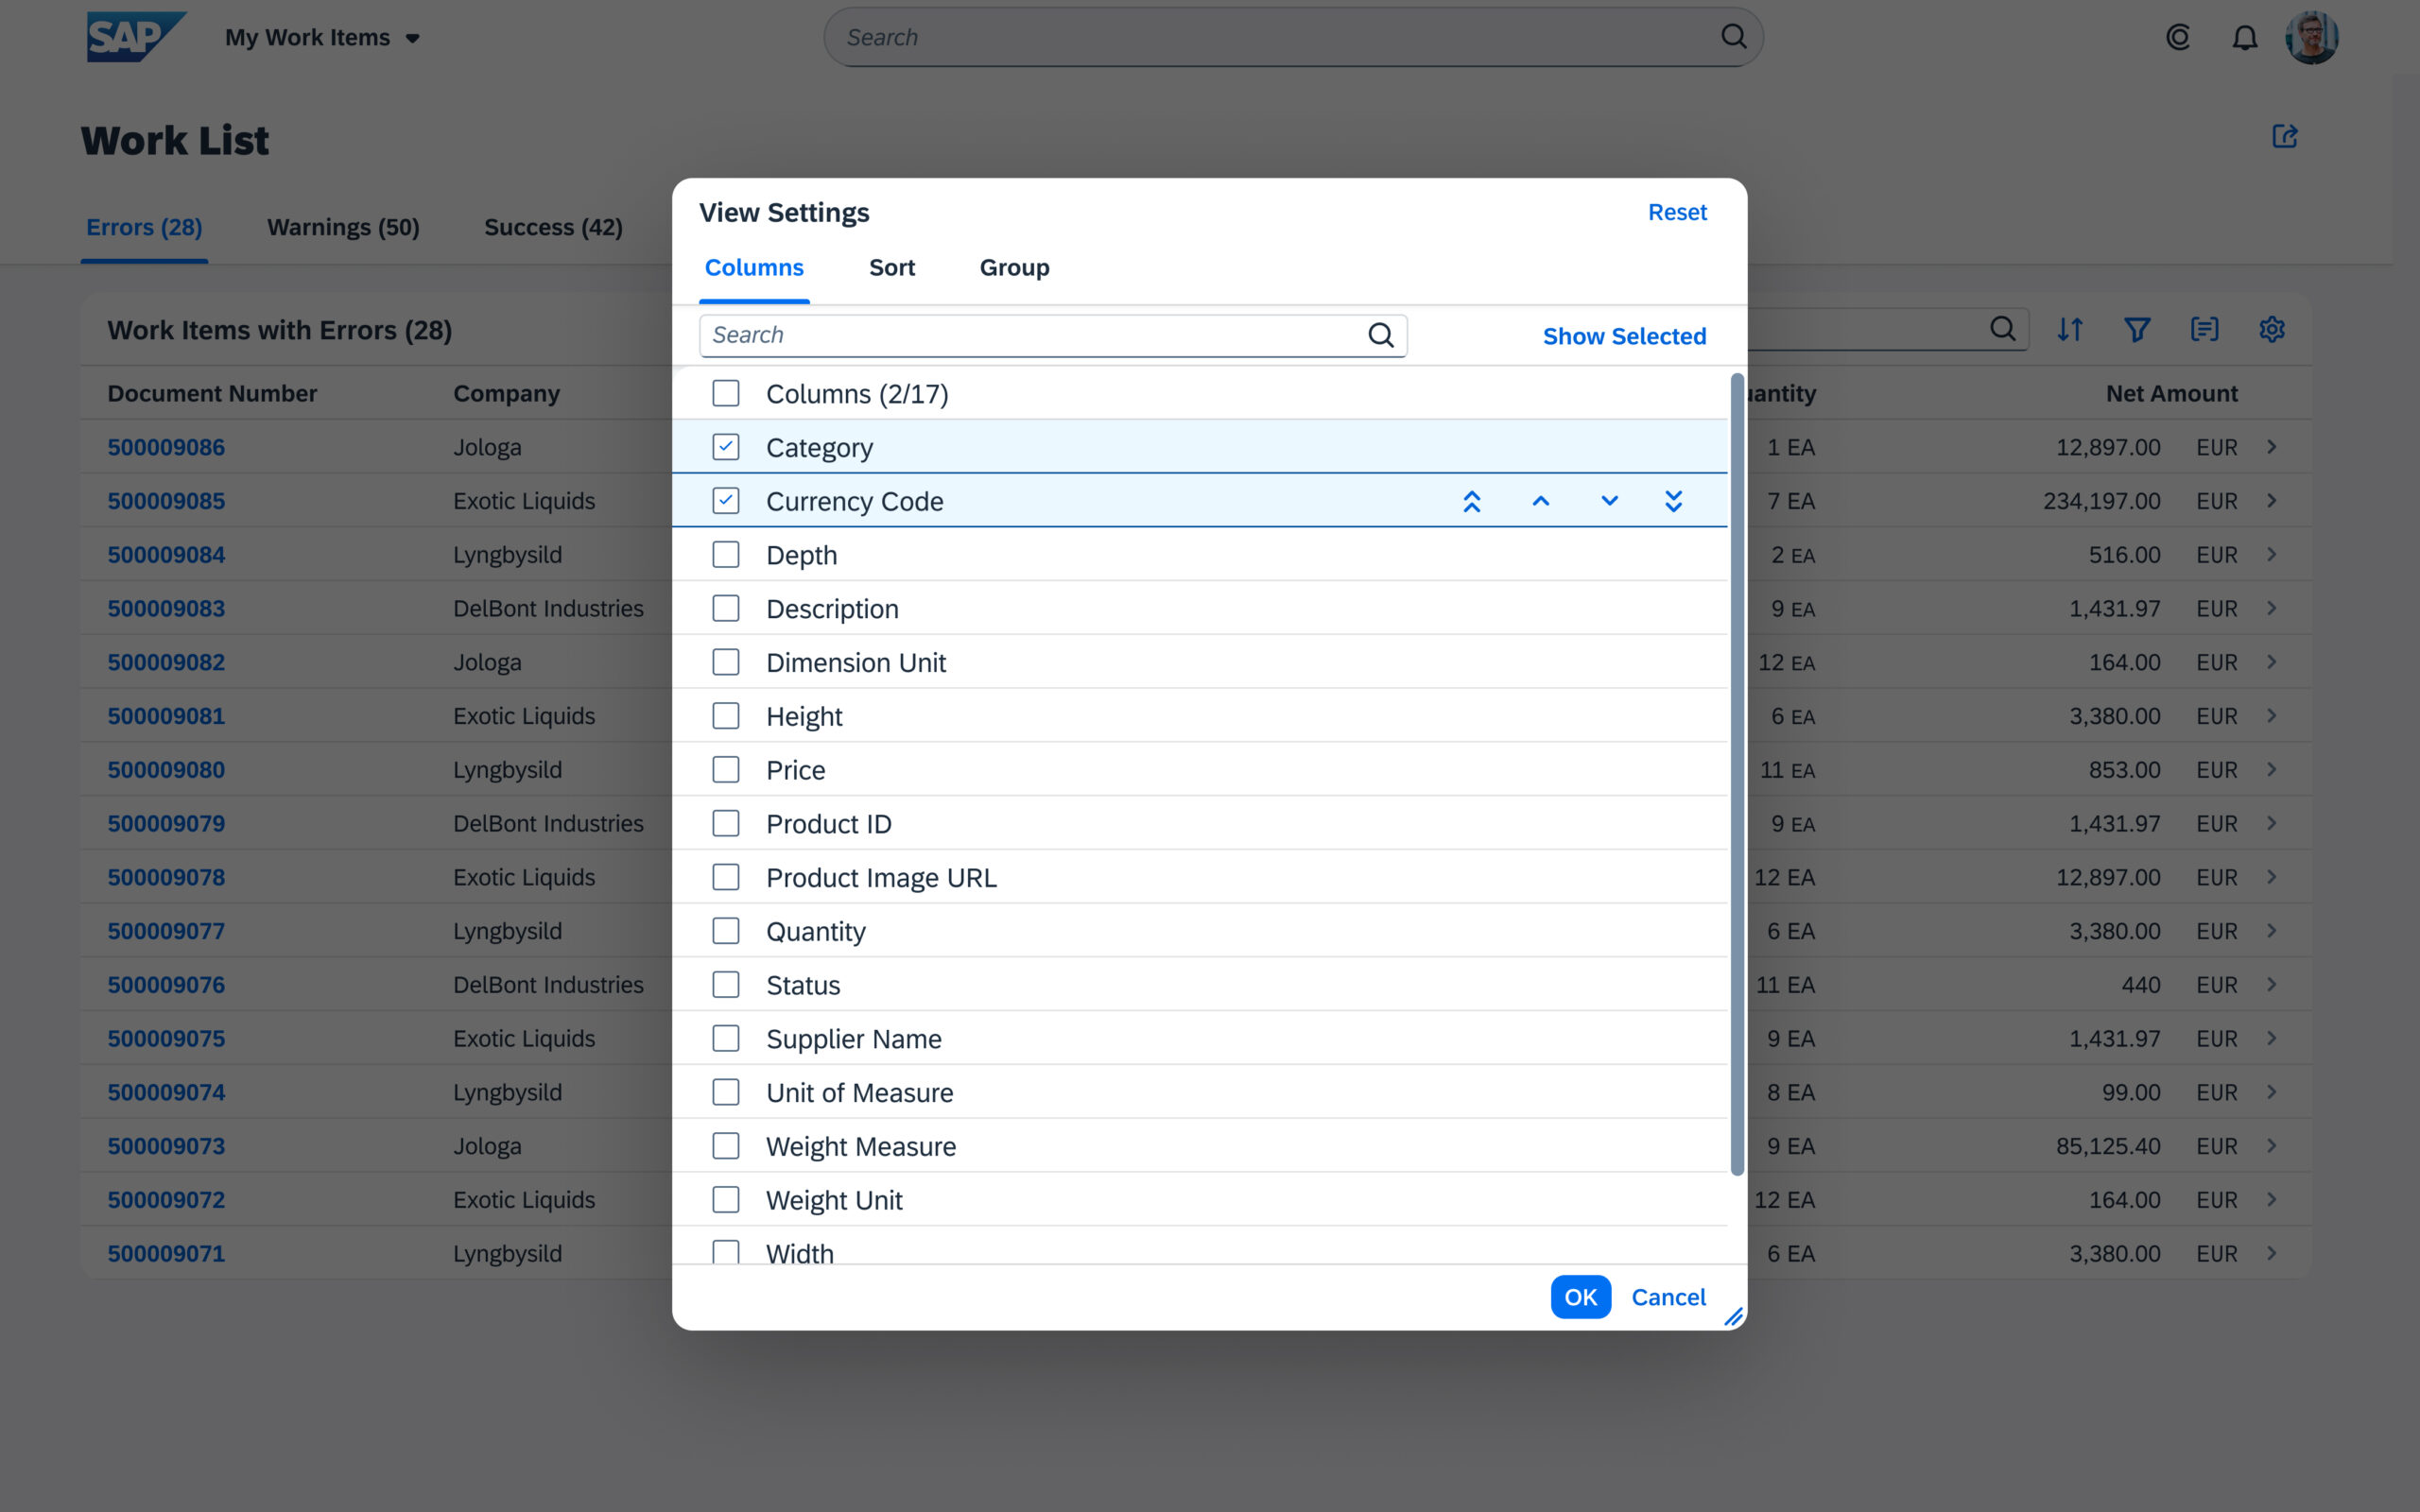
Columns
The Columns tab allows users to change the visible table columns and the order in which they are displayed.
The available columns are shown as list items with checkboxes. The checkboxes for the columns that are currently being displayed are selected.
The Show Selected / Show All button toggles the display between all columns and only those that are currently selected.
Show/Hide
To show or hide a column, users select or deselect the column checkbox.
Reorder
To change the order of the columns, users focus on a list item and use the buttons on the right-hand side of the table toolbar to move it up or down. The order of the columns from top to bottom corresponds to the order on the table from left to right.
Search
The search field in the table toolbar enables users to find a specific column more quickly. Matching columns are displayed as soon as the user starts to type.
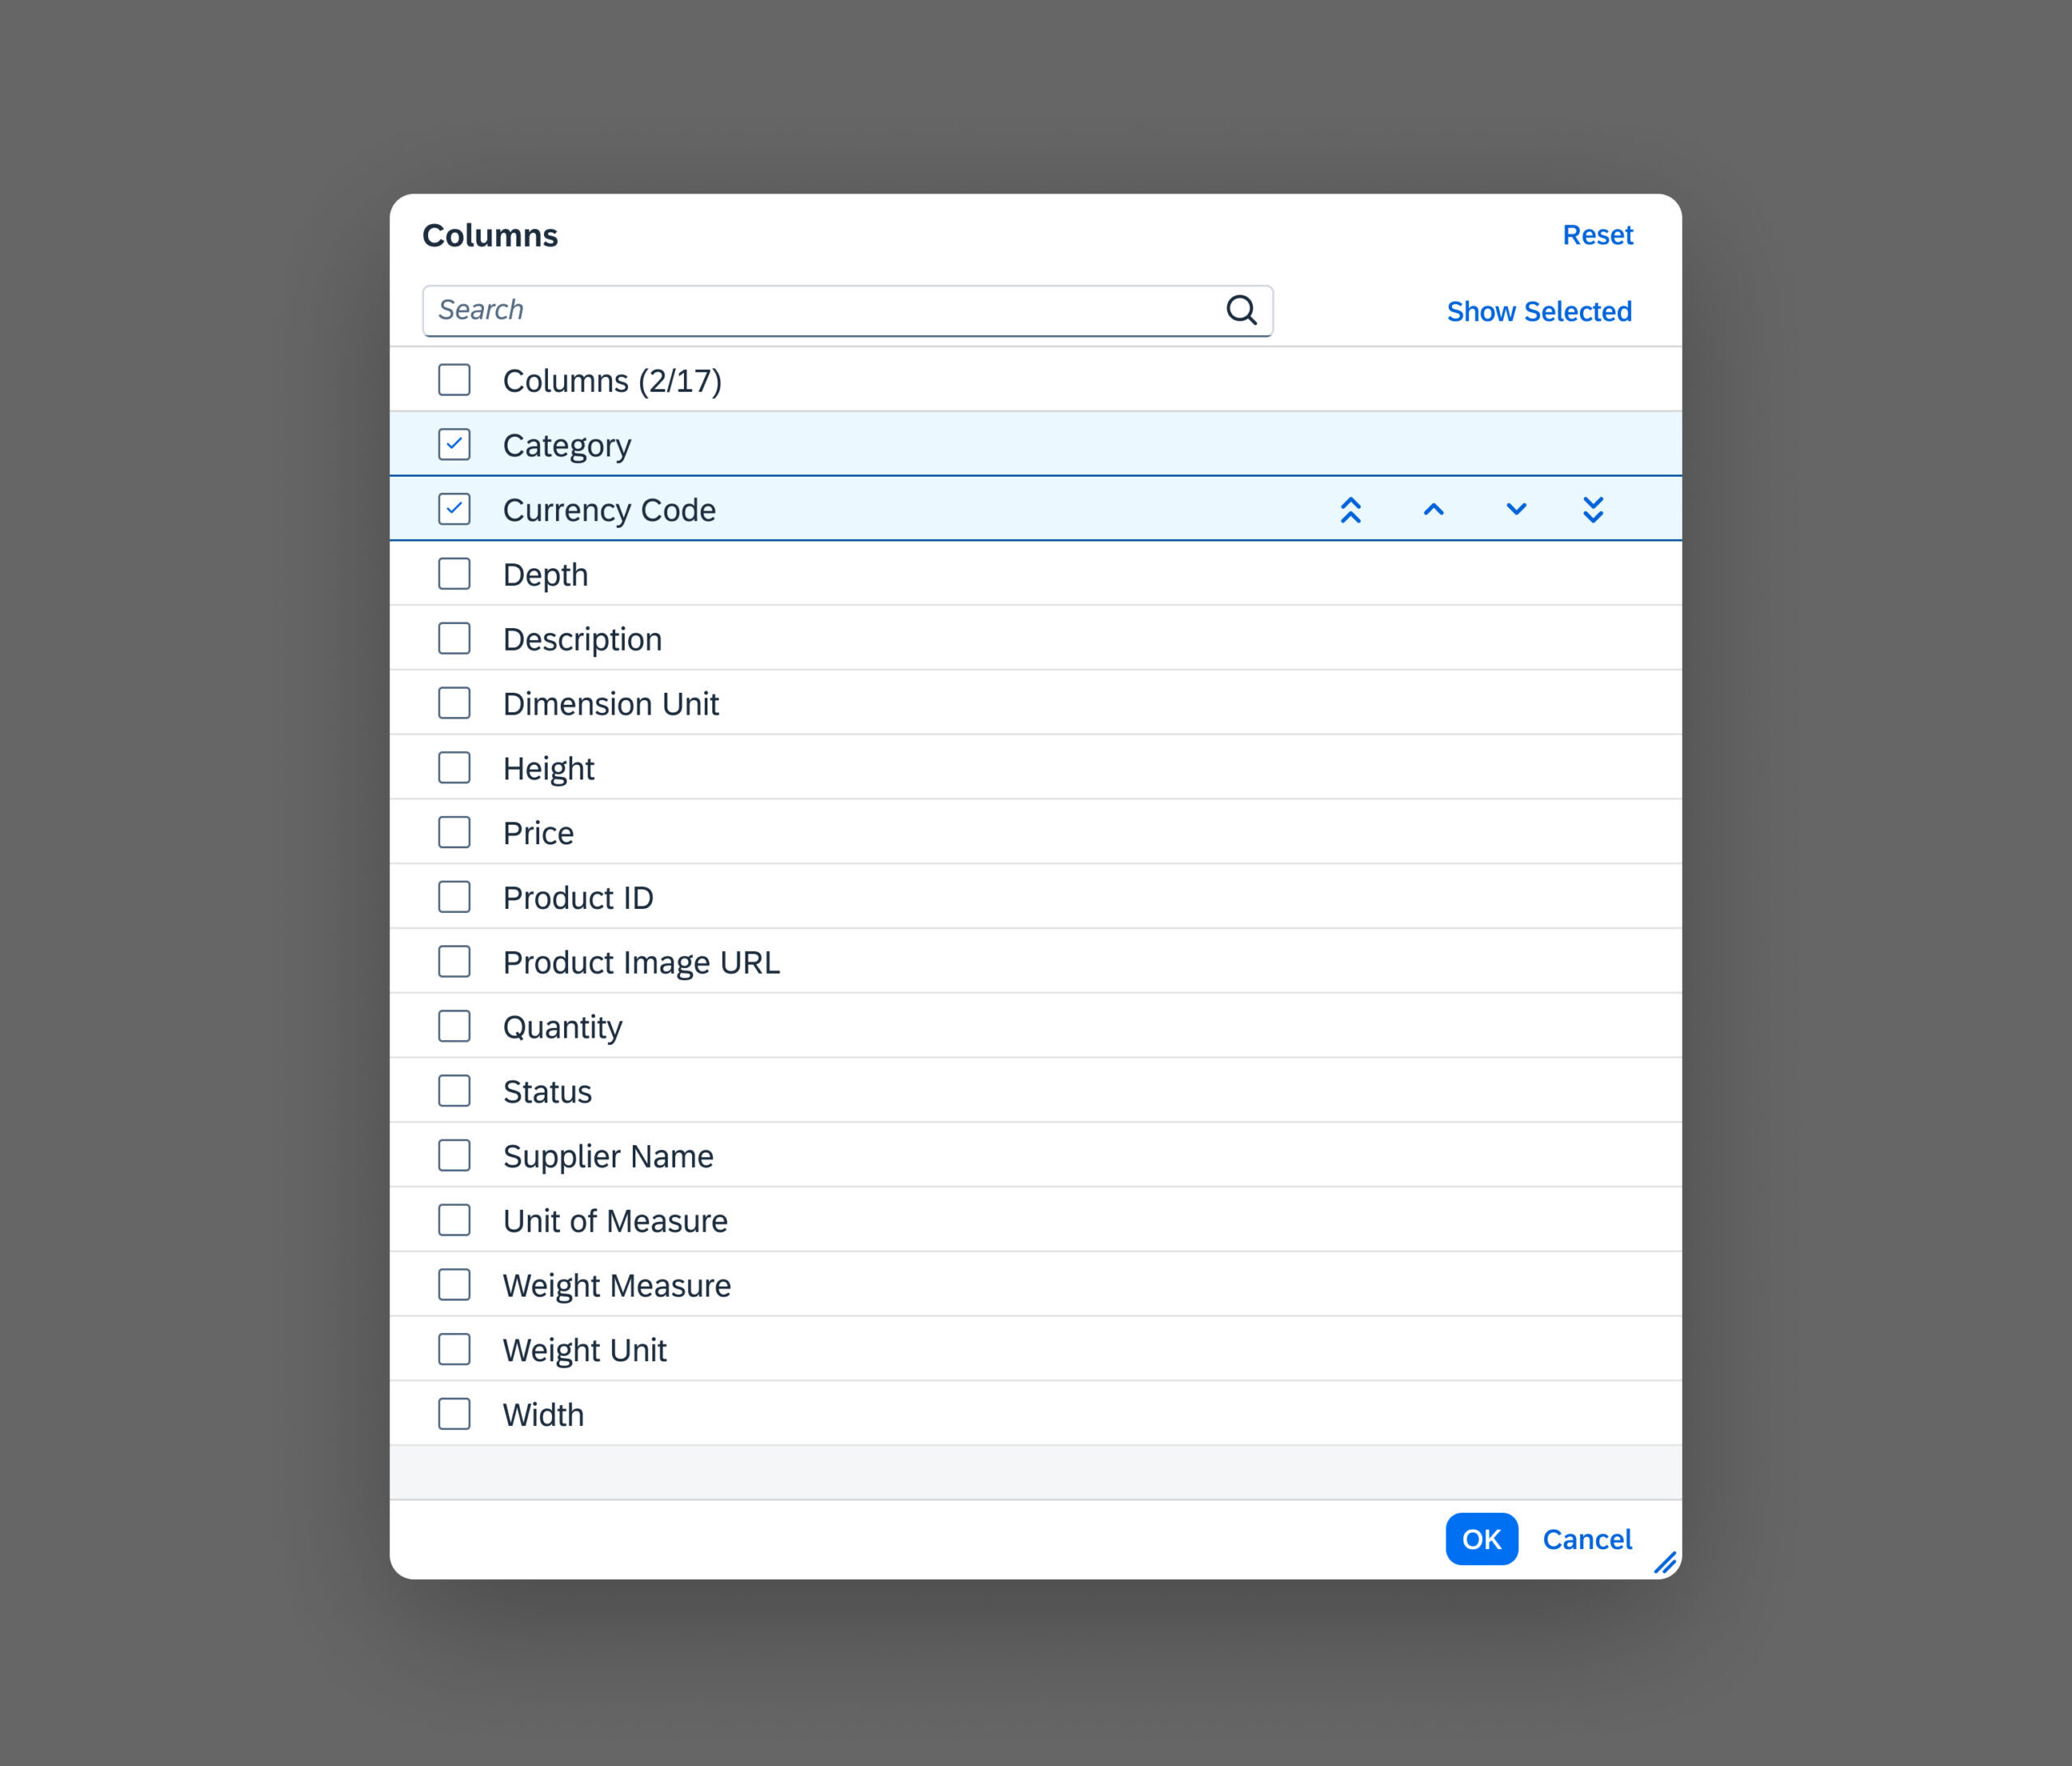
Column settings in the P13n dialog
The Group tab allows users to group the table data.
In the select control, they can select a grouping criterion from a list of all available columns.
For analytical tables, users can define more complex grouping scenarios. Once a grouping criterion is entered, a new line appears for entering another one. In addition, the Show Field As Column checkbox allows users to decide whether or not to display the corresponding column.
The grouped table shows the individual values for the selected field as the group headers. Expanding the group shows all the corresponding table items.
If you have defined multiple groups, the grouped table shows the individual values for the first selected field. Expanding the groups shows the subgroups and items in an expandable hierarchy.
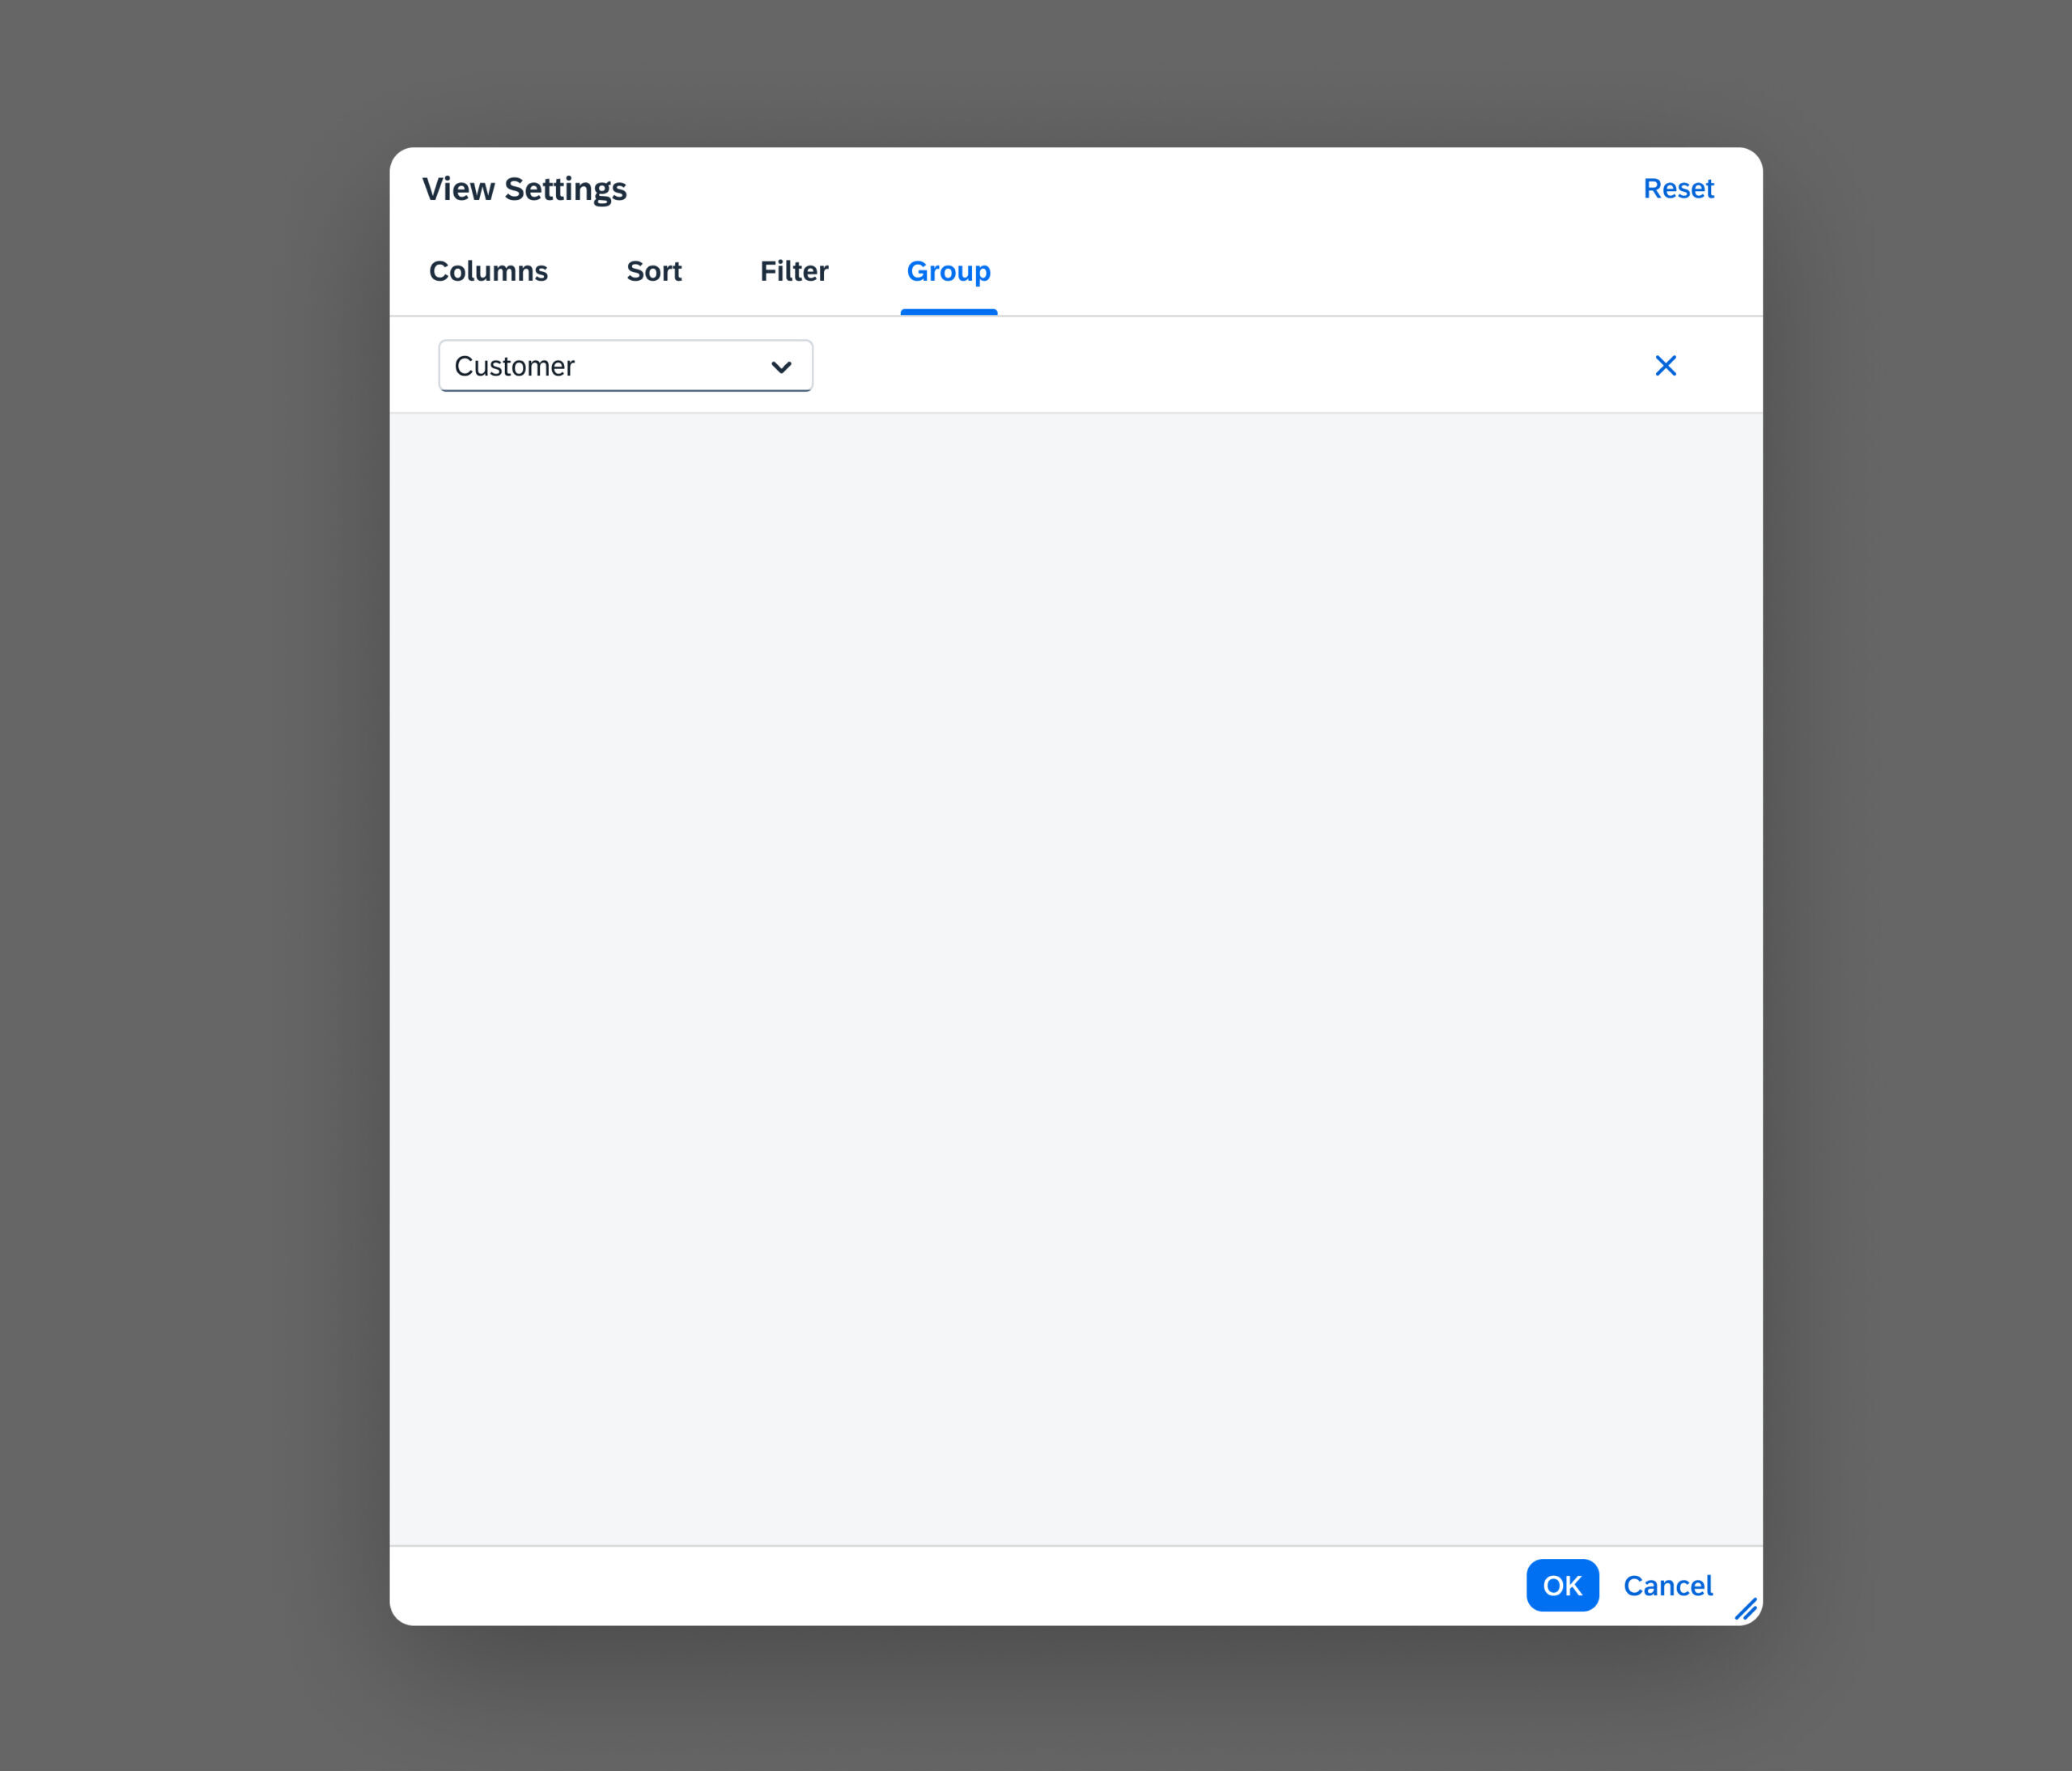
Group tab in the P13n dialog
The Chart tab allows users to set the visibility of chart dimensions and measures and to change the order in which they are displayed.
Users can add dimensions and measures with the select control or remove them by clicking the (Remove dimension/measure) icon at the end of each chart item.
They can enter multiple dimensions and measures. Once a dimension or measure is entered, a new line appears for entering another one.
The order of the entered dimensions and measures reflects the order in which they are applied to the chart.
Dimensions
Each entry has two select controls: one for choosing the dimension, and one for choosing the layout option. The dialog is adapted to the currently selected chart type and shows layout options that work on the selected chart type.
Measures
In the select control, the user can select a needed measure from a list of all available measures.
Reorder
To change the order of the dimensions and measures, users focus on the list item and use the buttons on the right-hand side of the table toolbar to move it up or down or by dragging the dimension/measure to the desired location.
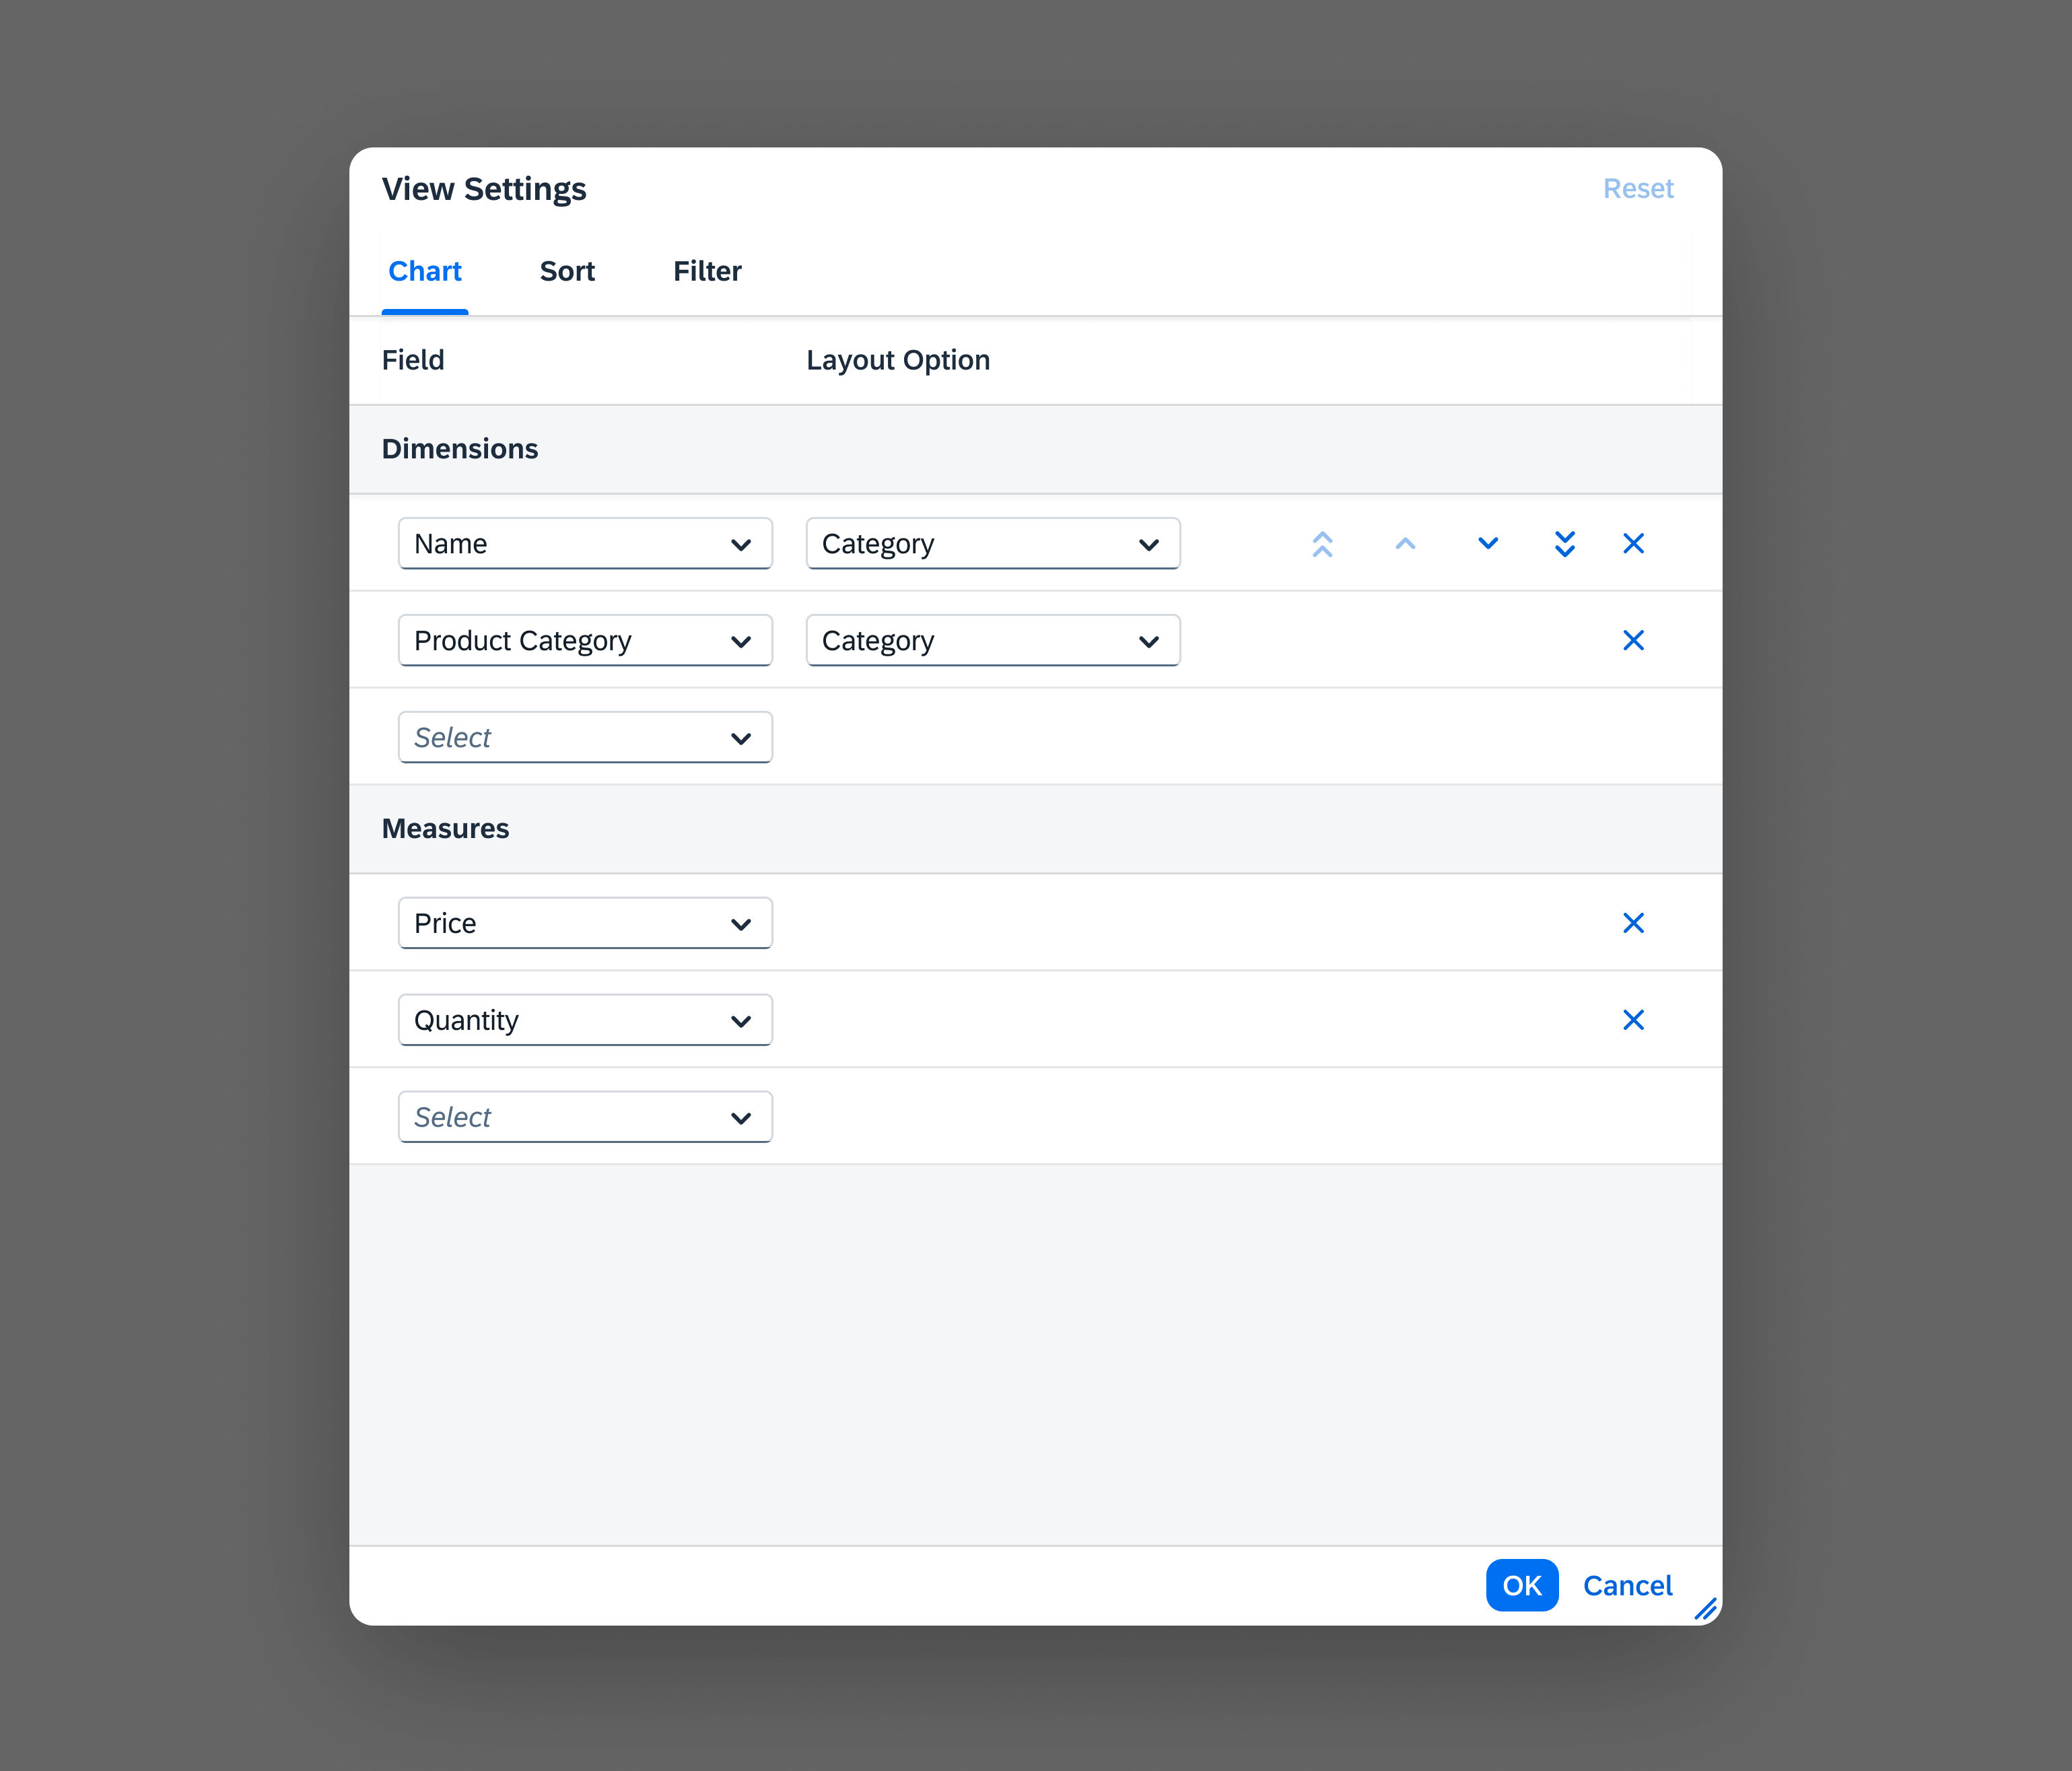
Chart settings in the P13n dialog
Resources
Elements and Controls
- Table Personalization Overview (guidelines)
- View Settings Dialog (guidelines)
- Table Personalization Dialog (guidelines)
 Your feedback has been sent to the SAP Fiori design team.