
- Latest SAPUI Version 1.124
- SAPUI5 Version 1.122
- SAPUI5 Version 1.120
- SAPUI5 Version 1.118
- SAPUI5 Version 1.116
- SAPUI5 Version 1.114
- SAPUI5 Version 1.112
- SAPUI5 Version 1.110
- SAPUI5 Version 1.108
- SAPUI5 Version 1.106
- SAPUI5 Version 1.104
- SAPUI5 Version 1.102
- SAPUI5 Version 1.100
- SAPUI5 Version 1.98
- SAPUI5 Version 1.96
- SAPUI5 Version 1.94
- SAPUI5 Version 1.92
- SAPUI5 Version 1.90
- SAPUI5 Version 1.88
- SAPUI5 Version 1.86
- SAPUI5 Version 1.82
- SAPUI5 Version 1.80
- SAPUI5 Version 1.78
- SAPUI5 Version 1.76
- SAPUI5 Version 1.74
- SAPUI5 Version 1.72
- SAPUI5 Version 1.70
- SAPUI5 Version 1.68
- SAPUI5 Version 1.66
- SAPUI5 Version 1.64
- SAPUI5 Version 1.62
- SAPUI5 Version 1.60
- SAPUI5 Version 1.58
- SAPUI5 Version 1.56
- SAPUI5 Version 1.54
- SAPUI5 Version 1.52
- SAPUI5 Version 1.50
- SAPUI5 Version 1.48
- SAPUI5 Version 1.46
- SAPUI5 Version 1.44
- SAPUI5 Version 1.42
- SAPUI5 Version 1.40
- SAPUI5 Version 1.38
- SAPUI5 Version 1.36
- SAPUI5 Version 1.34
- SAPUI5 Version 1.32
- SAPUI5 Version 1.30
- SAPUI5 Version 1.28
- SAPUI5 Version 1.26
- Latest SAPUI Version 1.124
- SAPUI5 Version 1.122
- SAPUI5 Version 1.120
- SAPUI5 Version 1.118
- SAPUI5 Version 1.116
- SAPUI5 Version 1.114
- SAPUI5 Version 1.112
- SAPUI5 Version 1.110
- SAPUI5 Version 1.108
- SAPUI5 Version 1.106
- SAPUI5 Version 1.104
- SAPUI5 Version 1.102
- SAPUI5 Version 1.100
- SAPUI5 Version 1.98
- SAPUI5 Version 1.96
- SAPUI5 Version 1.94
- SAPUI5 Version 1.92
- SAPUI5 Version 1.90
- SAPUI5 Version 1.88
- SAPUI5 Version 1.86
- SAPUI5 Version 1.84
- SAPUI5 Version 1.82
- SAPUI5 Version 1.80
- SAPUI5 Version 1.78
- SAPUI5 Version 1.76
- SAPUI5 Version 1.74
- SAPUI5 Version 1.72
- SAPUI5 Version 1.70
- SAPUI5 Version 1.68
- SAPUI5 Version 1.66
- SAPUI5 Version 1.64
- SAPUI5 Version 1.62
- SAPUI5 Version 1.60
- SAPUI5 Version 1.58
- SAPUI5 Version 1.56
- SAPUI5 Version 1.54
- SAPUI5 Version 1.52
- SAPUI5 Version 1.50
- SAPUI5 Version 1.48
- SAPUI5 Version 1.46
- SAPUI5 Version 1.44
- SAPUI5 Version 1.42
- SAPUI5 Version 1.40
- SAPUI5 Version 1.38
- SAPUI5 Version 1.36
- SAPUI5 Version 1.34
- SAPUI5 Version 1.32
- SAPUI5 Version 1.30
- SAPUI5 Version 1.28
- SAPUI5 Version 1.26
Ranking
Intro
Ranking simplifies complex decisions for business users by showing the best options first.
Items in a group are ranked by comparing criteria that are relevant for the user’s business context, such as an amount, the priority, or score. In a ranked table or list, the results are always sorted to show the most highly ranked items on top.
Types of Ranking
We differentiate between ranking that uses an available (inherent) value, and ranking based on a calculated score.
Ranking by inherent value
Ranking is based on a value that is already available in the existing dataset, such as the price.
The value is typically known and understood by the user and requires no further explanation.
Ranking by score
Ranking is based on a calculated grade, mark or score.
In this case, users might need to understand the calculation behind the score (see Ranking Details).
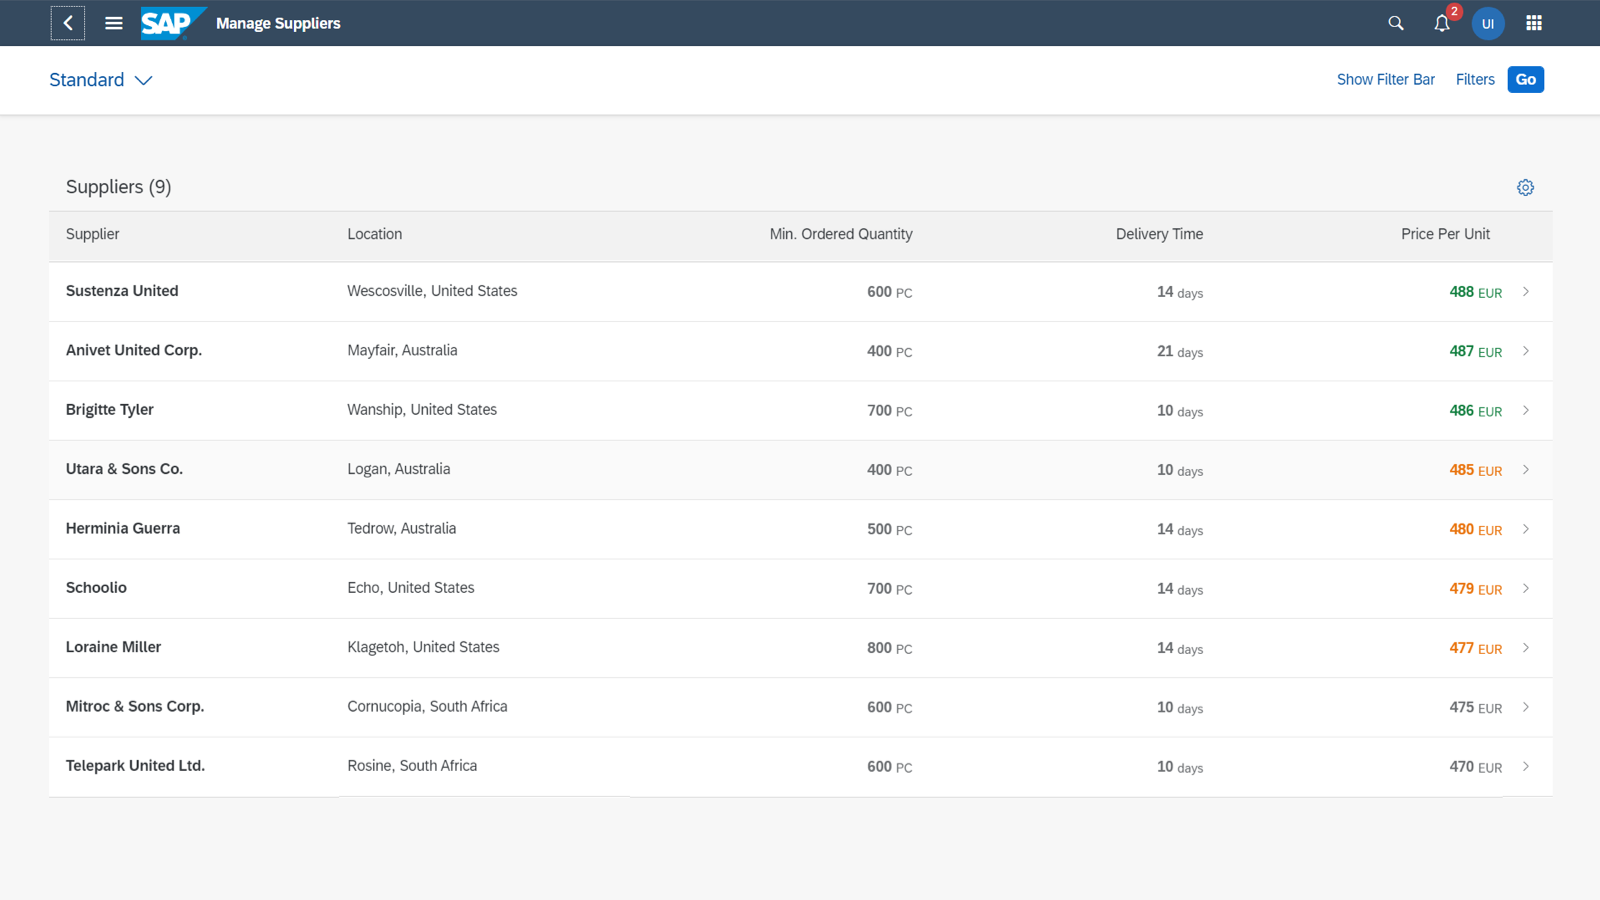
Supplier dataset ranked by price (inherent value)
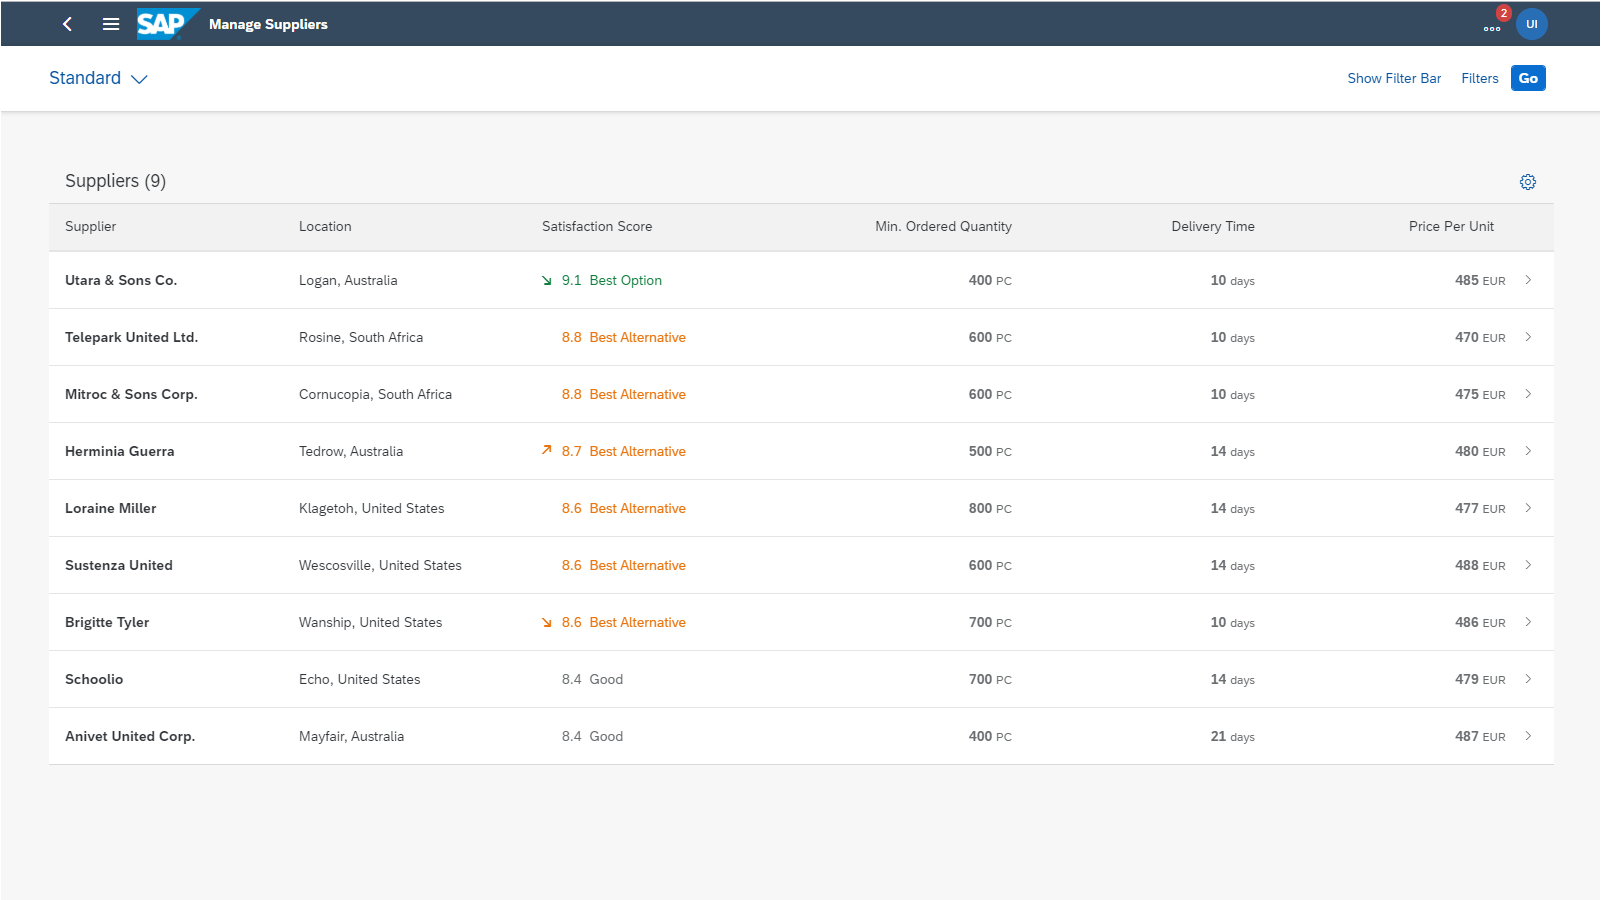
Supplier dataset ranked by satisfaction score (calculated value)
Ranking and AI
Ranking can incorporate intelligent algorithms, but they aren’t a must. Items can also be ranked using simple rules, thresholds, or heuristics.
Ranking vs. Rating
Although you can rank a list of items based on their rating, ranking and rating are two different concepts:
- Rating places a single item on a predetermined scale. For example:
Rate your lunch on a scale from 1 (very bad) to 10 (very good).
Rate your service provider on a scale from 0 stars to 5 stars. - Ranking is always about comparing a common value across a group of items. On the UI, ranking is usually shown for a list or group.
This article focuses only on ranking.
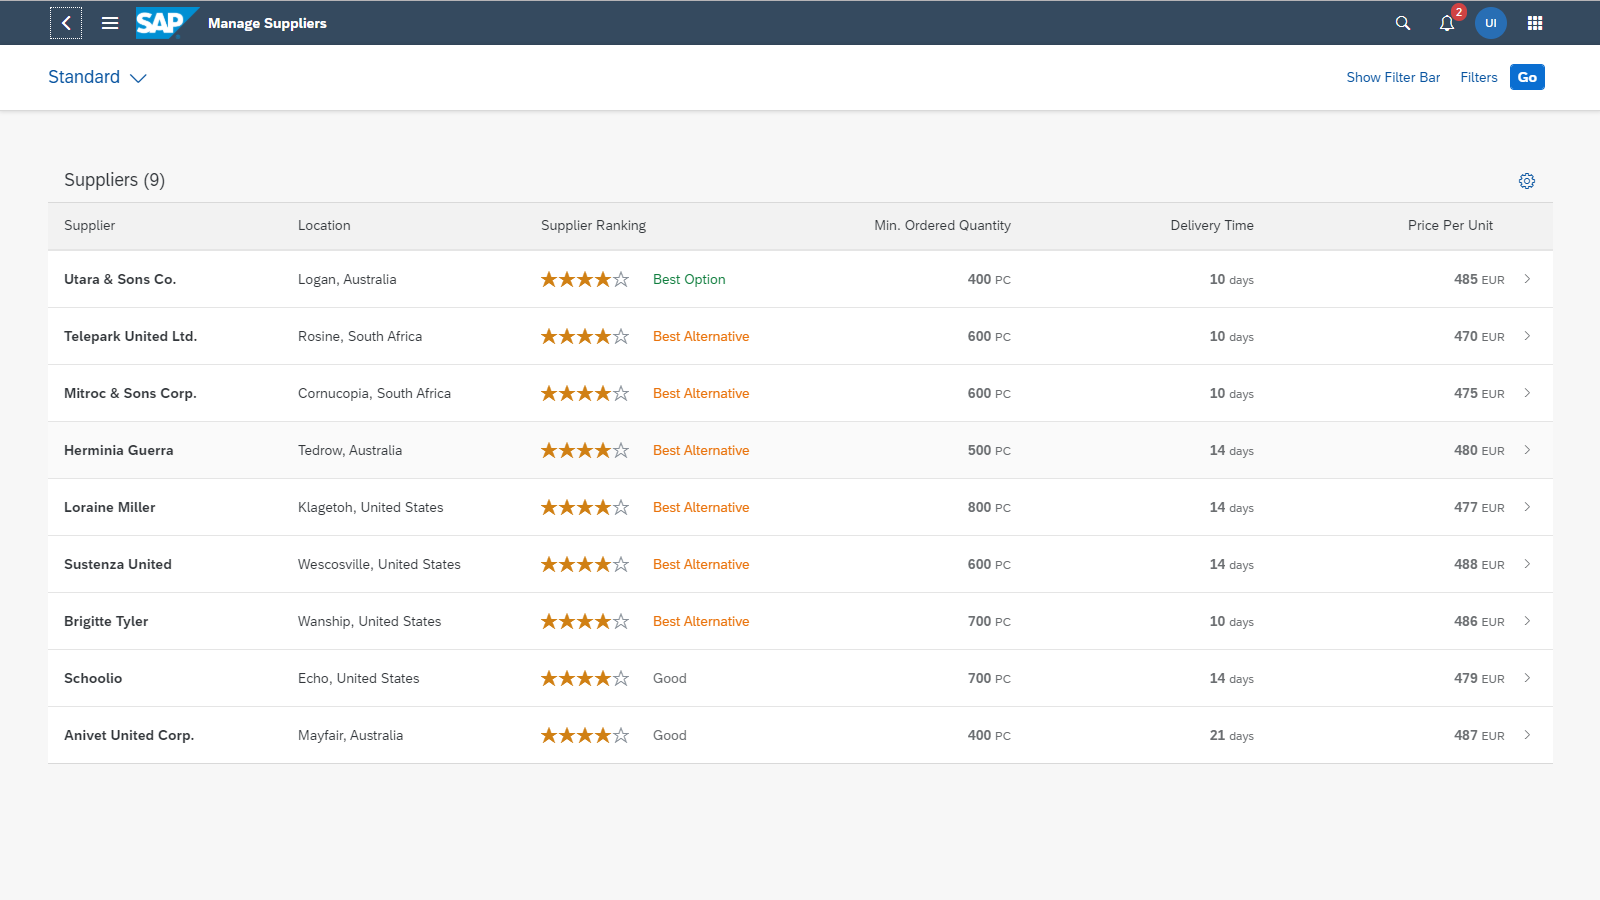
Supplier dataset ranked by a rating score
Ranking Indicator
Elements of the ranking indicator
The concept for ranking in lists and tables comprises three basic elements grouped in a common reusable component: Ranking value, ranking description (optional), and change indicator (optional).
To provide transparency and support the user decision-making process, provide additional ranking details whenever possible.
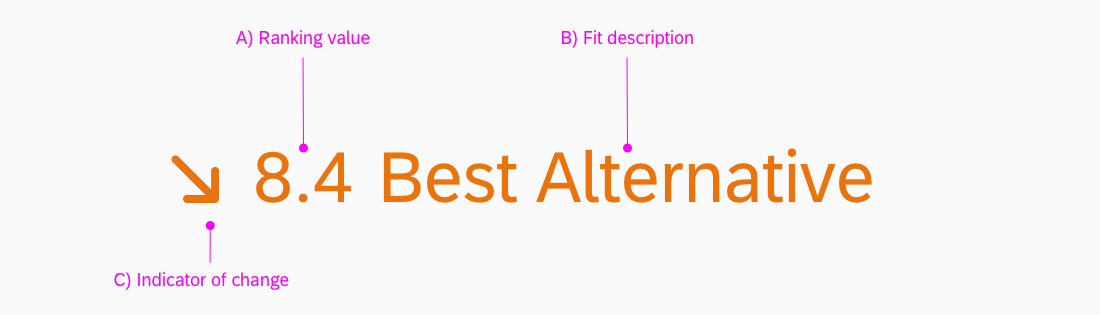
Ranking Indicator Elements
A) Ranking value
This is the common value on which the ranking is based.
The value is mostly numeric and defines the rank of an object. It can be an implicit value, like price or delivery time, or a score. Depending on the use case, you can also show the score as a percentage, or without a unit of measure. Another option is to use a micro chart (such as a radial micro chart).
Ranking based on a non-numeric value is not common, but possible. An example would be academic grading systems using letters ( A+, A, A−; B+, B, B−; C+, C, C−; D+, D, D−).
Clicking the ranking value opens a dialog with ranking details for the corresponding item.
If a list for some reason contains items that do not have a ranking value, show them at the bottom of the list. An example might be a new supplier that doesn’t yet have enough data to be ranked by the system.
B) Ranking description
The ranking description provides additional context for the ranking value.
Terms like “Best” or “Alternative” can offer more specific guidance without being too complicated. It is important to understand that ranking descriptions are highly contextual. The wording and how they map to the ranking score depend on the content, use case, and process.
C) Change indicator
The change indicator makes it easier to track the ranking value for fast-changing data sets, such as live streams for IoT scenarios.
The ranking value is the minimum element needed to show a ranking for a list or table. The ranking description and change indicator support the basic value of the ranking and may not be required in all cases.
In addition to the three basic elements of the ranking component, there are two other aspects to consider: semantic colors and presentation variants.
Semantic Colors
You can use semantic colors to underline the ranking message. The semantic color of the ranking indicator follows the KPI concept in analytics (for example, in the analytical card).
Satisfaction score column contains ranking indicators with semantic colors
Presentation Variants
The ranking concept supports different representations of the same data point. The appropriate representation will depend on the role and use case, as well as the relative importance of ranking in your app.

Different ranking representations
A) Ranking as a regular data point
If the ranking is part of the dataset, but is not relevant for the role or task, do not use a semantic color, and display the ranking as for all other values in the table.
B) Ranking as the primary criterion
When the ranking is at the core of the use case and highly relevant for users, the ranking component can use both a measure and a ranking description. Semantic colors indicate at a glance how the different objects are ranked.
C), D) Ranking with high user confidence
When users trust the system ranking, you can display a common ranking value on its own without additional context (variant C), or just show a ranking description without a value (variant D). Bear in mind that even if user confidence in the system is high, other factors like the stake or risk can still warrant using the full representation.
If you decide to show only the ranking description, always allow the user to access the underlying score in a popover with the ranking details.
E) Ranking for fast-changing data streams
If the data is subject to constant change, you can use a trend indicator to help users track changes in the ranking position.
Ranking Details
To gain additional insights into the ranking for a specific object, the user can view the ranking details. The detail dialog is triggered by clicking the ranking indicator. In the ranking details, explain the position of the object in the overall ranking and the individual ranking components. Also include a comparison between the current object and the average score for all other objects. Comparing individual values with an overall score helps users to assess their importance.
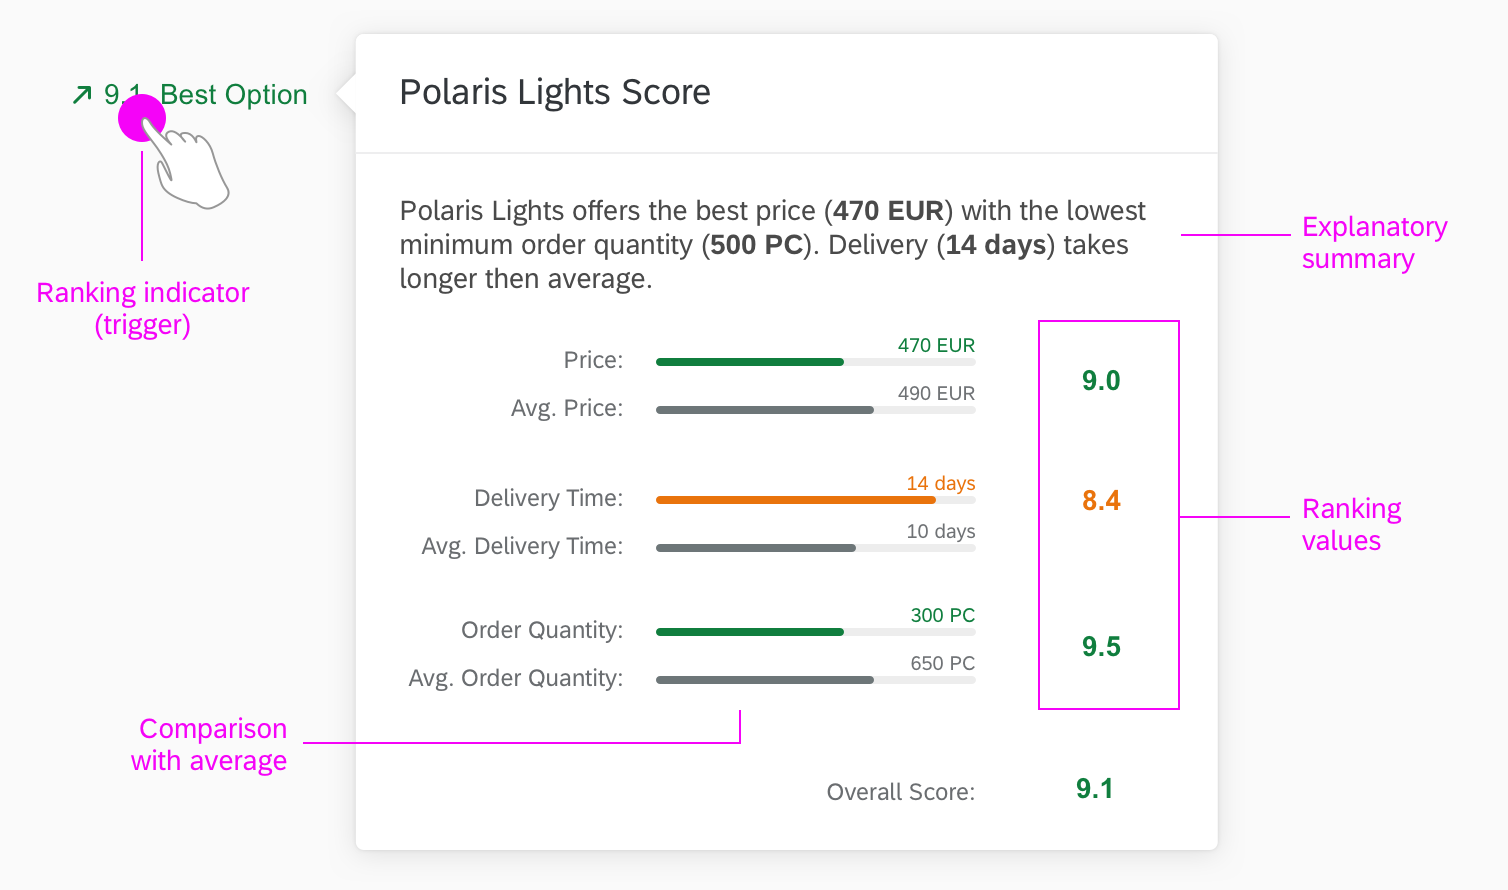
Ranking details with explanation and ranking components
Top Tips
- When items are ranked, sort the table by default from the highest-ranked to the lowest ranked. However, ensure that users still have the option to sort in the other direction or sort by another column value.
- Help users understand the order of ranked items by providing ranking details with explanations.
- When possible, give users the opportunity to personalize the ranking by setting their own ranking preferences.
- If the user has full confidence in the system’s ability to identify the best match, there may be no need to show an implicit score. However, always make the score available using progressive disclosure and explanations.
- User confidence is highly contextual and might differ even for the same scenario, task or role. Consider this if you decide to use only a ranking value or a ranking description.
- Use semantic colors for the ranking only if ranking is the main use case for the role or task. Never use semantic colors for decoration only.
- If other values in the table already use semantic colors, consider not using semantic colors for rankings.
- If you use semantic colors for both the status and ranking, try to position the ranking to the left of the table, next to the item description. This keeps it separate from the status column, which is usually on the right side of the table.
- Use the change indicator only for fast-changing datasets. Don’t use it for decoration or for “static” lists that rarely change.
 Your feedback has been sent to the SAP Fiori design team.