
- Latest SAPUI Version 1.124
- SAPUI5 Version 1.122
- SAPUI5 Version 1.120
- SAPUI5 Version 1.118
- SAPUI5 Version 1.116
- SAPUI5 Version 1.114
- SAPUI5 Version 1.112
- SAPUI5 Version 1.110
- SAPUI5 Version 1.108
- SAPUI5 Version 1.106
- SAPUI5 Version 1.104
- SAPUI5 Version 1.102
- SAPUI5 Version 1.100
- SAPUI5 Version 1.98
- SAPUI5 Version 1.96
- SAPUI5 Version 1.92
- SAPUI5 Version 1.90
- SAPUI5 Version 1.88
- SAPUI5 Version 1.86
- SAPUI5 Version 1.84
- SAPUI5 Version 1.82
- SAPUI5 Version 1.80
- SAPUI5 Version 1.78
- SAPUI5 Version 1.76
- SAPUI5 Version 1.74
- SAPUI5 Version 1.72
- SAPUI5 Version 1.70
- SAPUI5 Version 1.68
- SAPUI5 Version 1.66
- SAPUI5 Version 1.64
- SAPUI5 Version 1.62
- SAPUI5 Version 1.60
- SAPUI5 Version 1.58
- SAPUI5 Version 1.56
- SAPUI5 Version 1.54
- SAPUI5 Version 1.52
- SAPUI5 Version 1.50
- SAPUI5 Version 1.48
- SAPUI5 Version 1.46
- SAPUI5 Version 1.44
- SAPUI5 Version 1.42
- SAPUI5 Version 1.40
- SAPUI5 Version 1.38
- SAPUI5 Version 1.36
- SAPUI5 Version 1.34
- SAPUI5 Version 1.32
- SAPUI5 Version 1.30
- SAPUI5 Version 1.28
- SAPUI5 Version 1.26
- Latest SAPUI Version 1.124
- SAPUI5 Version 1.122
- SAPUI5 Version 1.120
- SAPUI5 Version 1.118
- SAPUI5 Version 1.116
- SAPUI5 Version 1.114
- SAPUI5 Version 1.112
- SAPUI5 Version 1.110
- SAPUI5 Version 1.108
- SAPUI5 Version 1.106
- SAPUI5 Version 1.104
- SAPUI5 Version 1.102
- SAPUI5 Version 1.100
- SAPUI5 Version 1.98
- SAPUI5 Version 1.96
- SAPUI5 Version 1.94
- SAPUI5 Version 1.92
- SAPUI5 Version 1.90
- SAPUI5 Version 1.88
- SAPUI5 Version 1.86
- SAPUI5 Version 1.84
- SAPUI5 Version 1.82
- SAPUI5 Version 1.80
- SAPUI5 Version 1.78
- SAPUI5 Version 1.76
- SAPUI5 Version 1.74
- SAPUI5 Version 1.72
- SAPUI5 Version 1.70
- SAPUI5 Version 1.68
- SAPUI5 Version 1.66
- SAPUI5 Version 1.64
- SAPUI5 Version 1.62
- SAPUI5 Version 1.60
- SAPUI5 Version 1.58
- SAPUI5 Version 1.56
- SAPUI5 Version 1.54
- SAPUI5 Version 1.52
- SAPUI5 Version 1.50
- SAPUI5 Version 1.48
- SAPUI5 Version 1.46
- SAPUI5 Version 1.44
- SAPUI5 Version 1.42
- SAPUI5 Version 1.40
- SAPUI5 Version 1.38
- SAPUI5 Version 1.36
- SAPUI5 Version 1.34
- SAPUI5 Version 1.32
- SAPUI5 Version 1.30
- SAPUI5 Version 1.28
- SAPUI5 Version 1.26
Explainable AI
Intro
To help build trust between human and machine, we need to provide sufficient information about the underlying model and the reasoning behind the results of an algorithm. This is even more critical in business applications, where users are held accountable for the decisions they make.
“Explainable AI” means explaining the reasoning behind intelligent system proposals in context and at the right time.
Usage
Consider using AI explanations if one or more of the following conditions apply:
- Criticality – There is a high risk associated with making the wrong decision. Once taken, actions are hard to reverse.
By contrast, if the risk is low and actions can easily be rolled back, users might not need an explanation for the system proposal.
- Complexity – It’s hard for users to assess the impact and quality of their decisions. This might be due to a lack of process insight because of the automation of this task with machine learning.
By contrast, if users can easily tell when a proposal fits (without training), they probably don’t need additional input.
- Transparency – Your business case is subject to extensive auditing requirements. Auditors must be able to trace transactions back and see the underlying reasoning for each execution step. Auditors may require more information than end users.
By contrast, if there are no auditing requirements, explanations might not be necessary (assuming they are also not required by end users).
- Volatility – To adapt your machine learning model to changing conditions or requirements, your AI application relies on continuous feedback.
By contrast, if the feedback has little or no effect on the output of the algorithm or the user experience, it can be more distracting than helpful to provide an additional explanation.
What Needs to be Explained?
When AI (machine learning) is introduced into business applications, systems originally designed to “react” can become active players that propose, change or create elements in the interface. Objects, actions, or attributes are manipulated not only by humans, but also by the AI algorithms.
To avoid confusion and loss of control, users need to be aware of the working principles, actions, and consequences of AI at any point in time. When designing AI services, we therefore recommend following our guiding principles for intelligent systems.
How Much Detail Do Users Need?
The amount of information users need to understand a system proposal can vary. This depends on the applied AI, usage context, user task, and user role. We differentiate between three explanation levels: minimum, simple, and expert.
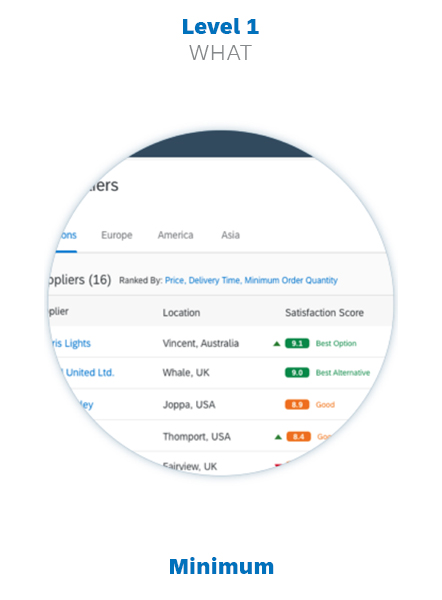
Explanation level 1
Level 1: Indicator (What?)
The minimum explanation level. An indicator is required whenever AI (machine learning) output is provided. The indicator is also the access point for the next explanation level (if required).
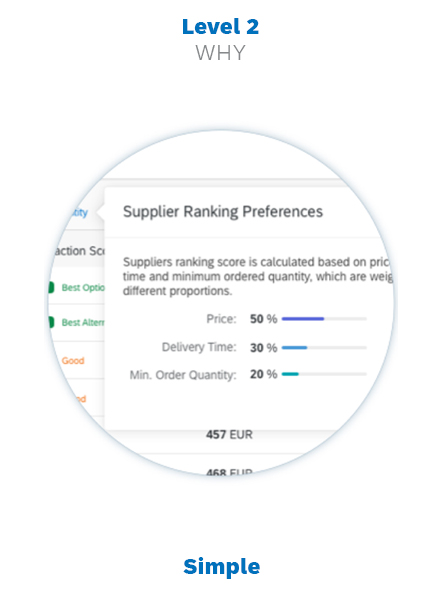
Explanation level 2
Level 2: Abstract (Why?)
A condensed view of the relevant properties, amounts, and contextual information. An abstract helps users to better understand the AI proposals. It can contain links to the last and most detailed explanation level.
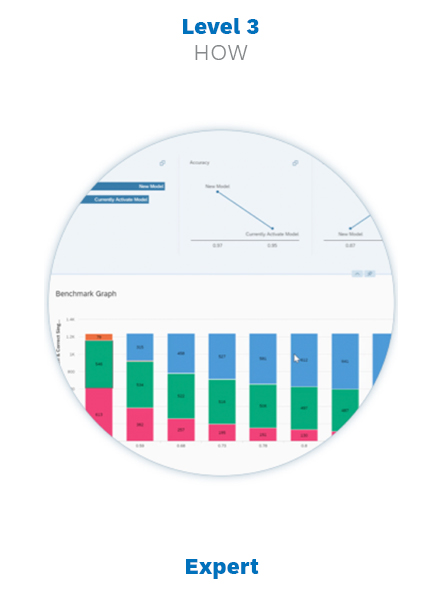
Explanation level 3
Level 3: Detail (How?)
An extended report specifically for advanced users. It covers all aspects processed by the intelligent system, the AI performance, and any further context and conditions that help users to monitor AI operations.
Progressive Disclosure
Progressive disclosure avoids overwhelming users with too much information at once. Initially, the user sees only an explanation indicator, and can then drill into two further layers of detail. The benefit of this approach is that the explanations don’t clutter the existing UI. Users only need to concern themselves with details if they actually need them.
Overview of Progressive Disclosure Levels
| Level | Type of Information |
| Level 0 | No additional explanation elements. For cases where users do not expect or require an explanation from the system. |
| Level 1 | Briefly explains the context, with or without the option to get more detailed information. In simple cases where a short explanation clarifies the issue, a level 1 explanation may be enough. |
| Level 2 | Presents condensed information, including tables, charts, or any other UI elements that offer more insight into the issue. Users access this level by clicking the explanation provided as a link in Level 1. |
| Level 3 | Presents detailed information, including tables, charts, or any other UI elements that offer more insight into the issue. Users access this level by clicking the explanation provided as a link in Level 2. |
| Via Conversational UI | Not really part of the explanation concept, but gives users the option to engage SAP CoPilot (Ask CoPilot button or input field). |
Level 1
Explanation indicator
Global / local indicator in lists and tables
Global / local indicator for cards
Level 2
Simple explanation
Explanation popover, conversation items
Overlay
Level 3
Extended explanation
Explanation page
Dedicated explanation application
Explanation Components
The UX pattern for explanations builds on the explanation levels above (What?/ Why?/ How?). We use dedicated UI components for each of these levels.
Level 1: Explanation Indicator
The explanation indicator marks elements or combinations of elements that are created or manipulated with the help of AI. The indicator provides context about the “nature” and “quality” of a service provided. Clicking the indicator reveals a more detailed explanation (Level 2).
The following sections describe the different explanation indicator variants and when to use them.
Explanation Type
Explanation indicators can be global or local. This affects both the type of information they contain and their placement on the UI.
Global – Model level
Explains the AI output for a group of elements, such as a list, table, or whole section. The global explanation provides the overall context for more complex constellations affecting multiple objects or aspects.
Local – Item level
Explains the AI output for a single value or item.
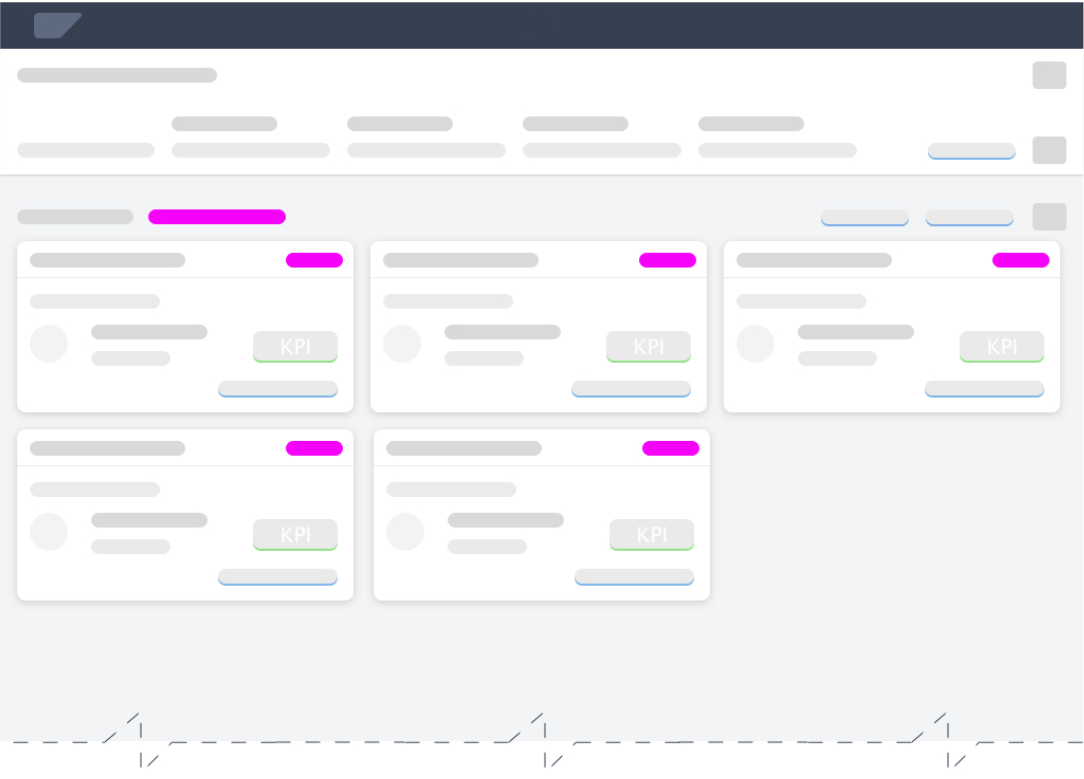
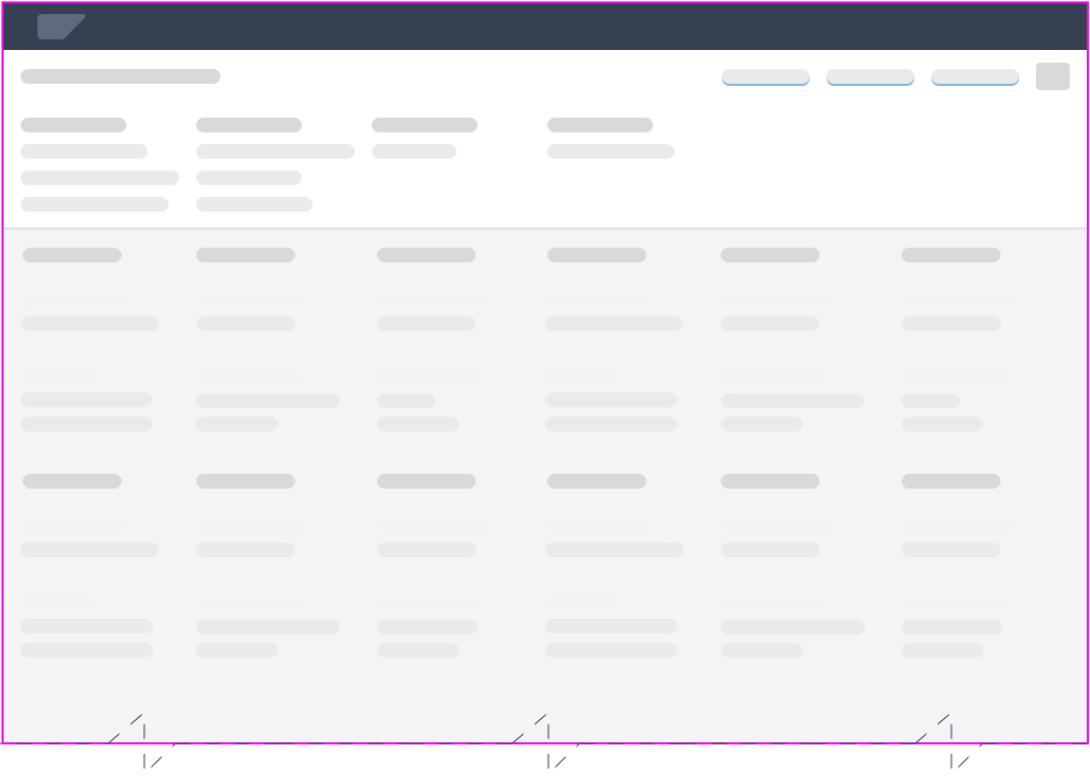
Global Indicator
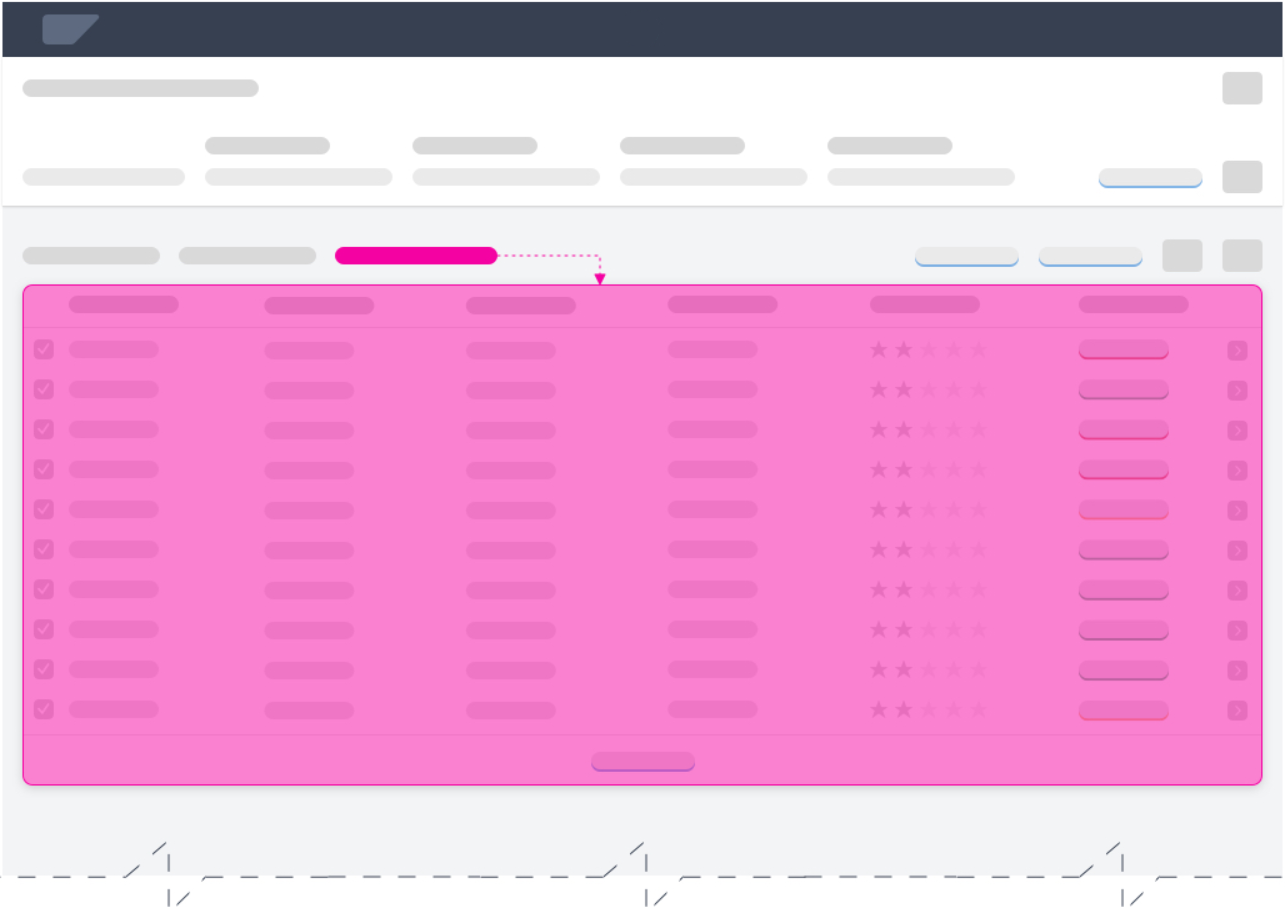
Example: Global indicator for a table or list
Local Indicator
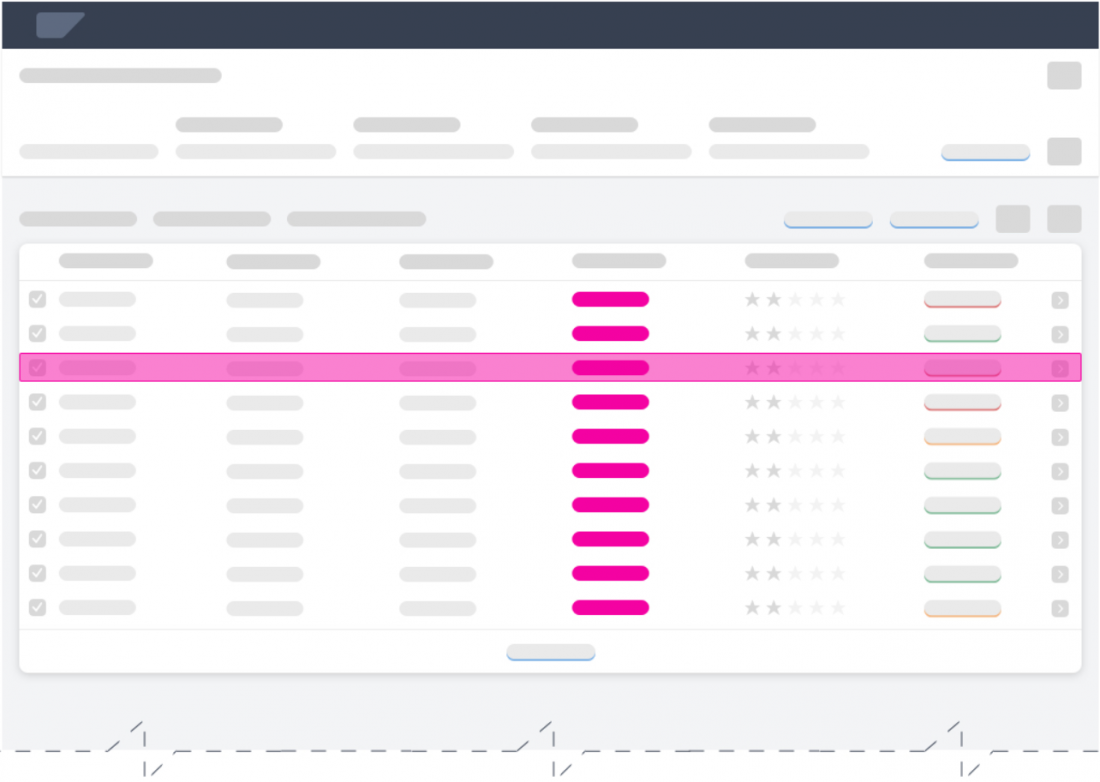
Example: Local indicator in a table or list
It isn’t always necessary to provide explanations at both levels, but can be necessary if AI affects both the individual object and its position in the group.
Indicator Styles
The styling of the indicator influences how the user perceives and interprets the displayed output. We distinguish between a default style and an extended style.
Default Style
The default style provides the minimum amount of indication about the type of AI output. It uses explicit and descriptive labels and blue coloring for clickable explanations.
The default style offers sufficient visual affordance for non-critical AI applications.
Extended Style
The extended style uses semantic colors and to offer more contextual insight at the first explanation level. It can also include other semantic elements, such as an icon to indicate a trend.
The extended style can further improve the affordance for the user and emphasize the importance of the information provided.
Explanation Indicator Patterns / Examples
The table below outlines the recommended controls, placement, and patterns for different local/global explanation scenarios. The Examples column shows both a default explanation indicator and alternative (extended) indicators with semantic components.
| Scenario | Pattern | Examples |
| Global Indicator
Ranking for table items |
Link/Button Text: View <AI Operation> <Value Name> |
Default: View Ranking Criteria Alternative: How does this work? ML Ranking |
| Global Indicator
Ranking for table items |
Label Text: <AI Operation> By: Link (value) Text: <Decision Criterion> <Criterion1, Criterion2, Criterion3> … |
Default: Ranked By: Price-Performance Alternative: Ranked By: Price, Delivery Time, Minimum Order Quantity, … Ranked By: Ranking Criteria |
| Local Indicator
Predicted priority of an item |
Column Title: <AI Operation> <Value Name>: Cell Value: <AI Output Value> |
Default: Column Header: Recommended Priority: Cell: Very High (on a scale from very high to very low) Alternatives: Very High 9.6 Very High 9.6 Very High 9.6 90% |
| Local Indicator
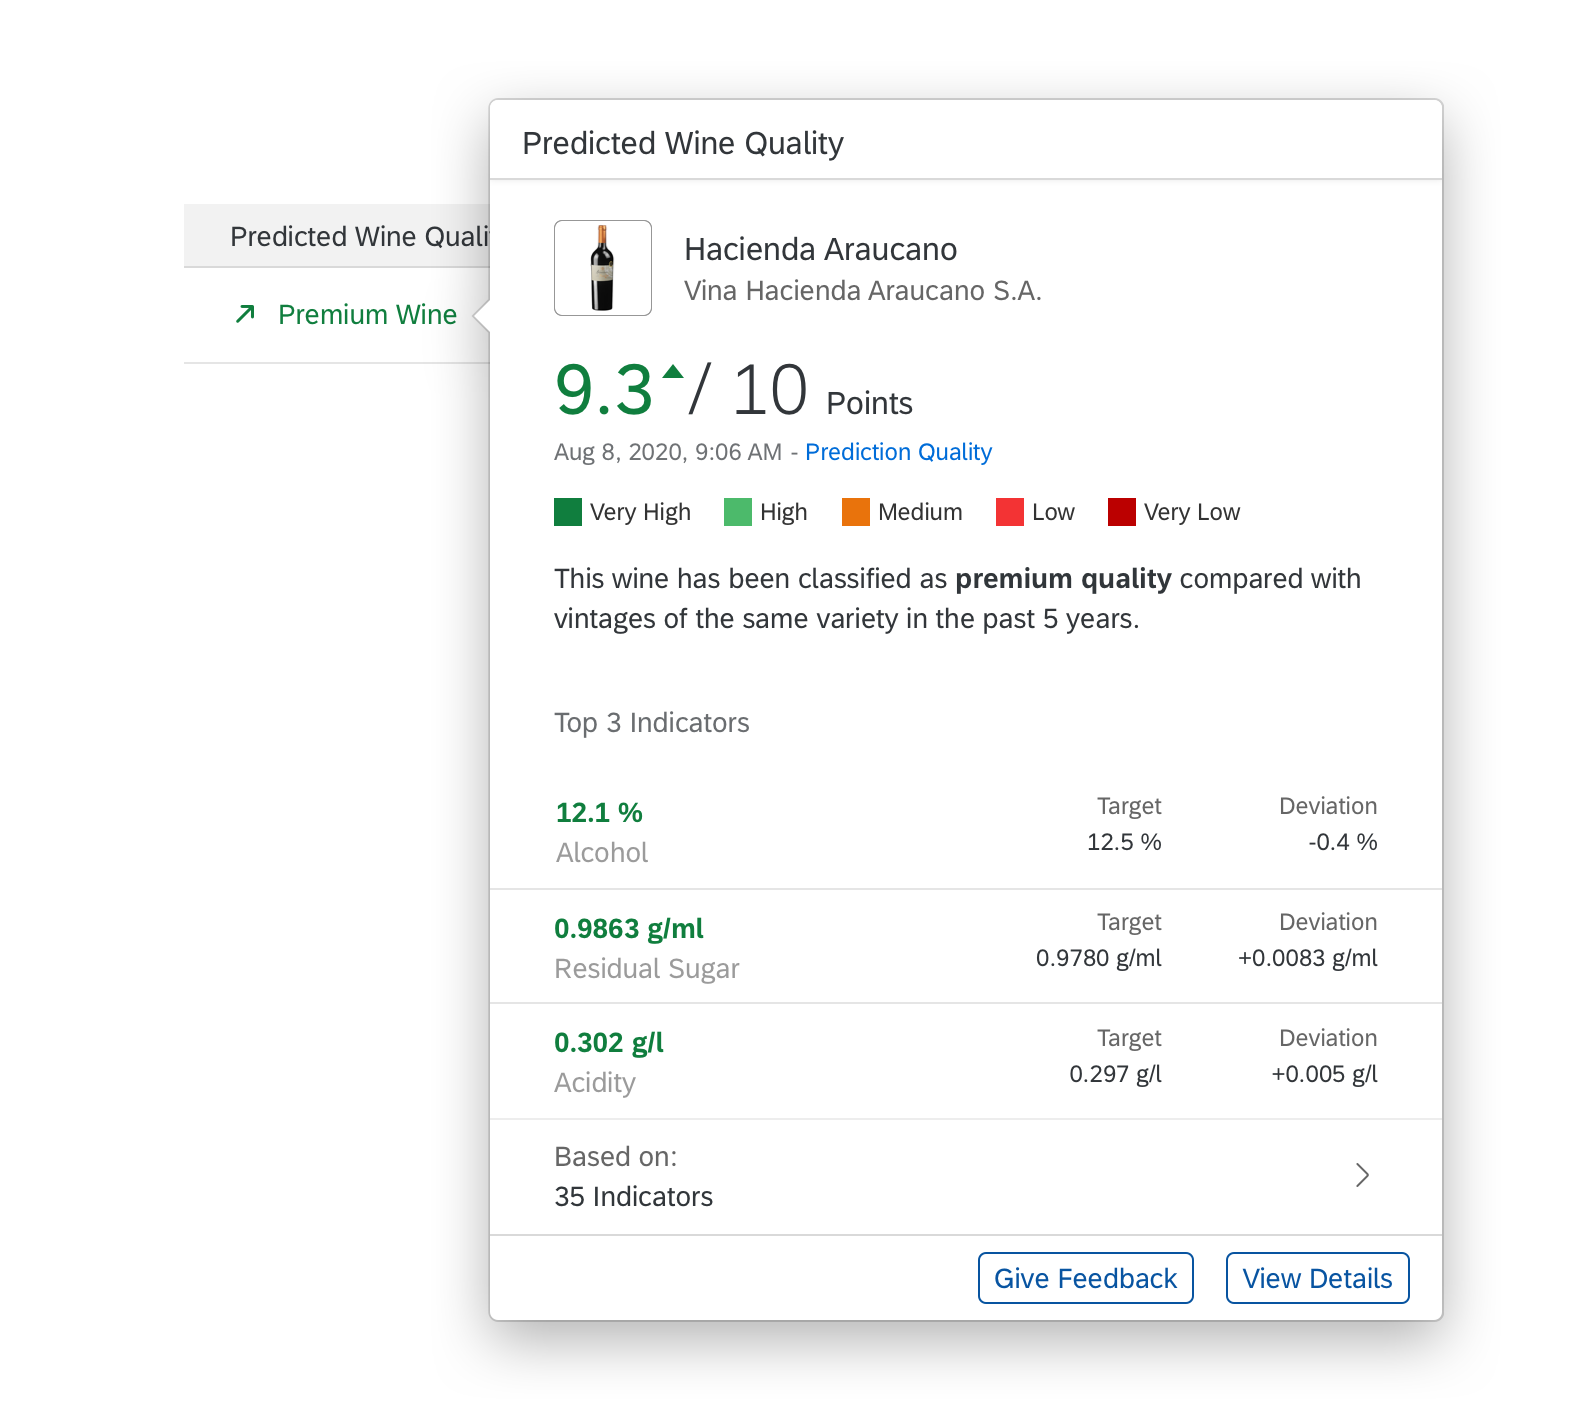
Quality classification for a product (such as wine) |
Column Title: <AI Operation> <Value Name>: Cell Value: <AI Output Value> |
Default: Column Header: Predicted Product Quality: Cell: Premium (scale depends on use case) Alternatives: Premium 9.6 Premium 9.6 Premium 9.6 90% |
| Local Indicator
Price regression or prediction in a table |
Column Title: <AI Operation> <Value Name>: Cell Value: <AI Output Value> |
Default: Column Header: Predicted Achievable Price: Cell: 100.00 EUR (scale depends on use case) Alternatives: 100 EUR 100 EUR (+/- 10%) 100 EUR 100 EUR |
Styling Conditions
The length of the explanation indicator and whether or not you display a link to a simple explanation (level 2) depends on your use case:
| Form Factor | Length | Action | Conditions |
| All form factors (S, M, L, XL, >) |
Short (default) | Display only
Clickable |
Display permission limited to level 1 or level 2 explanation is missing.
Display permission for levels 1 and 2 and level 2 explanation is available. |
| Large (L, XL, >) |
Long (optional) | Display only
Clickable |
Display permission limited to level 1 or level 2 explanation is missing.
Display permission for levels 1 and 2 and level 2 explanation is available. |
Confidence Indicator
A confidence indicator is a variant of the explanation indicator, and is used to indicate the quality for an individual result. Rather than percentage-based confidence levels, the explainable AI concept uses confidence categories.
Confidence Indicator – Best Practices
| Do | Don’t | |||
| Approach | Use confidence categories | Use confidence levels | ||
|
High level of accuracy |
Examples:
Recommended |
Examples:
89.68% |
||
| Reference system | Provided | Not provided |
| Design Rationale |
| A common approach in AI applications is to use percentage values to indicate the quality of a prediction. However, there is a usability issue with this method. People interpret confidence percentages differently, depending on their character and mood and the current situation.
Some users might reject predictions with a relatively high confidence rating (like 84%). Others will go with a proposal despite a much lower confidence rating (like 64%). The percentage value for the confidence level has no bearing on the actual output. Poor user choices can also adversely affect learning algorithms. In this case, the machine learns from inefficient or misleading feedback. |
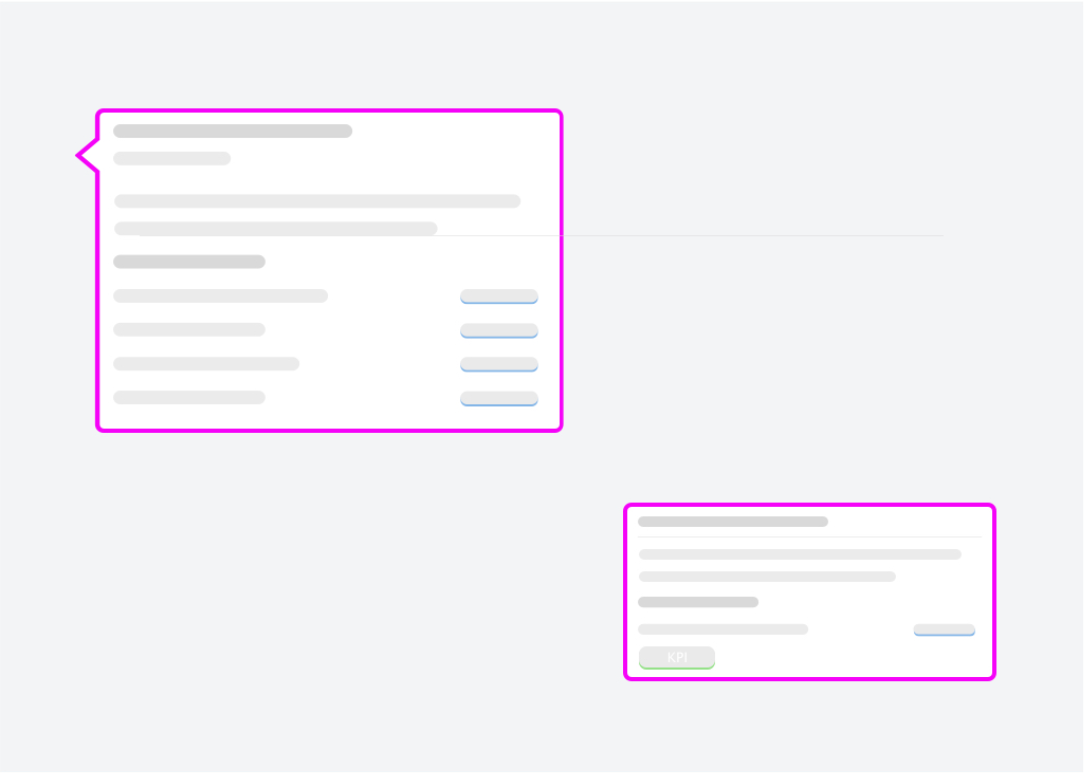
Level 2: Simple Explanation
Explanation Popover/Overlay
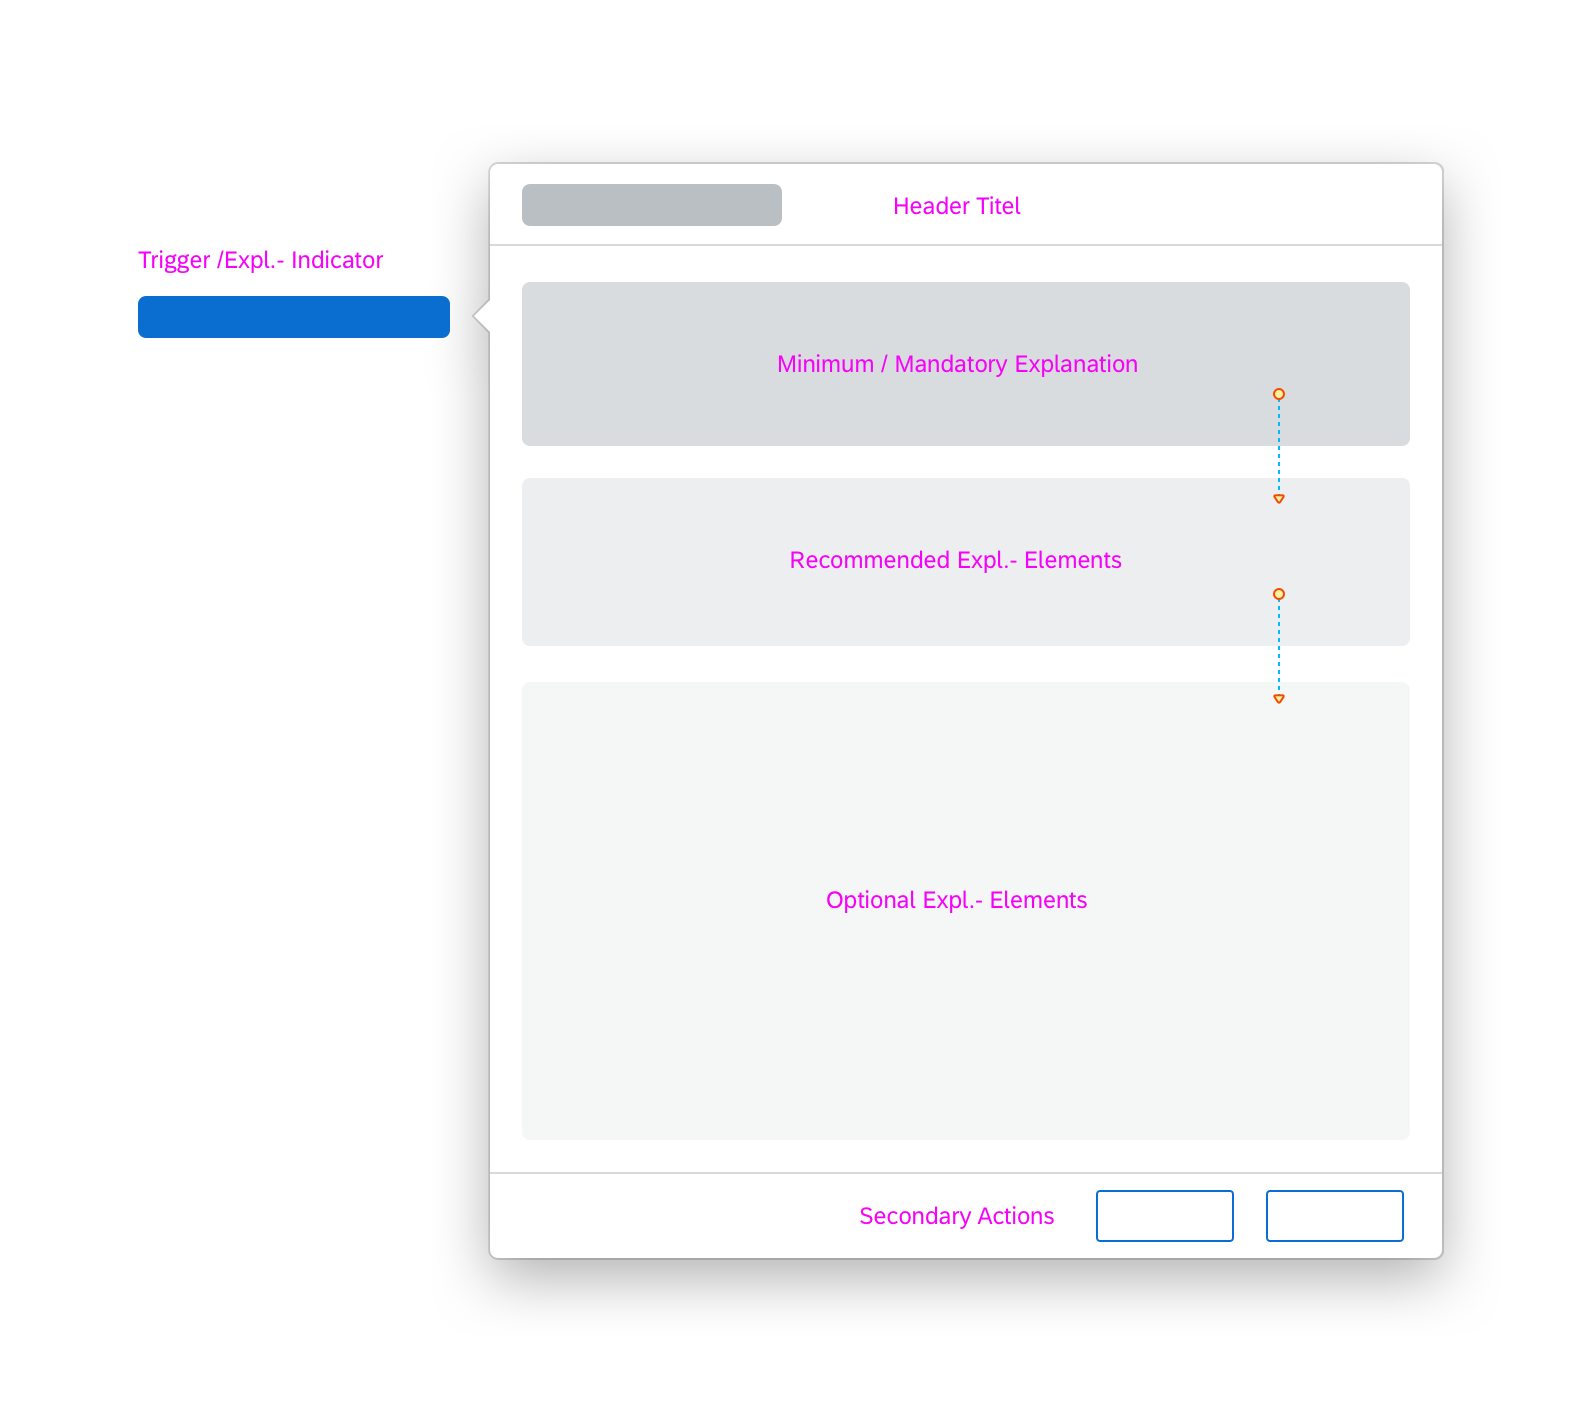
Users access the explanation popover by clicking the explanation indicator. The popover is a canvas to provide contextual information beyond quality ratings, and to list or visualize key factors, inputs, or criteria that led to the AI result (for example, you could use a model induction algorithm or “Explainer” to reveal which data best supports the prediction).
Explanation popovers, screen overlays or conversational items can include the following elements:
- Self-explanatory header title
- Minimum: Short explanation of what the AI has performed in natural language.
- Minimum: For AI outputs that are part of a scale, offer a key or legend to explain how the current value should be read.
- Recommended: A timestamp indicating when the result or prediction was computed. If the output is time-critical, show when the result or prediction was last updated.
- Recommended: A list of the 3-5 most important parameters that influenced the result being explained. This can include a comparison with averages or reference values, if required.
- Optional: A short explanation in natural language of how the AI has performed in comparison to a given reference (historical cases, given data, average prediction accuracy, or similar). This can be combined with performance indicators or a trend.
- Optional: In-place feedback controls if you want to collect explicit user feedback. For more information, see User Feedback.

Natural Language Explanations
Natural language explanations are a variation of AI explanations that apply conversational interaction principles as they are used in conversational interfaces. Reasoning and relations are represented in the form of sentences and non-technical speech.
The usage of natural language explanations is limited to the components explanation popover/overlay, explanation page, recommendation items, and conversational UI/SAP CoPilot. Currently, we have no proven research that natural language explanations are beneficial in other locations. For more complex situations, also see Situation Handling.
Natural Language Explanations – Examples
| Scenario | Examples |
| Adding value at each disclosure level | Level 1: Ranked By: Price, Delivery Time, Minimum Order Quantity, …
Level 2: |
| Specific information | “Polaris Lights” offers the best price (470 USD) for the product “Taillight”, with the lowest minimum order quantity (300 PC). Delivery (14 days) takes longer than average. Best price with lowest minimum order quantity. Delivery takes longer than average. |
| Just enough formatting | This is high priority because the net payment is due soon (in 3 days) and the amount is small (1.200,00 USD). Customer Electronics usually pays on time. This is high priority because the net payment is due soon (in 3 days) and the amount is small (1.200,00 USD). Customer Electronics usually pays on time. |
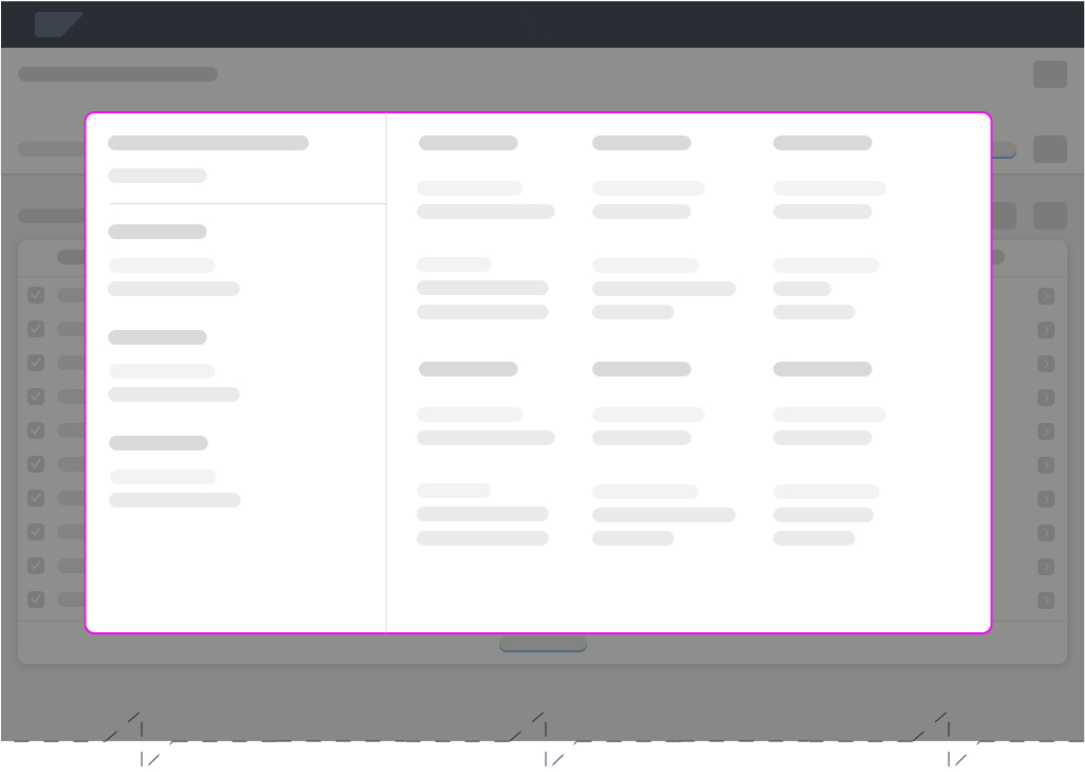
Level 3: Extended Explanation
Explanation Page
You can use the extended explanation page to offer a more in-depth analysis. You can either direct users to a separate, dedicated application, or provide an additional page within your own app. This will depend on how much control and insight you are willing or able to provide for the technology being used. In most cases, extended explanations have a distinct use case that requires a separate implementation.
Explanation Page
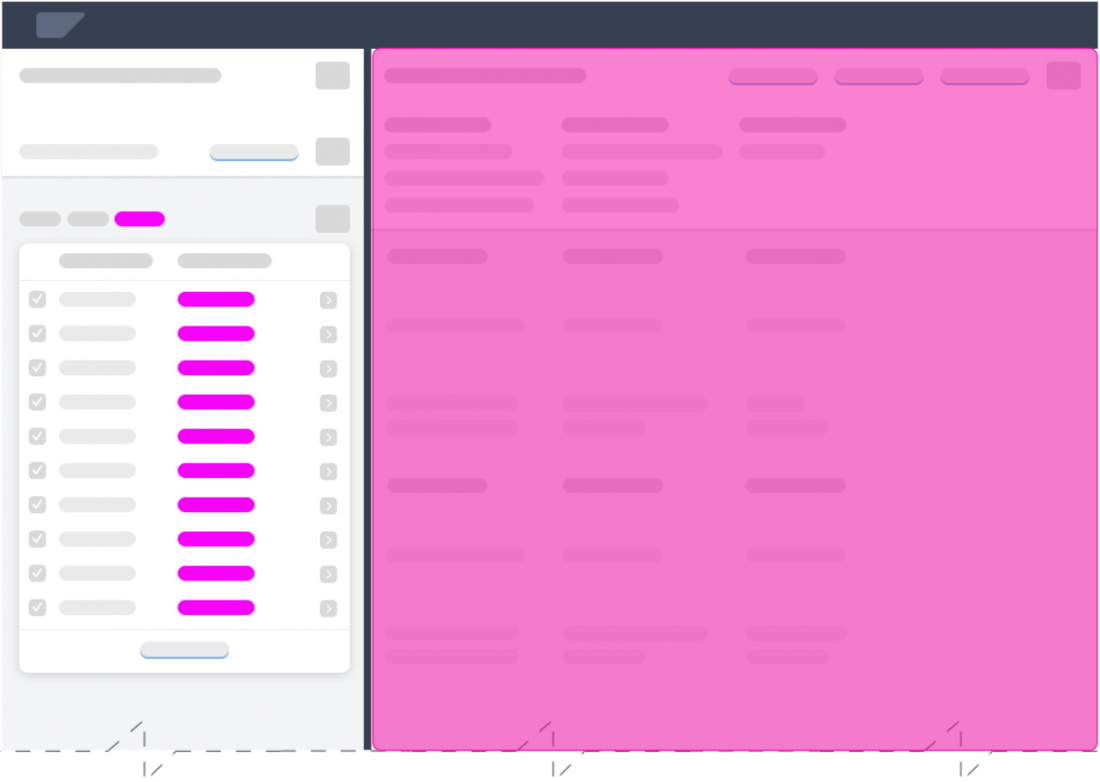
Detail explanation page in a flexible column layout
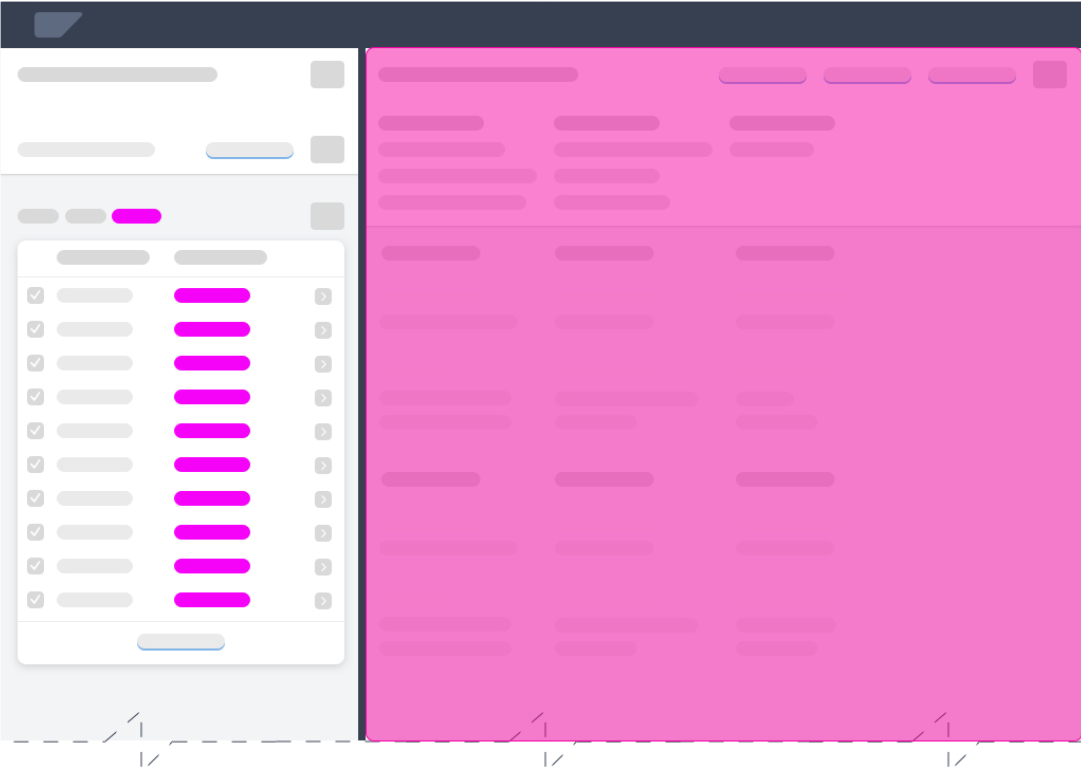
Dedicated Explanation App
Explanation Page Content
The content on the explanation page depends on the needs of the user. At this point in time, the user probably has a specific reason for opening the detailed explanation.
- If the explanation page is opened from a global explanation popover, the user focus is on the service as a whole. In this case, the user might want to learn more about the overall reliability of the service (business user), or the performance of the AI model (AI expert).
- If the explanation page is opened from a local explanation popover, the user focus is on how a specific result was inferred. In this case, the user might want to see which other parameters were used for this prediction (business user), or review the log entries for the system reasoning (AI expert).
Behavior and Interaction
When to Display Explanations
Display explanation components only when the AI service is able to provide predictions with reasonable confidence/accuracy. The threshold for acceptable prediction quality must be defined on a case-by-case basis, and depends on the given use case and AI capabilities. Nevertheless, we do not recommend exposing any predictions that have only poor reliability. Unreliable results lead to damaged user trust and hinder adoption of the AI functionality.
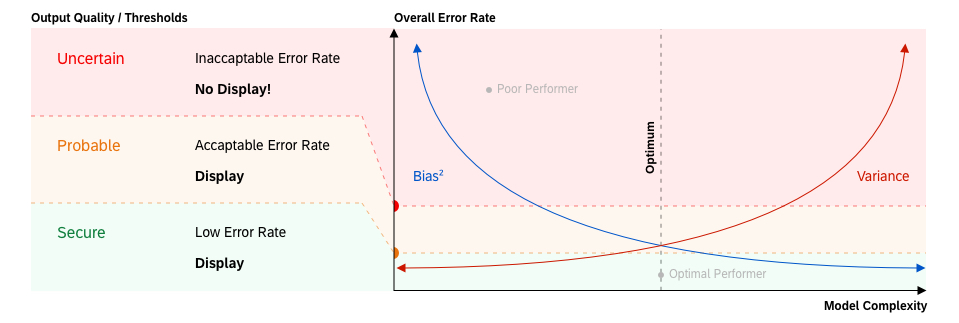
Example: Definition of quality thresholds
How Long is an Explanation Valid?
The validity of an explanation depends on the machine learning cycle. We differentiate two cases based on the explanation lifespan.
Static Explanations
Static explanations are suitable for “offline learning” or instance-based AI services. We assume that the need for a repeated explanation of the model can decrease or even disappear over time as the user gains more experience with the system.
Dynamic Explanations
Dynamic explanations are required for “online learning” AI services. This type of explanation is generated (refined) every time the AI has learned and adapted its model. In most cases, it’s not necessary to change the appearance and content of the explanations completely. However, if an AI service discovers new rules to process items in the system, this newly-acquired knowledge must be reflected in its explanations.
Responsiveness
Fully Responsive
The explanation components explanation indicator and explanation popover must be fully responsive and available on all devices.
Partially Responsive
We recommend limiting the extended explanation (level 3) to larger form factors (desktop, large tablets) due to its complexity and type of use. If your scenario requires mobile access to detailed explanations, try to limit the amount of information and options to the essential elements.
Partially Adaptive
Explanation indicators are partially adaptive due to the two possible indicator styles (default and extended). The default style is the mandatory format. The extended style is optional for cases where decision criteria are available or beneficial for the user. If the information for the extended display is missing, or there is insufficient screen real estate, revert back to the default state.
For more information about responsiveness, see Multi-Device Support.
Top Tips
Before you start with your design, conduct research to figure out the answers to the questions below.
If extensive research is not an option, use a heuristic evaluation method to test your design. This should be the minimum investment.
- Does the user expect an explanation?
If the risks associated with an action are quite low and the results can easily be rolled back, users are not normally interested in an explanation of the system proposal. - What level of automation are you aiming for?
Depending on the automation level, the use case and target user roles and app functionality can change dramatically. - Which other roles are involved in the experience besides your target business user?
The interaction with AI systems also involves technical, non-business roles. Also consider roles involved in development, support, or maintenance. - How transparent or traceable does your machine learning service have to be?
Some use cases are more critical than others. Due to legal and regulatory provisions, enterprise applications are often subject to stricter auditing requirements than consumer software. - Are your users generally able to relate to the displayed information and data, and can they infer the follow-on actions and impact (detail and explicitness)?
Although AI can help optimize even simpler tasks, it might be overengineered to provide AI explanations when the user fully understands the results and implications. - How harmful can wrongly processed data be for the business of your client?
Some actions in processes are critical by design and can have serious side effects. AI explanations must safeguard such scenarios and help prevent any damage or disruption. - How easy or difficult is it to revert changes applied to the system or process?
In scenarios where the user faces deadlines, period-end closing, or other actions that must succeed first time, providing information to support the user is crucial. However, may not need explanations if it is possible to just revert everything instantly in case of failure. - Does your business case require continuous adaptation?
We assume that the need for a repeated (static) explanation of the model can decrease or even disappear over time as the user gains more experience. However, if the AI learns dynamically, users must always be informed of changing conditions (dynamic explanations).
 Your feedback has been sent to the SAP Fiori design team.