
- Latest SAPUI Version 1.124
- SAPUI5 Version 1.122
- SAPUI5 Version 1.120
- SAPUI5 Version 1.118
- SAPUI5 Version 1.116
- SAPUI5 Version 1.114
- SAPUI5 Version 1.112
- SAPUI5 Version 1.110
- SAPUI5 Version 1.108
- SAPUI5 Version 1.106
- SAPUI5 Version 1.104
- SAPUI5 Version 1.102
- SAPUI5 Version 1.100
- SAPUI5 Version 1.98
- SAPUI5 Version 1.96
- SAPUI5 Version 1.94
- SAPUI5 Version 1.92
- SAPUI5 Version 1.90
- SAPUI5 Version 1.88
- SAPUI5 Version 1.86
- SAPUI5 Version 1.84
- SAPUI5 Version 1.82
- SAPUI5 Version 1.80
- SAPUI5 Version 1.78
- SAPUI5 Version 1.76
- SAPUI5 Version 1.74
- SAPUI5 Version 1.72
- SAPUI5 Version 1.70
- SAPUI5 Version 1.68
- SAPUI5 Version 1.66
- SAPUI5 Version 1.64
- SAPUI5 Version 1.62
- SAPUI5 Version 1.60
- SAPUI5 Version 1.58
- SAPUI5 Version 1.56
- SAPUI5 Version 1.54
- SAPUI5 Version 1.52
- SAPUI5 Version 1.50
- SAPUI5 Version 1.48
- SAPUI5 Version 1.46
- SAPUI5 Version 1.44
- SAPUI5 Version 1.42
- SAPUI5 Version 1.40
- SAPUI5 Version 1.38
- SAPUI5 Version 1.36
- SAPUI5 Version 1.34
- SAPUI5 Version 1.32
- SAPUI5 Version 1.30
- SAPUI5 Version 1.28
- SAPUI5 Version 1.26
Chart (VizFrame)
sap.viz.ui5.controls.VizFrame | sap.suite.ui.commons.ChartContainer
Intro
Charts are used to display quantitative information. They give the user access to key information contained in structured data records. Charts are efficient because they are based on visual perception, which helps with identifying shapes. If charts are correctly designed, the key information will be correctly highlighted.
Use vizFrame charts to visualize large set of values, in a fully interactive and responsive way. But obviously, small set of data also works well.
The ChartContainer SAPUI5 control allows you to have a toolbar on top, it also allows switching between charts and tables and to use the full screen mode.
- Chart Type
- Behavior & Interaction – Selection, popover, gesture
- Chart Toolbar
- Embedding
- Primary Data – Size of data points, value display
- Secondary Data – Legend, reference line
- Color Palettes
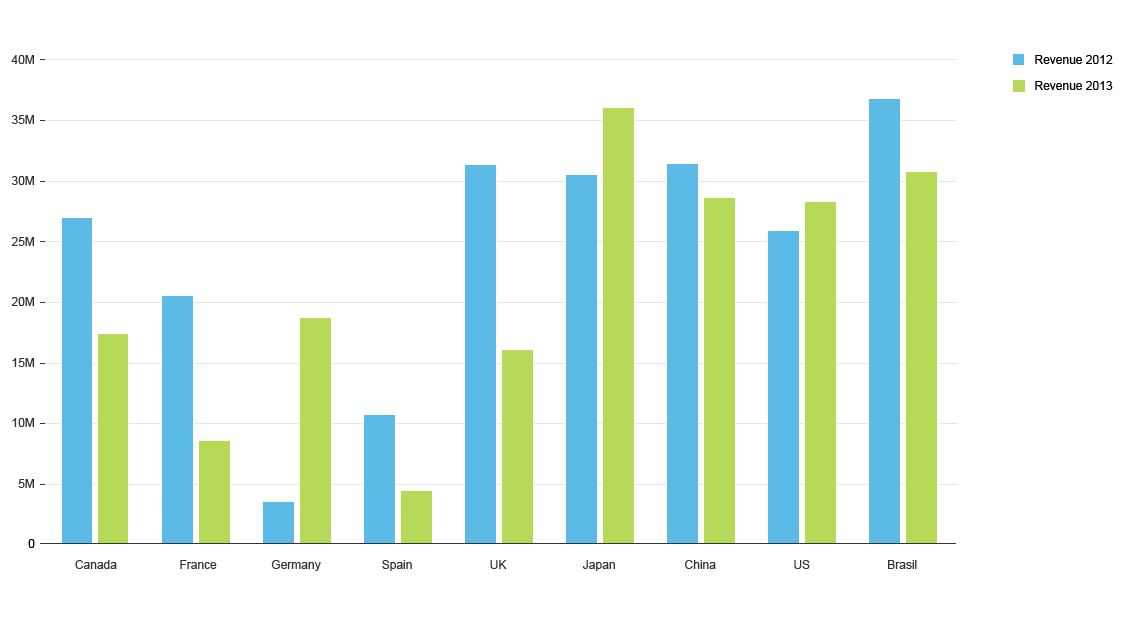
vizFrame column chart
If you need to visualize very few data points in small sizes, and in a non-interactive way, then use the mini charts. Mini charts can be embedded in tiles, smart business drill down and any SAPUI5 container such as SAPUI5 tables.
Resources
Want to dive deeper? Follow the links below to find out more about related controls, the SAPUI5 implementation, and the visual design.
 Your feedback has been sent to the SAP Fiori design team.