
- Latest SAPUI Version 1.124
- SAPUI5 Version 1.122
- SAPUI5 Version 1.120
- SAPUI5 Version 1.118
- SAPUI5 Version 1.116
- SAPUI5 Version 1.114
- SAPUI5 Version 1.112
- SAPUI5 Version 1.110
- SAPUI5 Version 1.108
- SAPUI5 Version 1.106
- SAPUI5 Version 1.104
- SAPUI5 Version 1.102
- SAPUI5 Version 1.100
- SAPUI5 Version 1.98
- SAPUI5 Version 1.96
- SAPUI5 Version 1.94
- SAPUI5 Version 1.92
- SAPUI5 Version 1.90
- SAPUI5 Version 1.88
- SAPUI5 Version 1.86
- SAPUI5 Version 1.84
- SAPUI5 Version 1.82
- SAPUI5 Version 1.80
- SAPUI5 Version 1.78
- SAPUI5 Version 1.76
- SAPUI5 Version 1.74
- SAPUI5 Version 1.72
- SAPUI5 Version 1.70
- SAPUI5 Version 1.68
- SAPUI5 Version 1.66
- SAPUI5 Version 1.64
- SAPUI5 Version 1.62
- SAPUI5 Version 1.60
- SAPUI5 Version 1.58
- SAPUI5 Version 1.56
- SAPUI5 Version 1.54
- SAPUI5 Version 1.52
- SAPUI5 Version 1.50
- SAPUI5 Version 1.48
- SAPUI5 Version 1.44
- SAPUI5 Version 1.42
- SAPUI5 Version 1.40
- SAPUI5 Version 1.38
- SAPUI5 Version 1.36
- SAPUI5 Version 1.34
- SAPUI5 Version 1.32
- SAPUI5 Version 1.30
- SAPUI5 Version 1.28
- SAPUI5 Version 1.26
- Latest SAPUI Version 1.124
- SAPUI5 Version 1.122
- SAPUI5 Version 1.120
- SAPUI5 Version 1.118
- SAPUI5 Version 1.116
- SAPUI5 Version 1.114
- SAPUI5 Version 1.112
- SAPUI5 Version 1.110
- SAPUI5 Version 1.108
- SAPUI5 Version 1.106
- SAPUI5 Version 1.104
- SAPUI5 Version 1.102
- SAPUI5 Version 1.100
- SAPUI5 Version 1.98
- SAPUI5 Version 1.96
- SAPUI5 Version 1.94
- SAPUI5 Version 1.92
- SAPUI5 Version 1.90
- SAPUI5 Version 1.88
- SAPUI5 Version 1.86
- SAPUI5 Version 1.84
- SAPUI5 Version 1.82
- SAPUI5 Version 1.80
- SAPUI5 Version 1.78
- SAPUI5 Version 1.76
- SAPUI5 Version 1.74
- SAPUI5 Version 1.72
- SAPUI5 Version 1.70
- SAPUI5 Version 1.68
- SAPUI5 Version 1.66
- SAPUI5 Version 1.64
- SAPUI5 Version 1.62
- SAPUI5 Version 1.60
- SAPUI5 Version 1.58
- SAPUI5 Version 1.56
- SAPUI5 Version 1.54
- SAPUI5 Version 1.52
- SAPUI5 Version 1.50
- SAPUI5 Version 1.48
- SAPUI5 Version 1.46
- SAPUI5 Version 1.44
- SAPUI5 Version 1.42
- SAPUI5 Version 1.40
- SAPUI5 Version 1.38
- SAPUI5 Version 1.36
- SAPUI5 Version 1.34
- SAPUI5 Version 1.32
- SAPUI5 Version 1.30
- SAPUI5 Version 1.28
- SAPUI5 Version 1.26
Chart – Selection
Intro
The user can select one or more data points. They are generally selected to display related information about the respective points or to trigger actions that relate to them. There are several ways in which the user can select items.
Default Selection
The charts provide three types of selections:
No Selection
In this mode, data points cannot be selected individually and therefore no actions can be triggered from a data point.
- When the user clicks or taps a data point, nothing happens.
- When a user with a mouse device hovers the pointer over a data point, nothing happens.
Single Selection
In single-selection mode, the user clicks or taps a data point to select it. Clicking or tapping another data point selects this data point and deselects the previously selected one.
Clicking or tapping a blank area deselects a selected data point.
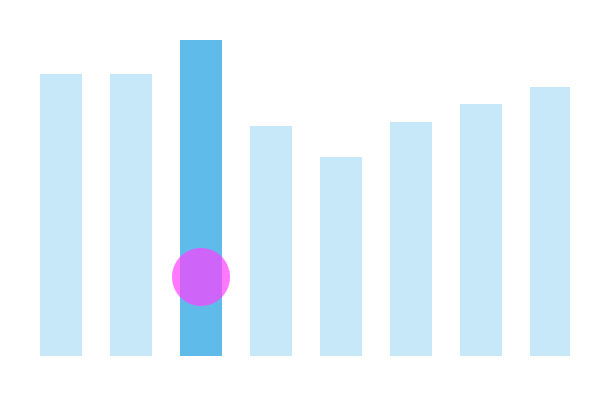
Example of single selection
Multiselection
This is the default mode.
In multiselection mode, the user clicks or taps a data point to add it to the selection.
Clicking or tapping a blank area deselects all selected data points.
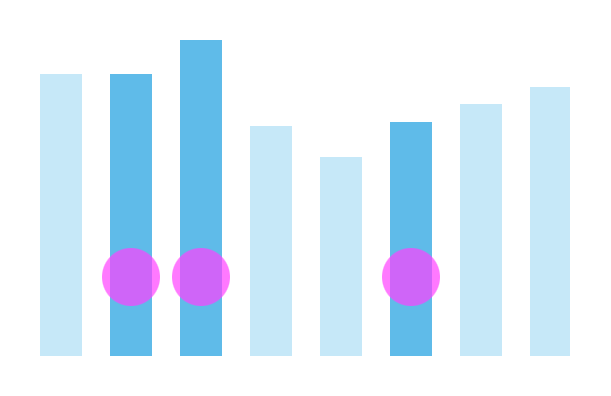
Example of multiselection (default mode)
Shortcut for Multiselection
The following actions are shortcuts for selecting multiple data points:
- Click or tap a category label: All associated data points are selected.
- Click or tap a legend item: All associated data points are selected.
- Rubber-band-like lasso selection: All data points within the lasso are selected.
Example of multiselection (shortcut)
Selection by API
The way in which data points are selected when they are clicked or tapped can also be changed through the vizSelection (aPoints, oAction) API.
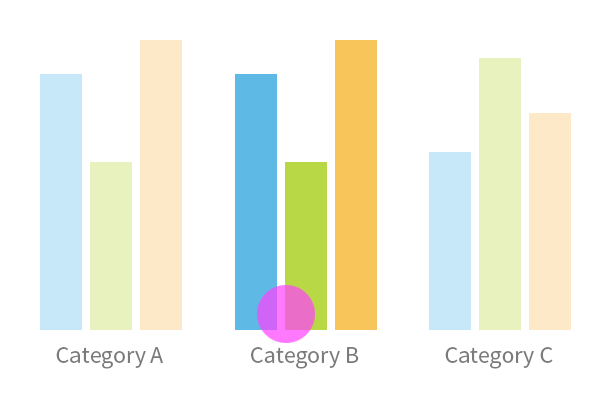
Example: Category Selection
You can implement category selection by using the vizSelection (aPoints, oAction) API. When the user clicks or taps a data point, all data points in the same category are selected.
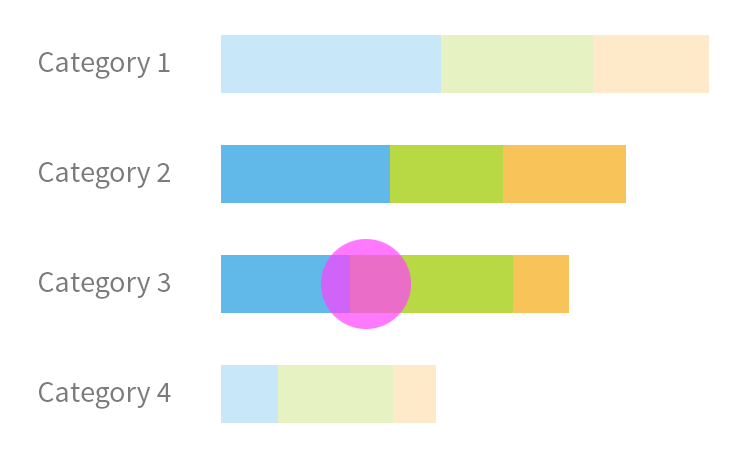
Example with stacked bars:
When the user clicks or taps a bar, all bars in the same stack are selected.
Example of category selection - First click
When the user clicks or taps another stack, this stack is added to the selection. The selection then contains all items of the two selected stacks.
Example of category selection - Second click
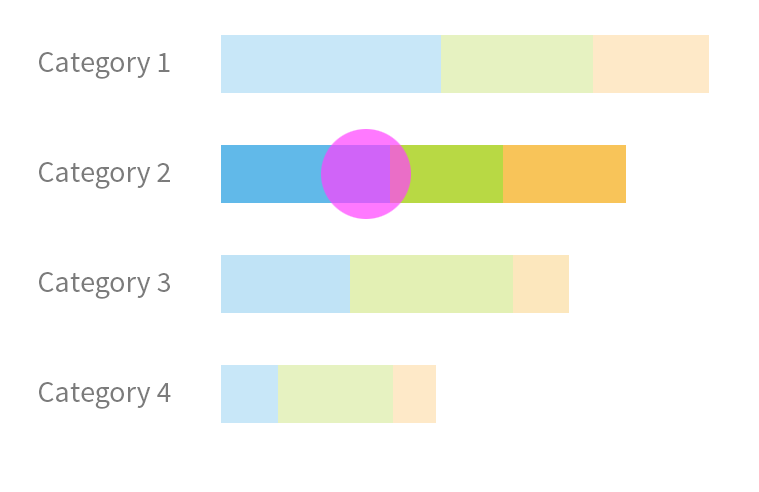
Example: Series Selection
You can implement series selection by using the vizSelection (aPoints, oAction) API. When the user clicks or taps a data point, all data points in the same series are selected.
Example with Line Chart:
When the user clicks or taps a data point, all data points in the same line (series) are selected.
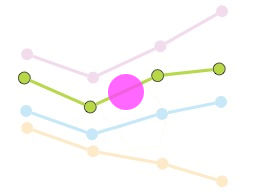
Example of series selection - First click
When the user clicks or taps another line, this line is added to the selection. The selection then contains all items of the two selected lines.
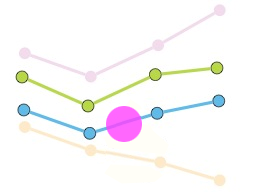
Example of series selection - Second click
Deselection
Clicking or tapping a selected item deselects it again.
Clicking or tapping a blank area of the chart deselects all data points that are currently selected.
Appearance
Selected and non-selected items differ in terms of their appearance as follows:
- Selected items are highlighted by using a darker color.
- Non-selected items have a lighter color.
Resources
Want to dive deeper? Follow the links below to find out more about related controls, the SAPUI5 implementation, and the visual design.
 Your feedback has been sent to the SAP Fiori design team.