
- Latest SAPUI Version 1.124
- SAPUI5 Version 1.122
- SAPUI5 Version 1.120
- SAPUI5 Version 1.118
- SAPUI5 Version 1.116
- SAPUI5 Version 1.114
- SAPUI5 Version 1.112
- SAPUI5 Version 1.110
- SAPUI5 Version 1.108
- SAPUI5 Version 1.106
- SAPUI5 Version 1.104
- SAPUI5 Version 1.102
- SAPUI5 Version 1.100
- SAPUI5 Version 1.98
- SAPUI5 Version 1.96
- SAPUI5 Version 1.94
- SAPUI5 Version 1.92
- SAPUI5 Version 1.90
- SAPUI5 Version 1.88
- SAPUI5 Version 1.86
- SAPUI5 Version 1.84
- SAPUI5 Version 1.82
- SAPUI5 Version 1.80
- SAPUI5 Version 1.76
- SAPUI5 Version 1.74
- SAPUI5 Version 1.72
- SAPUI5 Version 1.70
- SAPUI5 Version 1.68
- SAPUI5 Version 1.66
- SAPUI5 Version 1.64
- SAPUI5 Version 1.62
- SAPUI5 Version 1.60
- SAPUI5 Version 1.58
- SAPUI5 Version 1.56
- SAPUI5 Version 1.54
- SAPUI5 Version 1.52
- SAPUI5 Version 1.50
- SAPUI5 Version 1.48
- SAPUI5 Version 1.46
- SAPUI5 Version 1.44
- SAPUI5 Version 1.42
- SAPUI5 Version 1.40
- SAPUI5 Version 1.38
- SAPUI5 Version 1.36
- SAPUI5 Version 1.34
- SAPUI5 Version 1.32
- SAPUI5 Version 1.30
- SAPUI5 Version 1.28
- SAPUI5 Version 1.26
- Latest SAPUI Version 1.124
- SAPUI5 Version 1.122
- SAPUI5 Version 1.120
- SAPUI5 Version 1.118
- SAPUI5 Version 1.116
- SAPUI5 Version 1.114
- SAPUI5 Version 1.112
- SAPUI5 Version 1.110
- SAPUI5 Version 1.108
- SAPUI5 Version 1.106
- SAPUI5 Version 1.104
- SAPUI5 Version 1.102
- SAPUI5 Version 1.100
- SAPUI5 Version 1.98
- SAPUI5 Version 1.96
- SAPUI5 Version 1.94
- SAPUI5 Version 1.92
- SAPUI5 Version 1.90
- SAPUI5 Version 1.88
- SAPUI5 Version 1.86
- SAPUI5 Version 1.84
- SAPUI5 Version 1.82
- SAPUI5 Version 1.80
- SAPUI5 Version 1.78
- SAPUI5 Version 1.76
- SAPUI5 Version 1.74
- SAPUI5 Version 1.72
- SAPUI5 Version 1.70
- SAPUI5 Version 1.68
- SAPUI5 Version 1.66
- SAPUI5 Version 1.64
- SAPUI5 Version 1.62
- SAPUI5 Version 1.60
- SAPUI5 Version 1.58
- SAPUI5 Version 1.56
- SAPUI5 Version 1.54
- SAPUI5 Version 1.52
- SAPUI5 Version 1.50
- SAPUI5 Version 1.48
- SAPUI5 Version 1.46
- SAPUI5 Version 1.44
- SAPUI5 Version 1.42
- SAPUI5 Version 1.40
- SAPUI5 Version 1.38
- SAPUI5 Version 1.36
- SAPUI5 Version 1.34
- SAPUI5 Version 1.32
- SAPUI5 Version 1.30
- SAPUI5 Version 1.28
- SAPUI5 Version 1.26
Chart – Distribution
Intro
This page will help you choose an appropriate chart for visualizing how values are distributed within a set.
For example: You want to visualize how the number of employees are distributed across different salary ranges, or you want to compare the distribution of salaries across different job levels.
Single Distribution
You can use a histogram or a frequency polygon to visualize how values are distributed within one set of values.
Histogram
A histogram is used to display a number of values distributed across a series of ranges. Histograms are extremely useful for emphasizing the number of values.
The convention for a histogram is to remove the gaps between the bars or columns. However, as this chart is not yet available in SAP Fiori, you can use a classic column chart or bar chart instead.
The chart below shows how the rating of a product is distributed.
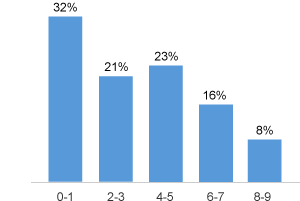
Histogram with vertical bars
If the labels of the ranges are long compared to the width of the chart, it’s better to use horizontal bars as illustrated below. If you follow this advice, you will avoid the undesirable effects that come as a result of displaying the category labels at 45°, making them hard to read and frequently leading to truncation of text.
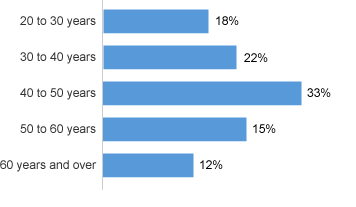
Histogram with horizontal bar
Frequency Polygon
If you want to emphasize the shape of the distribution more than the number of values, then use a ‘frequency polygon’ which is really just a line chart that shows the distribution of a frequency of something. The chart below shows how salaries are distributed within a company.
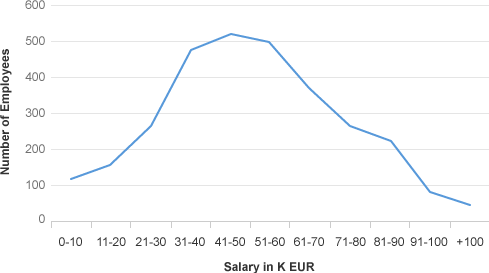
Frequency polygon
Multiple Distribution
You can use a frequency polygon with multiple lines if you want to compare the distribution of multiple sets of values. The chart below compares the distribution of salaries between two countries.
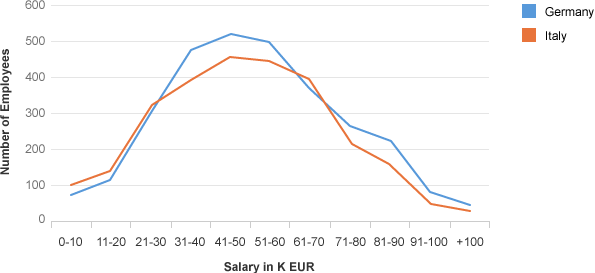
Frequency polygon with two series
You can use a ‘stacked histogram’ if you want to split the distribution into multiple parts, as illustrated below.
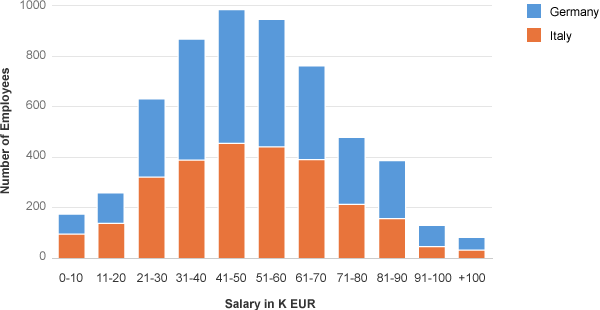
Stacked histogram with two series
Box Plot
The Box plot is an ideal chart if you want to display how a distribution changes over time, or you want to compare many distributions. The example below illustrates a typical box plot with the median including the lower and higher quartiles and the highest and lowest value.
Please note that the box plot is not yet available in the SAP Fiori chart library.
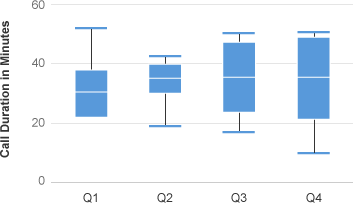
Box plot
Resources
Want to dive deeper? Follow the links below to find out more about related controls, the SAPUI5 implementation, and the visual design.
Implementation
- Line Chart (SAPUI5 samples)
- Column Chart (SAPUI5 samples)
- Stacked Column Chart (SAPUI5 samples)
 Your feedback has been sent to the SAP Fiori design team.