
- Latest SAPUI Version 1.124
- SAPUI5 Version 1.122
- SAPUI5 Version 1.120
- SAPUI5 Version 1.118
- SAPUI5 Version 1.116
- SAPUI5 Version 1.114
- SAPUI5 Version 1.112
- SAPUI5 Version 1.110
- SAPUI5 Version 1.108
- SAPUI5 Version 1.106
- SAPUI5 Version 1.104
- SAPUI5 Version 1.102
- SAPUI5 Version 1.100
- SAPUI5 Version 1.98
- SAPUI5 Version 1.96
- SAPUI5 Version 1.94
- SAPUI5 Version 1.92
- SAPUI5 Version 1.88
- SAPUI5 Version 1.86
- SAPUI5 Version 1.84
- SAPUI5 Version 1.82
- SAPUI5 Version 1.80
- SAPUI5 Version 1.78
- SAPUI5 Version 1.76
- SAPUI5 Version 1.74
- SAPUI5 Version 1.72
- SAPUI5 Version 1.70
- SAPUI5 Version 1.68
- SAPUI5 Version 1.66
- SAPUI5 Version 1.64
- SAPUI5 Version 1.62
- SAPUI5 Version 1.60
- SAPUI5 Version 1.58
- SAPUI5 Version 1.56
- SAPUI5 Version 1.54
- SAPUI5 Version 1.52
- SAPUI5 Version 1.50
- SAPUI5 Version 1.48
- SAPUI5 Version 1.46
- SAPUI5 Version 1.44
- SAPUI5 Version 1.42
- SAPUI5 Version 1.40
- SAPUI5 Version 1.38
- SAPUI5 Version 1.36
- SAPUI5 Version 1.34
- SAPUI5 Version 1.32
- SAPUI5 Version 1.30
- SAPUI5 Version 1.28
- SAPUI5 Version 1.26
- Latest SAPUI Version 1.124
- SAPUI5 Version 1.122
- SAPUI5 Version 1.120
- SAPUI5 Version 1.118
- SAPUI5 Version 1.116
- SAPUI5 Version 1.114
- SAPUI5 Version 1.112
- SAPUI5 Version 1.110
- SAPUI5 Version 1.108
- SAPUI5 Version 1.106
- SAPUI5 Version 1.104
- SAPUI5 Version 1.102
- SAPUI5 Version 1.100
- SAPUI5 Version 1.98
- SAPUI5 Version 1.96
- SAPUI5 Version 1.94
- SAPUI5 Version 1.92
- SAPUI5 Version 1.90
- SAPUI5 Version 1.88
- SAPUI5 Version 1.86
- SAPUI5 Version 1.84
- SAPUI5 Version 1.82
- SAPUI5 Version 1.80
- SAPUI5 Version 1.78
- SAPUI5 Version 1.76
- SAPUI5 Version 1.74
- SAPUI5 Version 1.72
- SAPUI5 Version 1.70
- SAPUI5 Version 1.68
- SAPUI5 Version 1.66
- SAPUI5 Version 1.64
- SAPUI5 Version 1.62
- SAPUI5 Version 1.60
- SAPUI5 Version 1.58
- SAPUI5 Version 1.56
- SAPUI5 Version 1.54
- SAPUI5 Version 1.52
- SAPUI5 Version 1.50
- SAPUI5 Version 1.48
- SAPUI5 Version 1.46
- SAPUI5 Version 1.44
- SAPUI5 Version 1.42
- SAPUI5 Version 1.40
- SAPUI5 Version 1.38
- SAPUI5 Version 1.36
- SAPUI5 Version 1.34
- SAPUI5 Version 1.32
- SAPUI5 Version 1.30
- SAPUI5 Version 1.28
- SAPUI5 Version 1.26
Chart – Zoom
Intro
x
The user can change the scale of an axis on a chart by using the zoom function. This function spreads or shrinks the scale of the horizontal or vertical axis. Both the categorical and continuous axes can be zoomed.
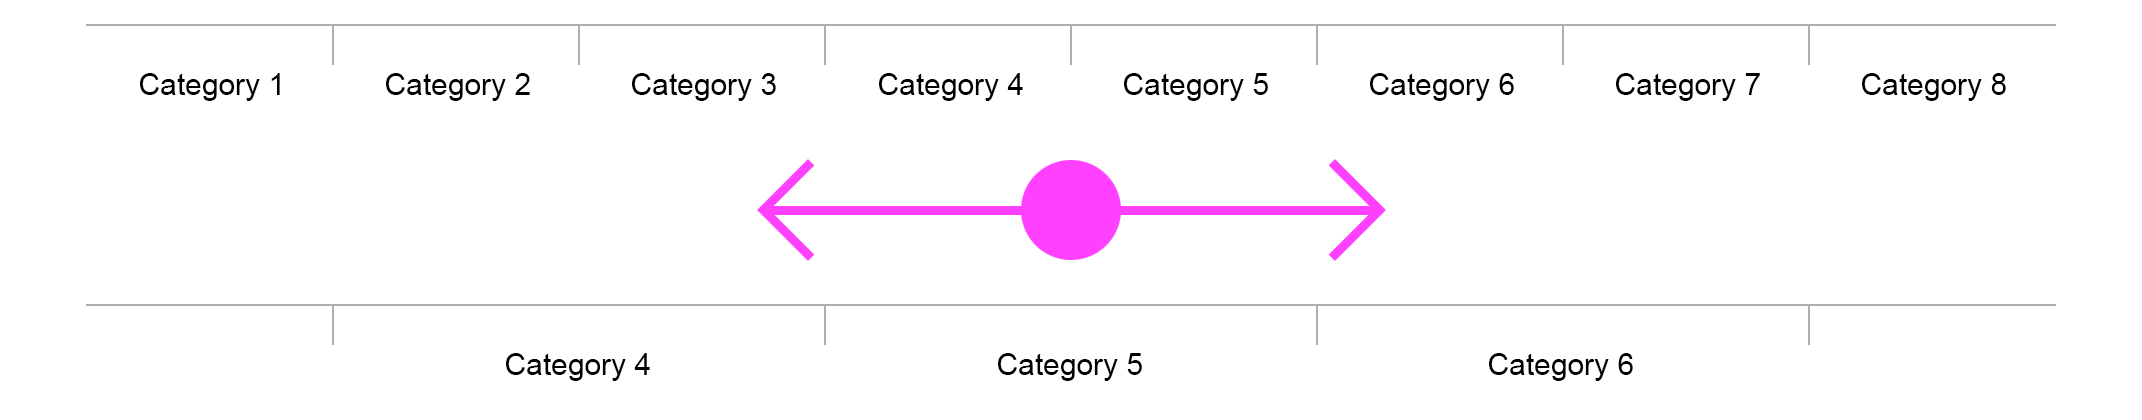
Example of zoom on a horizontal categorical axis
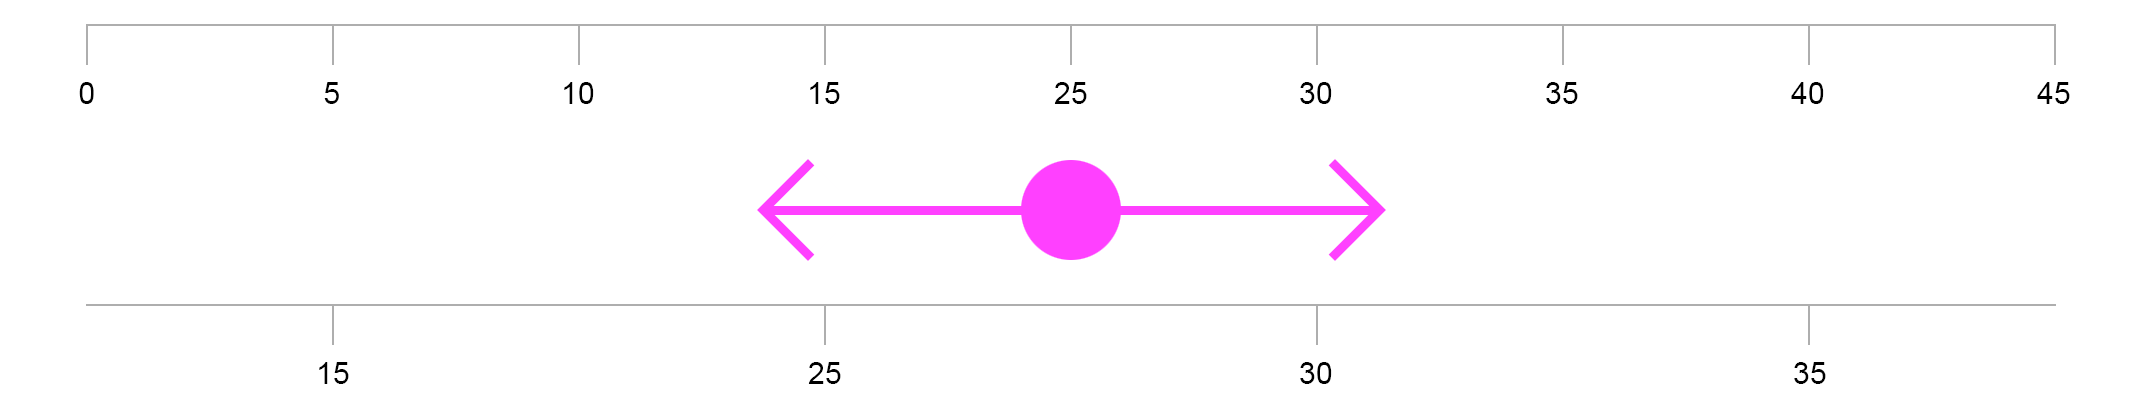
Example of zoom on a horizontal continuous axis
This type of zoom is called scale zoom (as opposed to optical zoom) because when the user zooms, only the scale and the encoding objects, such as bars, bubbles, and lines are changed, but all the text, the axis line, the legend, and icons remain identical.
Note that semantic zoom is not yet supported. Semantic zoom is only applicable if one dimension is hierarchical. It changes the level of the hierarchy currently displayed and aggregates data accordingly.
Zooming Direction
The zooming direction depends on the scrolling direction of the chart. The zooming direction cannot be changed since it is defined individually for each chart type.
For charts that scroll horizontally, the zoom changes the scale of the horizontal axis.
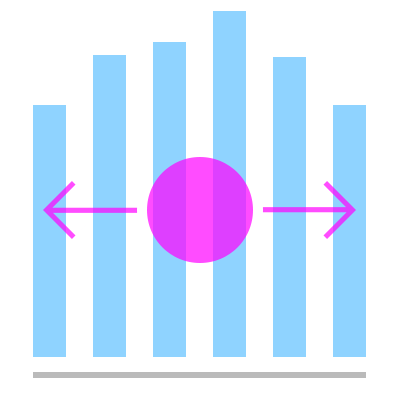
Zoom of a chart that scrolls horizontally
For charts that scroll vertically, the zoom changes the scale of the vertical axis.
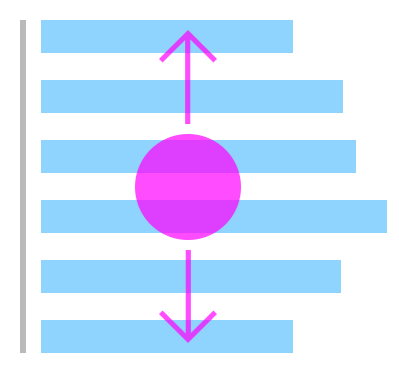
Zoom of a chart that scrolls vertically
For charts that do not have a specific scrolling direction, the zoom changes the scale of both axes.

Zoom of a chart that scrolls in both directions
How To Zoom
There are four ways of zooming:
- Toolbar: Use the zoom icons in the chart toolbar.
- Mouse wheel: Use Ctrl plus the mouse wheel to zoom in and out.
- Gesture: On a touch screen, use the pinch and spread gesture.
- Keyboard: Use the [+] and [-] keys to zoom in and out.
Toolbar Zoom Icons
The charts cannot be zoomed by default. This must be defined explicitly.
If you define the chart as zoomable, you must also declare the two zoom icons in the chart toolbar. These icons are correctly positioned in the toolbar and automatically pilot the zooming feature in the chart.
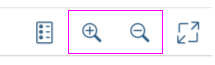
Zoom icons in the chart toolbar
Zoom Settings
The user can control the zoom scale by defining the following settings:
- Whether the zoom is enabled (property:interaction.zoom.enablement).
- The initial range to be displayed (property:plotArea.window.start and property:plotArea.window.end).
No Initial Range
Zoomable Chart
This is the default setting of the charts.
The display starts with the first data point of the dataset, and the initial scale is calculated to avoid data points that are too small. A scrollbar is used if necessary. The user can zoom in to see more details or zoom out to see an overview of the dataset.
Non-Zoomable Chart
The first data point of the dataset is displayed. The scale is fixed and cannot be changed. A scrollbar is used if necessary.
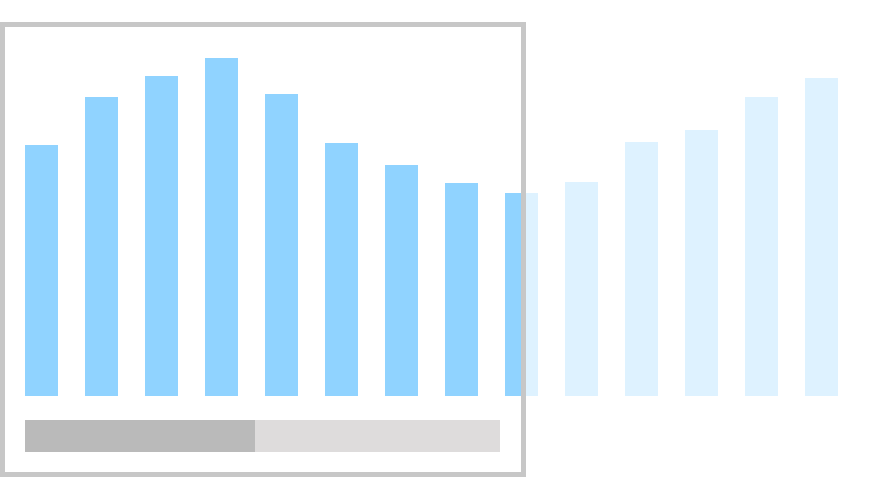
Chart with no initial range
Initial Range = Entire Dataset
Zoomable Chart
The chart is initialized to display the entire dataset, but the user can zoom in to see more details of the data points.
Non-Zoomable Chart
The chart always displays the entire overview of the dataset even when the chart is resized. The user cannot zoom the chart manually.
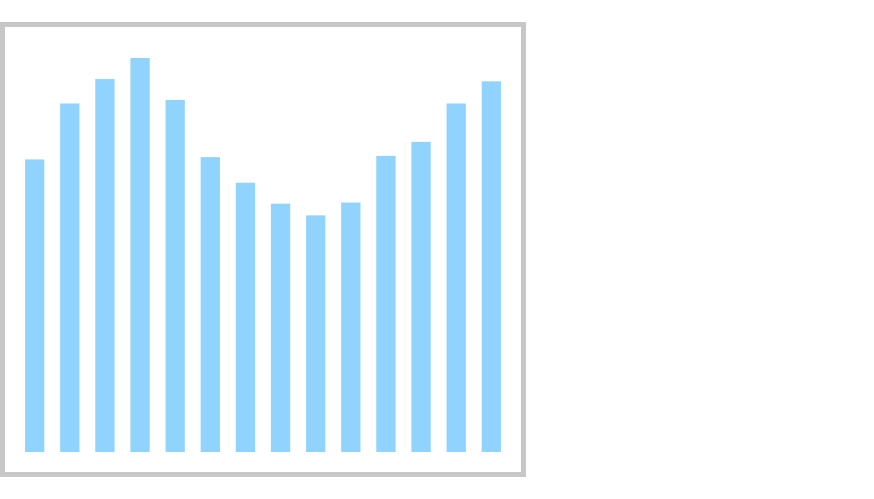
Chart with no initial range
Initial Range = Subset of Dataset
Zoomable Chart
The chart is initialized to display the defined range. A scrollbar appears.
The user can zoom in to see more details of the data points or zoom out to see an overview of the dataset.
Non-Zoomable Chart
The chart is initialized to display the range. A scrollbar appears. As the user cannot zoom, the scale cannot be changed.
You must ensure that the data points are large enough to work on a touch screen. Therefore, this setting is only recommended if you know the size of the chart container in advance.
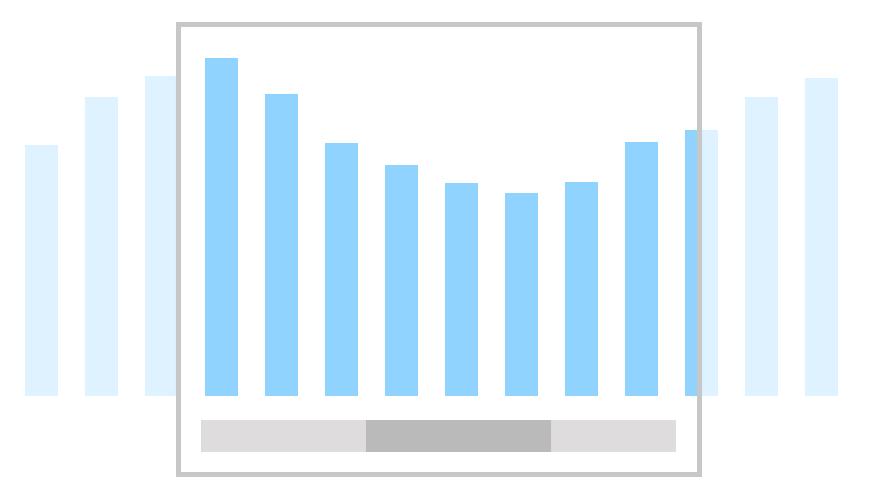
Chart with no initial range
Resources
Want to dive deeper? Follow the links below to find out more about related controls, the SAPUI5 implementation, and the visual design.
 Your feedback has been sent to the SAP Fiori design team.