
- Latest SAPUI Version 1.124
- SAPUI5 Version 1.122
- SAPUI5 Version 1.120
- SAPUI5 Version 1.118
- SAPUI5 Version 1.116
- SAPUI5 Version 1.114
- SAPUI5 Version 1.112
- SAPUI5 Version 1.110
- SAPUI5 Version 1.108
- SAPUI5 Version 1.106
- SAPUI5 Version 1.104
- SAPUI5 Version 1.102
- SAPUI5 Version 1.100
- SAPUI5 Version 1.98
- SAPUI5 Version 1.96
- SAPUI5 Version 1.94
- SAPUI5 Version 1.92
- SAPUI5 Version 1.90
- SAPUI5 Version 1.88
- SAPUI5 Version 1.86
- SAPUI5 Version 1.84
- SAPUI5 Version 1.82
- SAPUI5 Version 1.80
- SAPUI5 Version 1.78
- SAPUI5 Version 1.76
- SAPUI5 Version 1.74
- SAPUI5 Version 1.72
- SAPUI5 Version 1.70
- SAPUI5 Version 1.68
- SAPUI5 Version 1.66
- SAPUI5 Version 1.64
- SAPUI5 Version 1.62
- SAPUI5 Version 1.60
- SAPUI5 Version 1.58
- SAPUI5 Version 1.56
- SAPUI5 Version 1.54
- SAPUI5 Version 1.52
- SAPUI5 Version 1.50
- SAPUI5 Version 1.48
- SAPUI5 Version 1.46
- SAPUI5 Version 1.42
- SAPUI5 Version 1.40
- SAPUI5 Version 1.38
- SAPUI5 Version 1.36
- SAPUI5 Version 1.34
- SAPUI5 Version 1.32
- SAPUI5 Version 1.30
- SAPUI5 Version 1.28
- SAPUI5 Version 1.26
- Latest SAPUI Version 1.124
- SAPUI5 Version 1.122
- SAPUI5 Version 1.120
- SAPUI5 Version 1.118
- SAPUI5 Version 1.116
- SAPUI5 Version 1.114
- SAPUI5 Version 1.112
- SAPUI5 Version 1.110
- SAPUI5 Version 1.108
- SAPUI5 Version 1.106
- SAPUI5 Version 1.104
- SAPUI5 Version 1.102
- SAPUI5 Version 1.100
- SAPUI5 Version 1.98
- SAPUI5 Version 1.96
- SAPUI5 Version 1.94
- SAPUI5 Version 1.92
- SAPUI5 Version 1.90
- SAPUI5 Version 1.88
- SAPUI5 Version 1.86
- SAPUI5 Version 1.84
- SAPUI5 Version 1.82
- SAPUI5 Version 1.80
- SAPUI5 Version 1.78
- SAPUI5 Version 1.76
- SAPUI5 Version 1.74
- SAPUI5 Version 1.72
- SAPUI5 Version 1.70
- SAPUI5 Version 1.68
- SAPUI5 Version 1.66
- SAPUI5 Version 1.64
- SAPUI5 Version 1.62
- SAPUI5 Version 1.60
- SAPUI5 Version 1.58
- SAPUI5 Version 1.56
- SAPUI5 Version 1.54
- SAPUI5 Version 1.52
- SAPUI5 Version 1.50
- SAPUI5 Version 1.48
- SAPUI5 Version 1.46
- SAPUI5 Version 1.44
- SAPUI5 Version 1.42
- SAPUI5 Version 1.40
- SAPUI5 Version 1.38
- SAPUI5 Version 1.36
- SAPUI5 Version 1.34
- SAPUI5 Version 1.32
- SAPUI5 Version 1.30
- SAPUI5 Version 1.28
- SAPUI5 Version 1.26
Chart – Value-Based Legend
Intro
The value-based legend is used to visually represent value ranges through color shades. It is currently available for the heatmap.
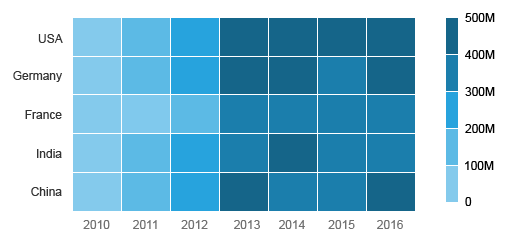
Value-based legend example on a heatmap
Layout and Responsiveness
The value-based legend is positioned by default at the right of the data plot. If the space is too small (for example, in portrait mode on a smartphone), it moves to the bottom. In this case, it is displayed in a condensed format.
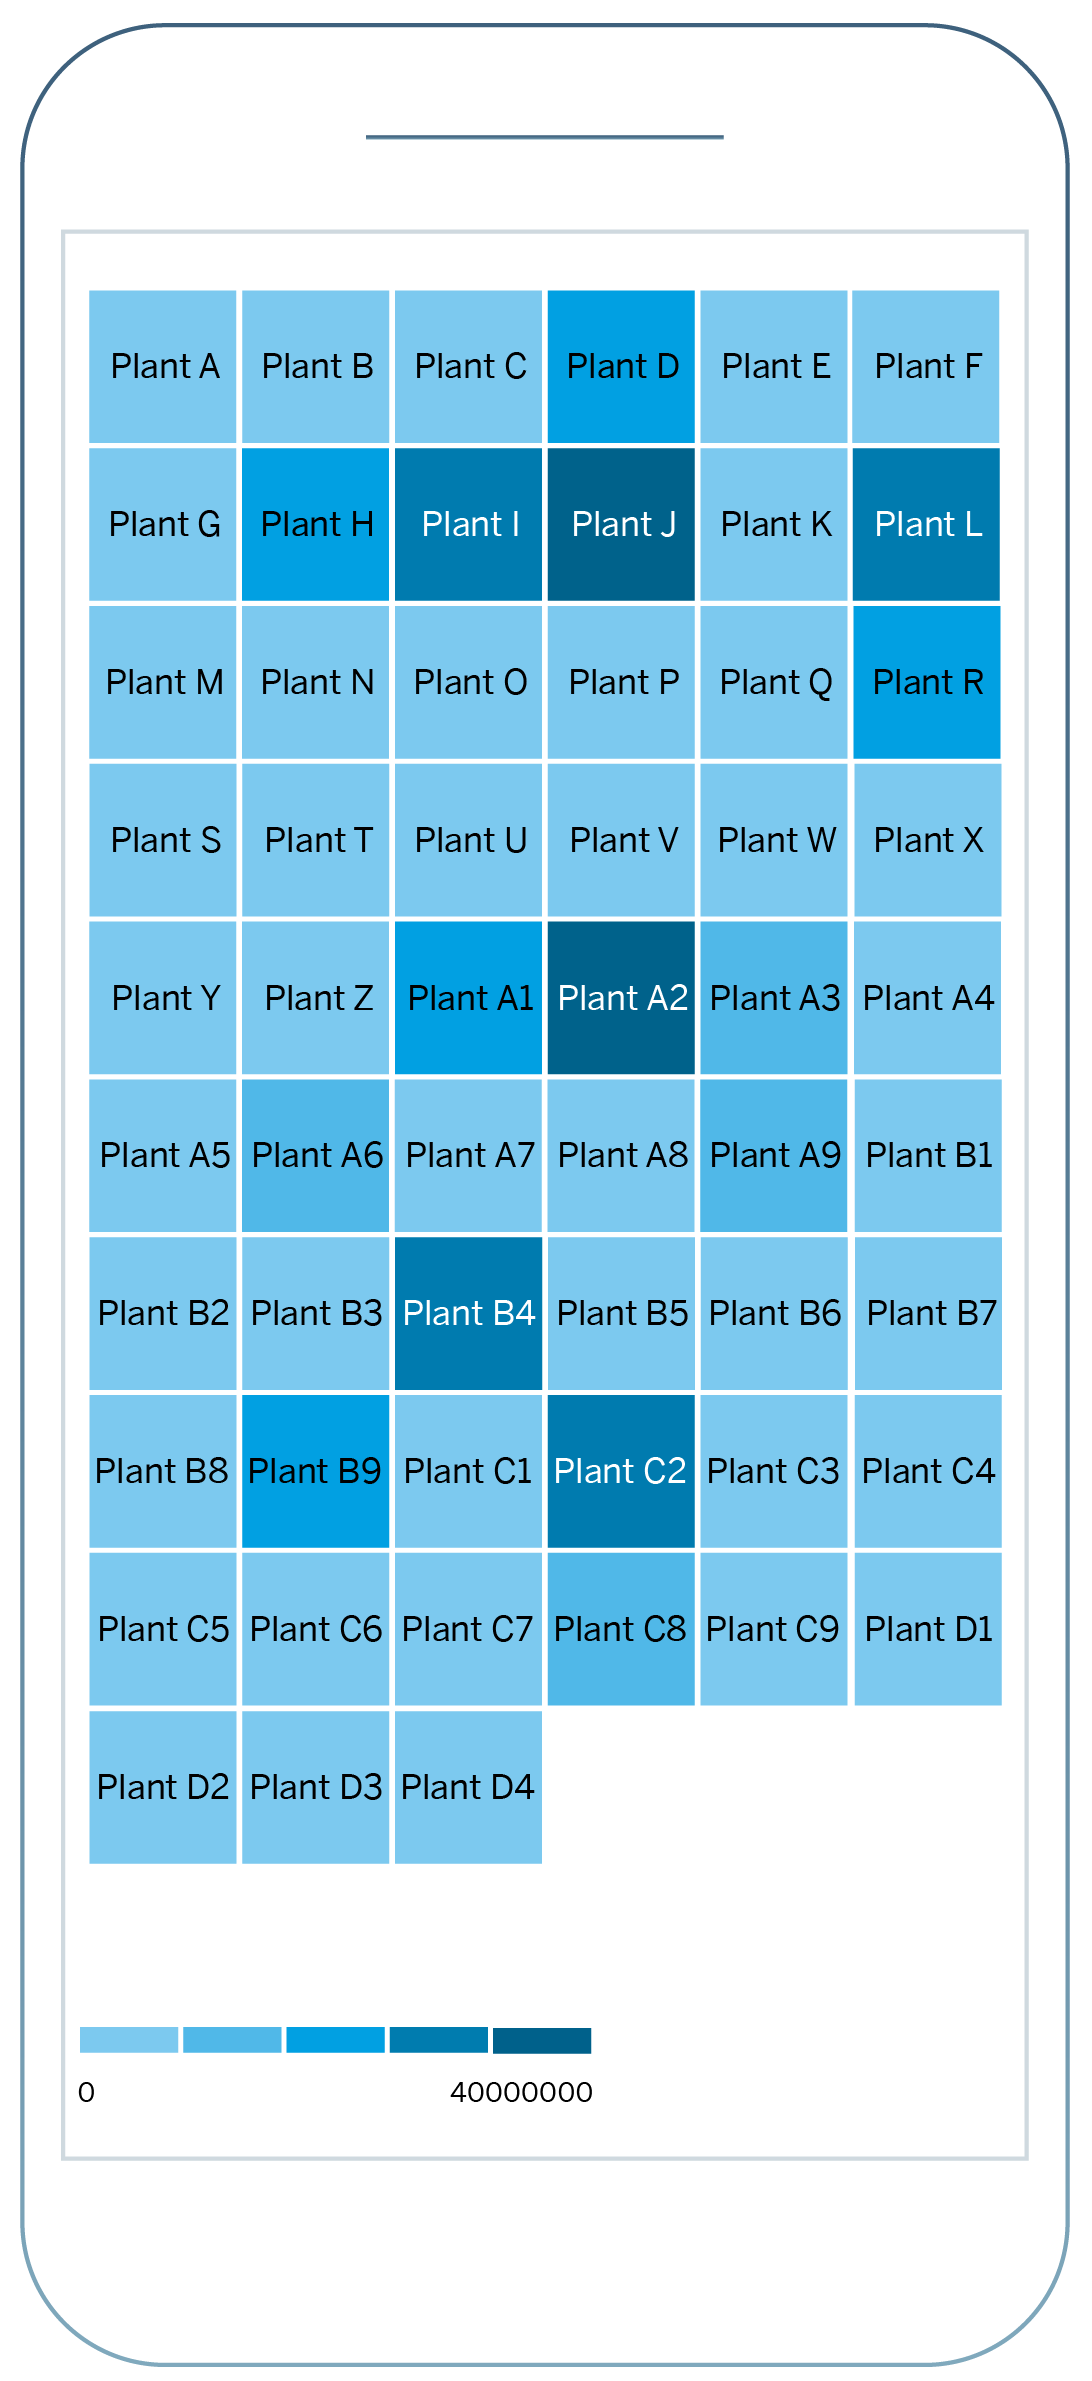
Responsiveness on a smartphone - Portrait mode
Behavior
The default value-based legend comprises five segments and uses the first hue of the sequential color palette.
Default value-based legend

Sequential palette
Customization
Number of Segments
You can change the number of segments from two to nine. The corresponding value ranges are automatically calculated and assigned to each shade. However, you need to assign the colors to the segments yourself.
Recommended Colors for the Sequential Palette
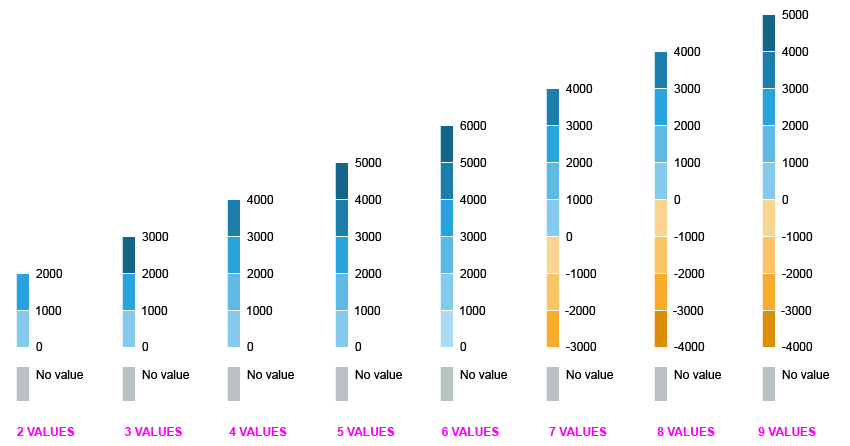
Recommended sequential value-based legend from two to nine items
| Color Name | |
| 2 values | sapUiChartPaletteSequentialHue1Light2 |
| sapUiChartPaletteSequentialHue1 | |
| 3 values | sapUiChartPaletteSequentialHue1Light2 |
| sapUiChartPaletteSequentialHue1 | |
| sapUiChartPaletteSequentialHue1Dark2 | |
| 4 values | sapUiChartPaletteSequentialHue1Light2 |
| sapUiChartPaletteSequentialHue1Light1 | |
| sapUiChartPaletteSequentialHue1 | |
| sapUiChartPaletteSequentialHue1Dark1 | |
| 5 values | sapUiChartPaletteSequentialHue1Light2 |
| sapUiChartPaletteSequentialHue1Light1 | |
| sapUiChartPaletteSequentialHue1 | |
| sapUiChartPaletteSequentialHue1Dark1 | |
| sapUiChartPaletteSequentialHue1Dark2 | |
| 6 values | sapUiChartPaletteSequentialHue1Light3 |
| sapUiChartPaletteSequentialHue1Light2 | |
| sapUiChartPaletteSequentialHue1Light1 | |
| sapUiChartPaletteSequentialHue1 | |
| sapUiChartPaletteSequentialHue1Dark1 | |
| sapUiChartPaletteSequentialHue1Dark2 | |
| 7 values | sapUiChartPaletteSequentialHue1Light2 |
| sapUiChartPaletteSequentialHue1Light1 | |
| sapUiChartPaletteSequentialHue1 | |
| sapUiChartPaletteSequentialHue1Dark1 | |
| sapUiChartPaletteSequentialHue3Light2 | |
| sapUiChartPaletteSequentialHue3Light1 | |
| sapUiChartPaletteSequentialHue3 | |
| 8 values | sapUiChartPaletteSequentialHue1Light2 |
| sapUiChartPaletteSequentialHue1Light1 | |
| sapUiChartPaletteSequentialHue1 | |
| sapUiChartPaletteSequentialHue1Dark1 | |
| sapUiChartPaletteSequentialHue3Light2 | |
| sapUiChartPaletteSequentialHue3Light1 | |
| sapUiChartPaletteSequentialHue3 | |
| sapUiChartPaletteSequentialHue3Dark1 | |
| 9 values | sapUiChartPaletteSequentialHue1Light2 |
| sapUiChartPaletteSequentialHue1Light1 | |
| sapUiChartPaletteSequentialHue1 | |
| sapUiChartPaletteSequentialHue1Dark1 | |
| sapUiChartPaletteSequentialHue1Dark2 | |
| sapUiChartPaletteSequentialHue3Light2 | |
| sapUiChartPaletteSequentialHue3Light1 | |
| sapUiChartPaletteSequentialHue3 | |
| sapUiChartPaletteSequentialHue3Dark1 |
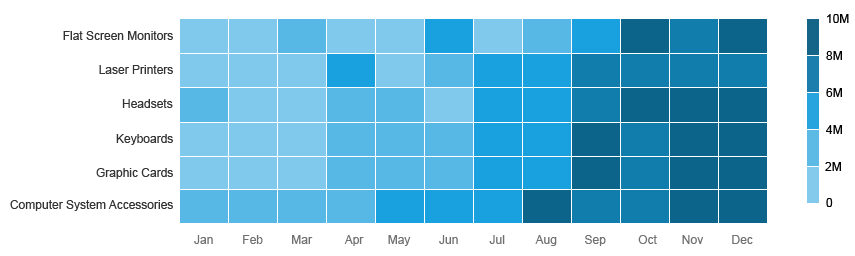
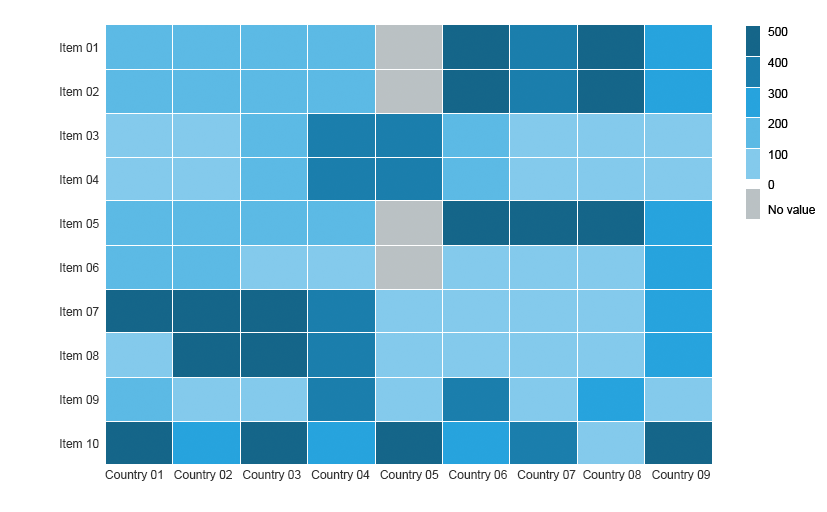
Example of a heatmap with an 5-segment sequential value-based legend
When you use the sequential color palette, you can also change the recommended hue illustrated above (still based on the SAP Fiori chart color palette). If you do so, follow this example for the choice of shades.
Recommended Colors for the Semantic Palette
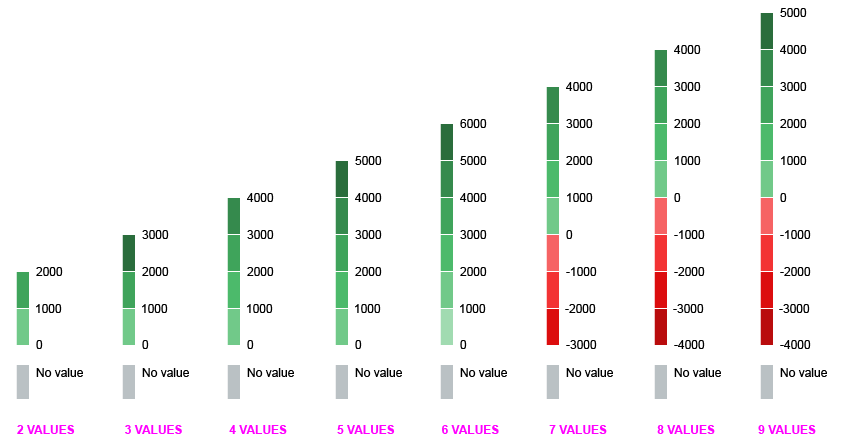
Recommended semantic value-based legend from two to nine items
| Color Name | |
| 2 values | sapUiChartPaletteSemanticGoodLight2 |
| sapUiChartPaletteSemanticGood | |
| 3 values | sapUiChartPaletteSemanticGoodLight2 |
| sapUiChartPaletteSemanticGood | |
| sapUiChartPaletteSemanticGoodDark2 | |
| 4 values | sapUiChartPaletteSemanticGoodLight2 |
| sapUiChartPaletteSemanticGood1Light1 | |
| sapUiChartPaletteSemanticGood | |
| sapUiChartPaletteSemanticGoodDark1 | |
| 5 values | sapUiChartPaletteSemanticGoodLight2 |
| sapUiChartPaletteSemanticGoodLight1 | |
| sapUiChartPaletteSemanticGood | |
| sapUiChartPaletteSemanticGoodDark1 | |
| sapUiChartPaletteSemanticGoodDark2 | |
| 6 values | sapUiChartPaletteSemanticGoodLight3 |
| sapUiChartPaletteSemanticGoodLight2 | |
| sapUiChartPaletteSemanticGoodLight1 | |
| sapUiChartPaletteSemanticGood | |
| sapUiChartPaletteSemanticGoodDark1 | |
| sapUiChartPaletteSemanticGoodDark2 | |
| 7 values | sapUiChartPaletteSemanticGoodLight2 |
| sapUiChartPaletteSemanticGoodLight1 | |
| sapUiChartPaletteSemanticGoodHue1 | |
| sapUiChartPaletteSemanticGoodDark1 | |
| sapUiChartPaletteSemanticBadLight2 | |
| sapUiChartPaletteSemanticBadLight1 | |
| sapUiChartPaletteSemanticBad | |
| 8 values | sapUiChartPaletteSemanticGoodLight2 |
| sapUiChartPaletteSemanticGoodLight1 | |
| sapUiChartPaletteSemanticGood | |
| sapUiChartPaletteSemanticGoodDark1 | |
| sapUiChartPaletteSemanticBadLight2 | |
| sapUiChartPaletteSemanticBadLight1 | |
| sapUiChartPaletteSemanticBad | |
| sapUiChartPaletteSemanticBadDark1 | |
| 9 values | sapUiChartPaletteSemanticGoodLight2 |
| sapUiChartPaletteSemanticGoodLight1 | |
| sapUiChartPaletteSemanticGood | |
| sapUiChartPaletteSemanticGoodDark1 | |
| sapUiChartPaletteSemanticGoodDark2 | |
| sapUiChartPaletteSemanticBadLight2 | |
| sapUiChartPaletteSemanticBadLight1 | |
| sapUiChartPaletteSemanticBad | |
| sapUiChartPaletteSemanticBadDark1 |
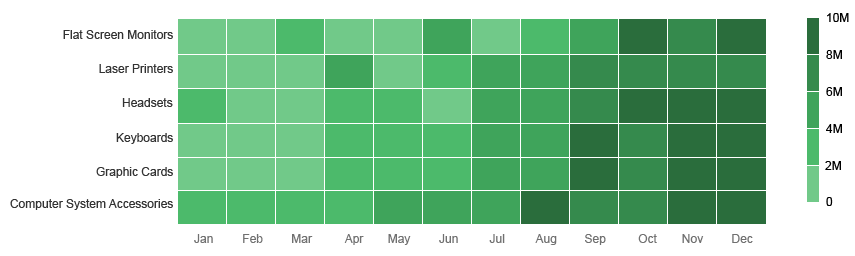
Example of a heatmap with an 5-segment semantic value-based legend
Range
Finally, you can manually set the range for each segment. Note that for a given segment number, “segment number + 1” values are needed (example: [0,8,9,10,11,20] for five segments).
If the overall range being defined is different from the real data range, the “>” and “<” signs are displayed on the legend.
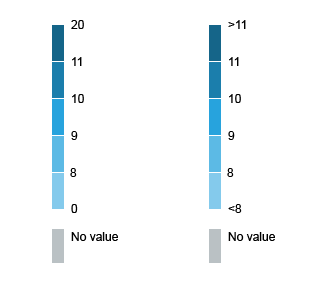
Example 1: If all data is between 0 and 20. Example 2: If there is data larger than 20 and smaller than 0.
Resources
Want to dive deeper? Follow the links below to find out more about related controls, the SAPUI5 implementation, and the visual design.
 Your feedback has been sent to the SAP Fiori design team.