
- Latest SAPUI Version 1.124
- SAPUI5 Version 1.122
- SAPUI5 Version 1.120
- SAPUI5 Version 1.118
- SAPUI5 Version 1.116
- SAPUI5 Version 1.114
- SAPUI5 Version 1.112
- SAPUI5 Version 1.110
- SAPUI5 Version 1.108
- SAPUI5 Version 1.104
- SAPUI5 Version 1.102
- SAPUI5 Version 1.100
- SAPUI5 Version 1.98
- SAPUI5 Version 1.96
- SAPUI5 Version 1.94
- SAPUI5 Version 1.92
- SAPUI5 Version 1.90
- SAPUI5 Version 1.88
- SAPUI5 Version 1.86
- SAPUI5 Version 1.84
- SAPUI5 Version 1.82
- SAPUI5 Version 1.80
- SAPUI5 Version 1.78
- SAPUI5 Version 1.76
- SAPUI5 Version 1.74
- SAPUI5 Version 1.72
- SAPUI5 Version 1.70
- SAPUI5 Version 1.68
- SAPUI5 Version 1.66
- SAPUI5 Version 1.64
- SAPUI5 Version 1.62
- SAPUI5 Version 1.60
- SAPUI5 Version 1.58
- SAPUI5 Version 1.56
- SAPUI5 Version 1.54
- SAPUI5 Version 1.52
- SAPUI5 Version 1.50
- SAPUI5 Version 1.48
- SAPUI5 Version 1.46
- SAPUI5 Version 1.44
- SAPUI5 Version 1.42
- SAPUI5 Version 1.40
- SAPUI5 Version 1.38
- SAPUI5 Version 1.36
- SAPUI5 Version 1.34
- SAPUI5 Version 1.32
- SAPUI5 Version 1.30
- SAPUI5 Version 1.28
- SAPUI5 Version 1.26
- Latest SAPUI Version 1.124
- SAPUI5 Version 1.122
- SAPUI5 Version 1.120
- SAPUI5 Version 1.118
- SAPUI5 Version 1.116
- SAPUI5 Version 1.114
- SAPUI5 Version 1.112
- SAPUI5 Version 1.110
- SAPUI5 Version 1.108
- SAPUI5 Version 1.106
- SAPUI5 Version 1.104
- SAPUI5 Version 1.102
- SAPUI5 Version 1.100
- SAPUI5 Version 1.98
- SAPUI5 Version 1.96
- SAPUI5 Version 1.94
- SAPUI5 Version 1.92
- SAPUI5 Version 1.90
- SAPUI5 Version 1.88
- SAPUI5 Version 1.86
- SAPUI5 Version 1.84
- SAPUI5 Version 1.82
- SAPUI5 Version 1.80
- SAPUI5 Version 1.78
- SAPUI5 Version 1.76
- SAPUI5 Version 1.74
- SAPUI5 Version 1.72
- SAPUI5 Version 1.70
- SAPUI5 Version 1.68
- SAPUI5 Version 1.66
- SAPUI5 Version 1.64
- SAPUI5 Version 1.62
- SAPUI5 Version 1.60
- SAPUI5 Version 1.58
- SAPUI5 Version 1.56
- SAPUI5 Version 1.54
- SAPUI5 Version 1.52
- SAPUI5 Version 1.50
- SAPUI5 Version 1.48
- SAPUI5 Version 1.46
- SAPUI5 Version 1.44
- SAPUI5 Version 1.42
- SAPUI5 Version 1.40
- SAPUI5 Version 1.38
- SAPUI5 Version 1.36
- SAPUI5 Version 1.34
- SAPUI5 Version 1.32
- SAPUI5 Version 1.30
- SAPUI5 Version 1.28
- SAPUI5 Version 1.26
Treemap Chart
Intro
Treemaps are used to display hierarchical data. The information is displayed as a cluster of rectangles varying in size and color, depending on their data value. The size of each rectangle represents a quantity, while the color can represent a number value or a category. Treemaps are economical in that they can be used within a limited space and yet display a large number of items simultaneously. Treemaps allow you to view trends and make comparisons quickly.
Treemap chart
Usage
Treemaps are one of the most compact and space-efficient options for displaying hierarchies and are also great for comparing the proportions between categories via their size. When there is a correlation between color and size in the tree structure, the user is able to see patterns that would be difficult to spot in other charts.
Use the treemap if:
- Space is limited and you want to give users an overview of a large amount of hierarchical data.
- You cannot use conventional graphs, such as bar charts, because there are too many items to represent as bars in a single graph or in a series of graphs on one screen.
- You want to offer a quick, high level summary of the similarities and anomalies within one category, as well as between multiple categories.
- You want to enable part-to-whole comparisons.
- You want to enable rough comparisons between top-level categories, as well as comparisons within categories at a lower level.
Do not use the treemap if:
- You want to enable precise quantitative comparisons. In this case, use the bar chart instead.
- The dataset contains only a small number of categories. In this case, we recommend using the bar chart.
- There is a big difference in the magnitude of the measure values.
- You would like to display negative values. They cannot be displayed in treemaps.
Responsiveness
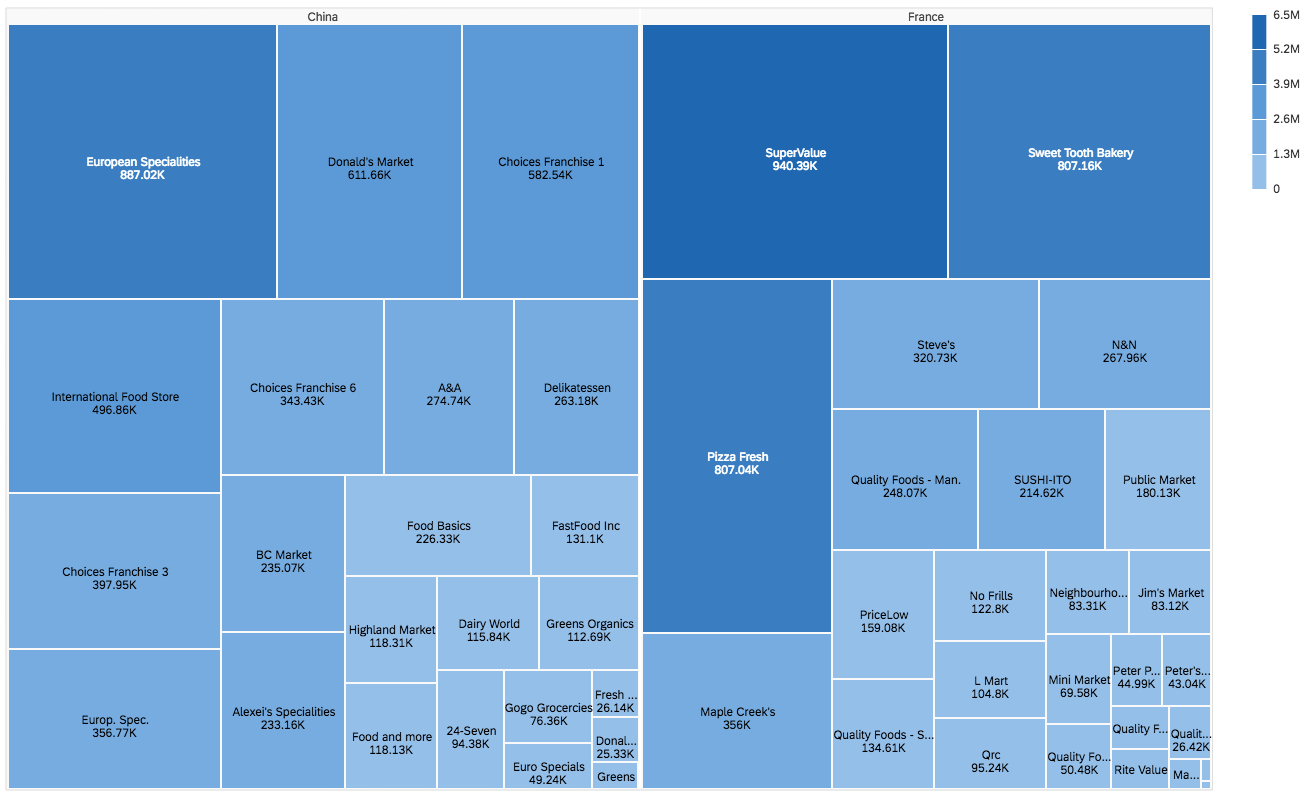
The treemap chart is fully responsive. When the size of the screen gets smaller, the labels start to truncate and hide if there is not enough space.
Treemap chart - Size L
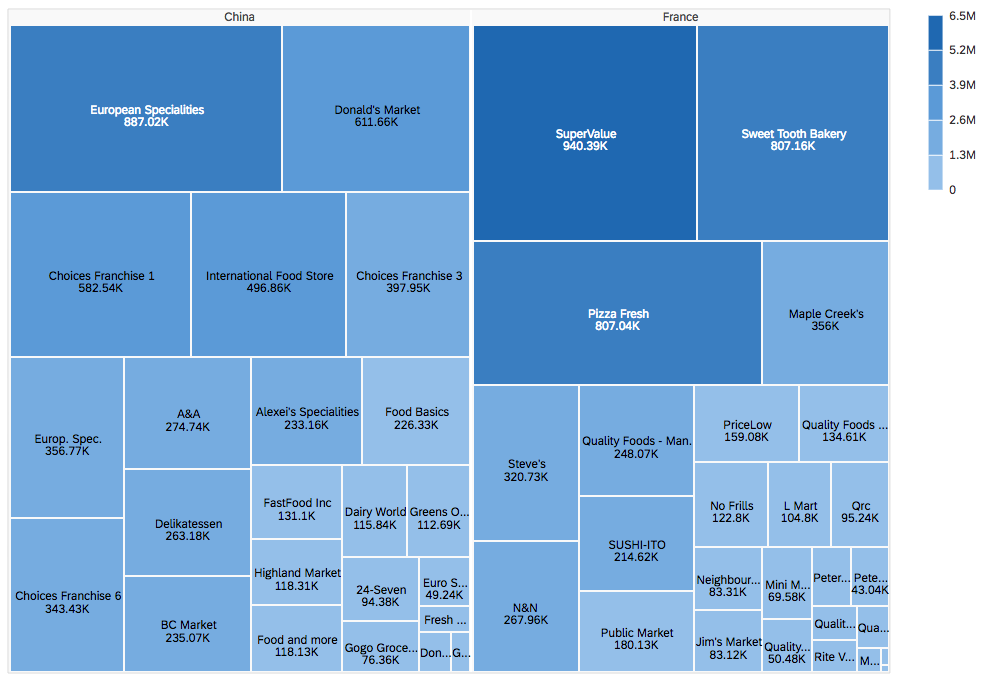
Treemap chart - Size M
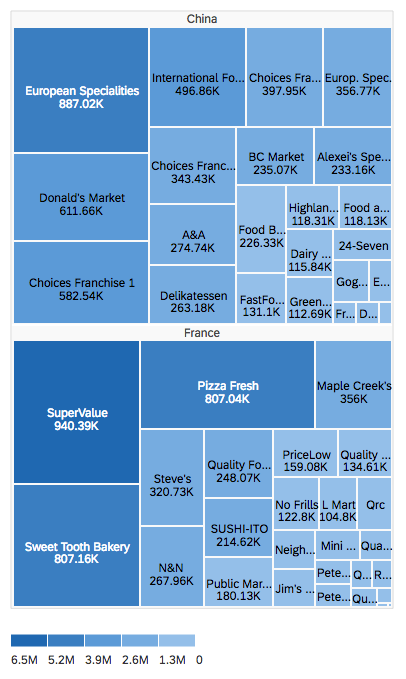
Treemap chart - Size S
Color Palette
The treemap chart supports sequential and semantic color palettes.
- Use the sequential palette to visualize high-to-low values using six shades for up to three measures.
- Use the semantic palette to show good, bad, and critical values.
Legend
The treemap chart supports both the legend and value-based legend.
- Use the legend if you are using semantic colors.
- Use the value-based legend if you are using the sequential color palette.
Drilldown
You can let users drill down through the hierarchical data. This is done by selecting a rectangle and pressing the Drill Down button in the chart toolbar.
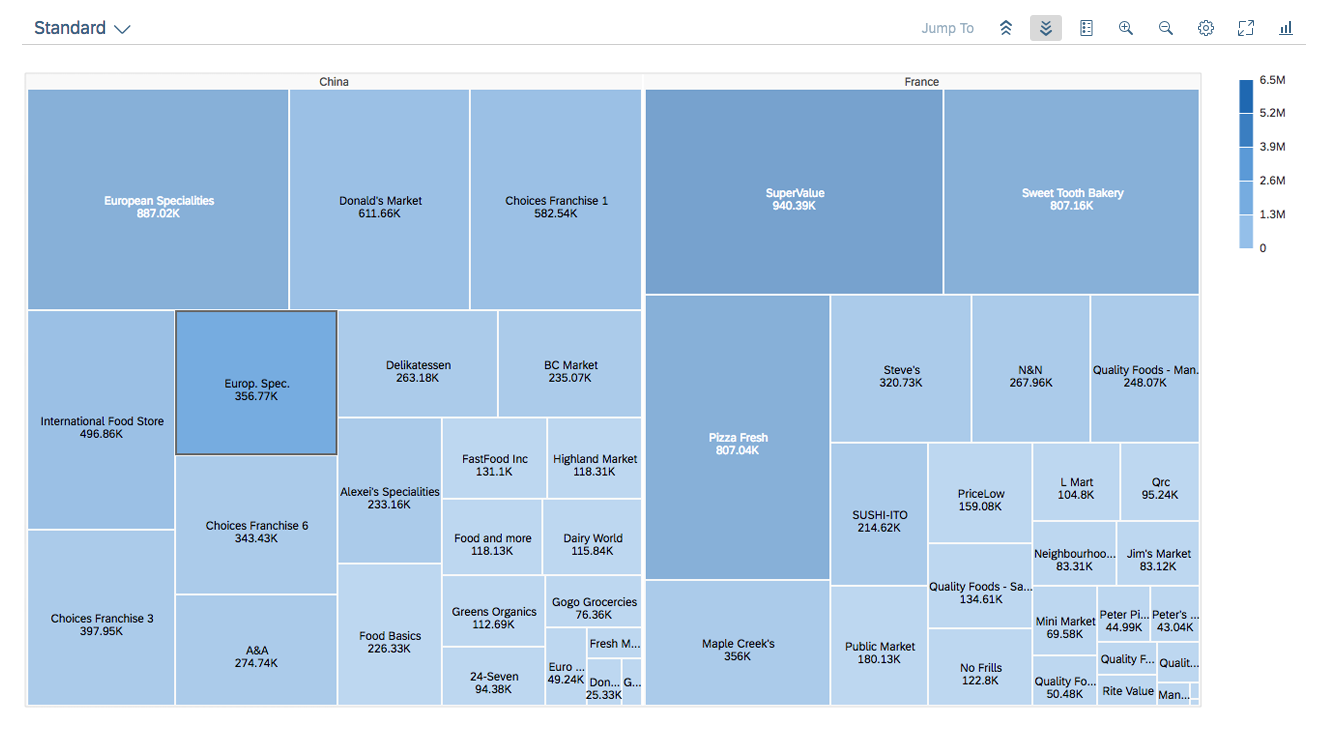
Drilldown in a treemap chart
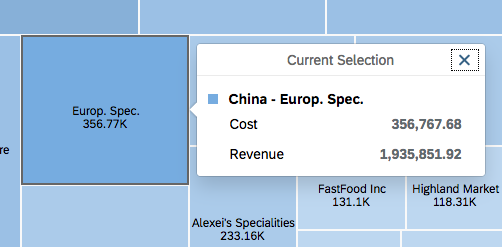
Selection and Popover
When the user clicks on a rectangle, all the associated values are displayed in a popover. You can also customize the popover to display other information and actions.
Resources
Want to dive deeper? Follow the links below to find out more about related controls, the SAPUI5 implementation, and the visual design.
Elements and Controls
- Chart – Color Palettes (guidelines)
- Legend (guidelines)
- Value-Based Legend (guidelines)
- Popover (guidelines)
 Your feedback has been sent to the SAP Fiori design team.