Form Field Validation

This article describes data validation for fields in SAP Fiori apps. This includes information about the validation points and the choreography associated with messaging.

For more information on the messaging concept for SAP Fiori apps, see the article on message handling.

Information
For S/4HANA applications, use the On Enter and On Save or Create validation choreography. See the design decision.

Behavior and Interaction

The message popover is only used to display field-related messages.

Validation Choreography

Focus Out

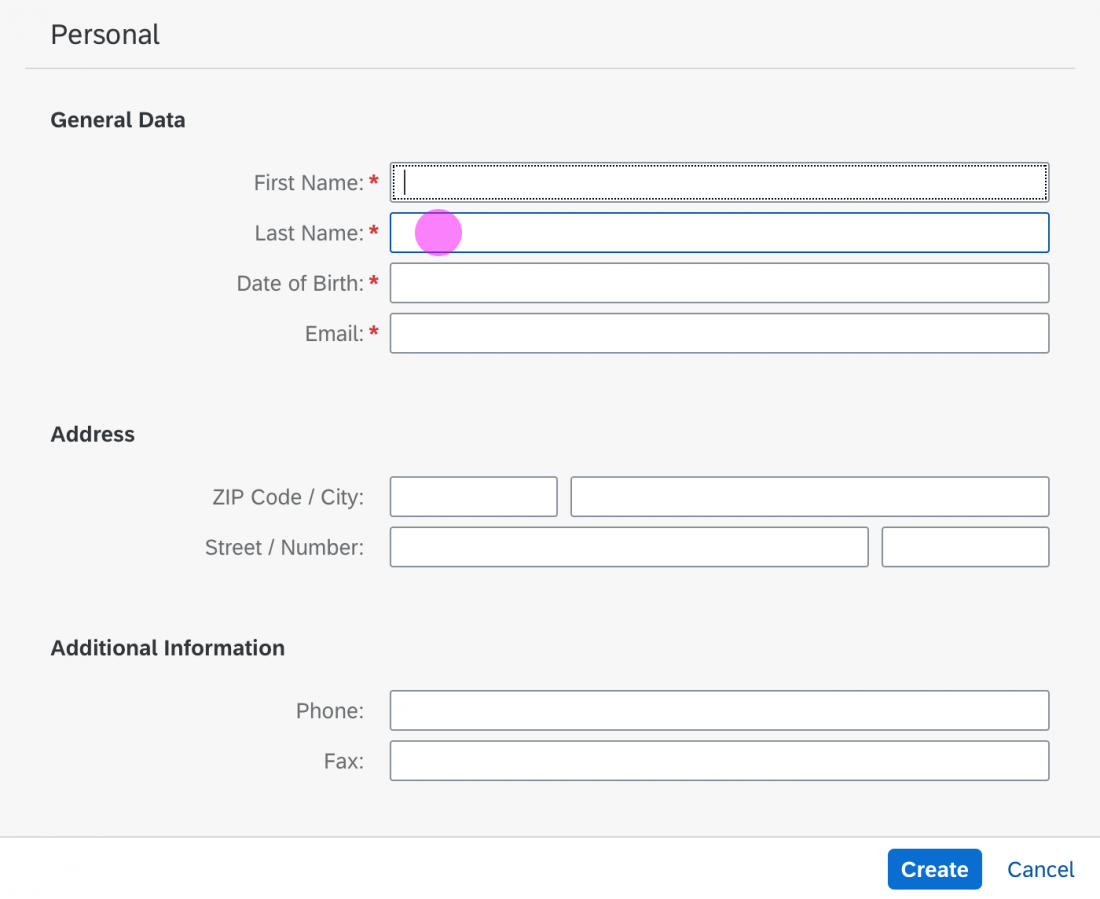
  • Validation occurs when the value in the input field has changed and the focus leaves the field.
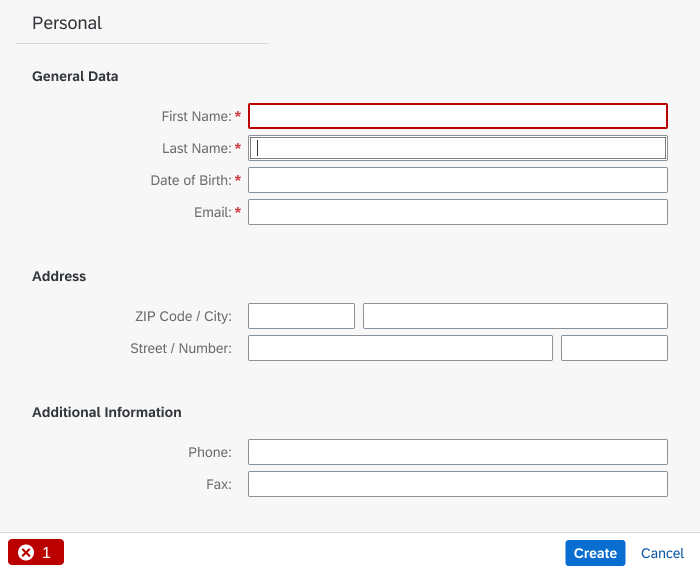
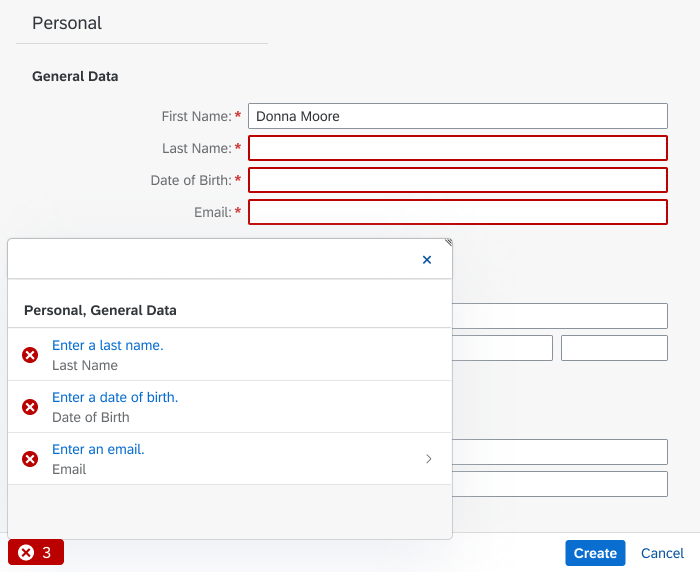
  • The mandatory fields get value states.
  • A message button appears in the toolbar (semantic button, icon: alert, counter).
  • If the message popover is open and already contains one or more messages, the list is updated.
Warning
Focusing out of a field or switching from one field to another manually or using the “Tab” key doesn’t validate the entire form. It only validates the field that was previously in focus.
Form
Form
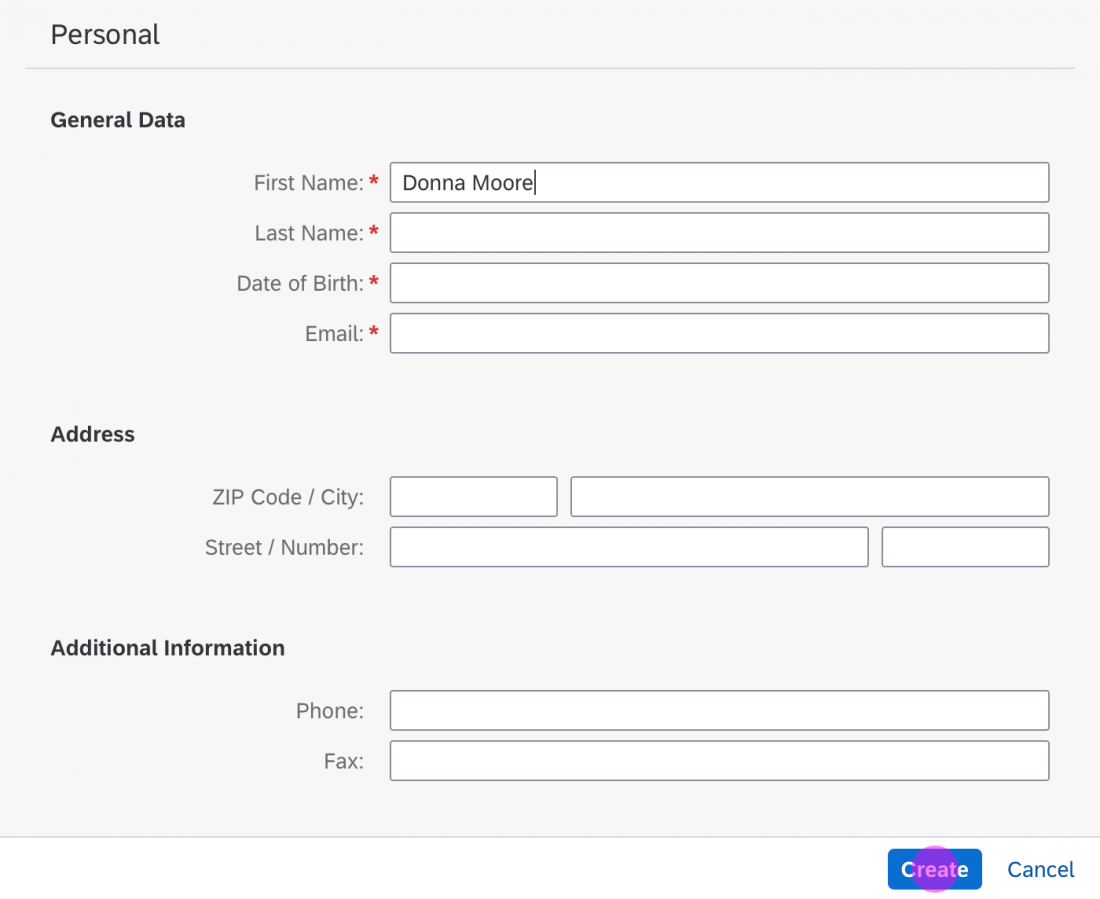
Form with field validation

When to Use

Do

Use the “focus out” validation when a draft has few fields to validate.

Don't

Don’t use the “focus out” validation when:

  • A draft has many fields to validate.
  • Users want to enter data quickly, uninterrupted by repeated validation.
  • They navigate with the keyboard for faster data entry.
  • They regularly enter data in a draft for some, but not all fields.

On “Enter”

L / XL Screens

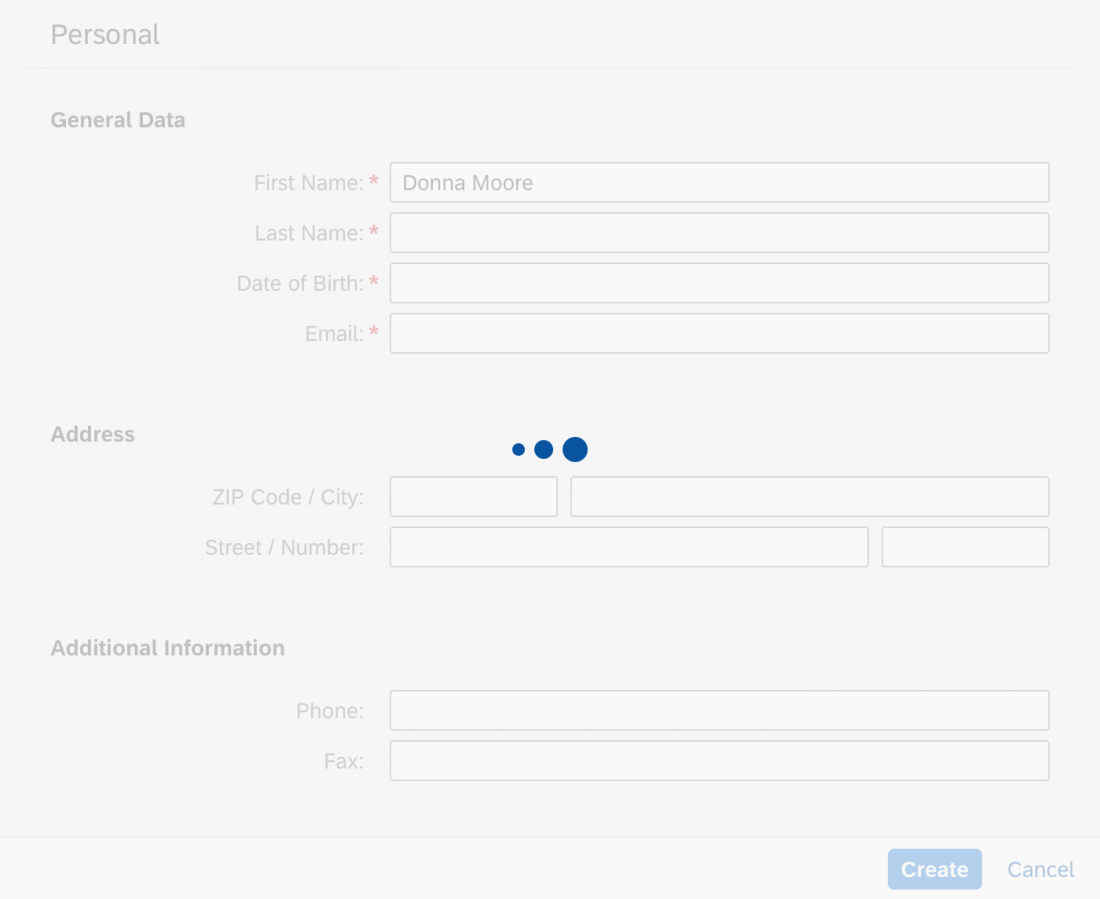
  • The entire form is validated, or the whole object including all the forms it contains.
  • If the user selects a value by pressing Enter, the value is selected without triggering validation (for example, when adopting a suggestion or entering a value in a combo box). The user must then press Enter a second time to trigger the full form validation process.
  • Any errors or warnings are displayed in a message popover.

S / M Screens

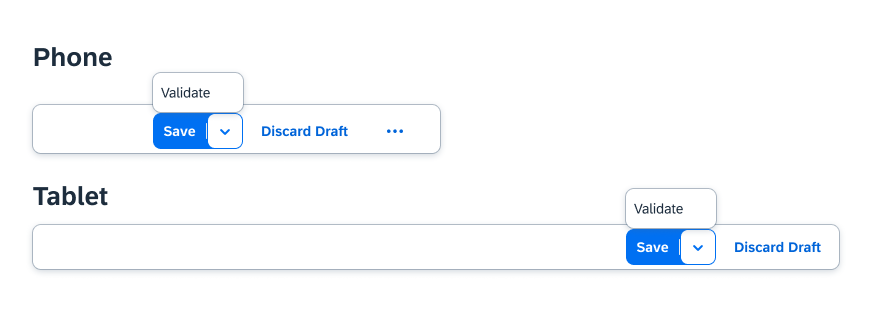
  • On phones and tablet devices, there is no Enter shortcut. Instead, a Validate button is available in the footer. The Validate button is combined with Save in a split menu button.
Loading animation on enter
'Save' / 'Validate' split menu button
Validation completed

When to Use

Do

Use the “on Enter” validation (or the Validate button on a phone or tablet device) when:

  • The object should stay in draft mode until the final Save or Create action.
  • A draft has many fields to validate.
  • Users want to control when the validation happens.

On “Create” or “Save”

  • The entire form is validated.
  • A message popover displays any errors or warnings.
Form with at least one input
Validation completed
Do

Always use this option, even if you use “focus out” or “on Enter” validation.

Don't

Don’t use the “on Create or Save” validation as the only validation option.

Validation

  • Highlight the specific field and include a useful message.
  • Display a button on the left side of the footer toolbar.
  • The button displays the sap.m.MessagePopover. For more information, see message popover.
  • If the issues have been resolved, and the user is able to proceed, remove the corresponding messages.
Useful message in value state

Connected Fields

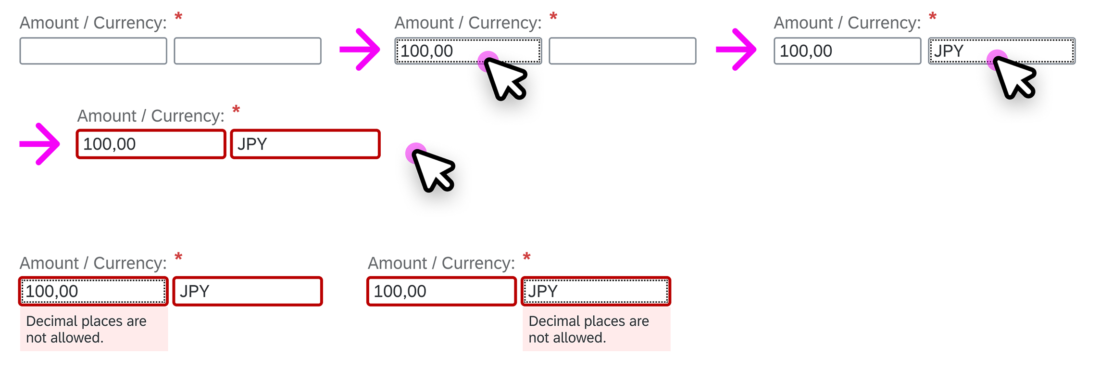
Some fields are connected because the coherence of their values depend on each other. At the time of validation, one or several of those connected fields are highlighted according to the case. In every case, the value state message is the same for every field.

Some examples of connected fields are: value/unit of measure, price/currency, or zip-code/city.

Empty Fields

If the entered values are incoherent, all connected fields get the value state after the focus has left the connected fields.

Connected fields - Form starting with empty fields

Mandatory Fields

If the focus has left the connected fields, only the missing field gets the error state.

If the connected fields are not mandatory, validation occurs only when both fields contain data.

Connected mandatory fields

Read Only

Read-only fields don’t get value states.

Connected Fields With Read-Only States

Error Prevention

Help the user to avoid errors by using input types (sap.m.InputTypes) and mask input (sap.m.MaskInput). The input fields automatically get a specific format, which helps prevent the user from making invalid entries.

Always start with the least complex control (for example, use select instead of value help if the user needs to select only one item from a short list). Only use more intricate controls if the use case really requires it.

Guidelines

Depending on the floorplan, certain validation guidelines need to be applied.

Global Edit Flow

This floorplan is significant in that the actions are only displayed in the footer toolbar on the main page of the object. The subpages do not provide action buttons. Therefore, the message popover includes all messages for the whole object (the main object page and all subpages).

The validation can be triggered by the following:

  • Focus Out: Current field, or current field and dependent fields.
  • On Enter: The form with the latest focus and possible dependent fields in other sections on a page
  • Action Button: Complete object validation including subpages.
Information
Messages that occur on subpages should include the name of the line item so that the user at least knows where to find the field to resolve the issue.

For more information, see Complex Objects – Global Flow.

Partial Editing

When the user clicks Save, the whole form remains in a busy state until the action has been completed:

  • If there are no messages: switch to display mode.
  • If there are messages that relate to a field: highlight the respective field with its value state and do not use the message popover. 
  • If there are messages that do not relate to a field, show a dialog with the message(s).

For more information, see Partial Edit.

Message Popover Control

Do not show the message button and message popover:

  • In a popover
  • In a partial editing area. If you offer partial editing, never show a message popover for the part of the screen being edited. The message popover always belongs to the footer toolbar for the whole page.

Instead, just highlight the fields that contain errors to make it easier for the user to understand the issue(s).
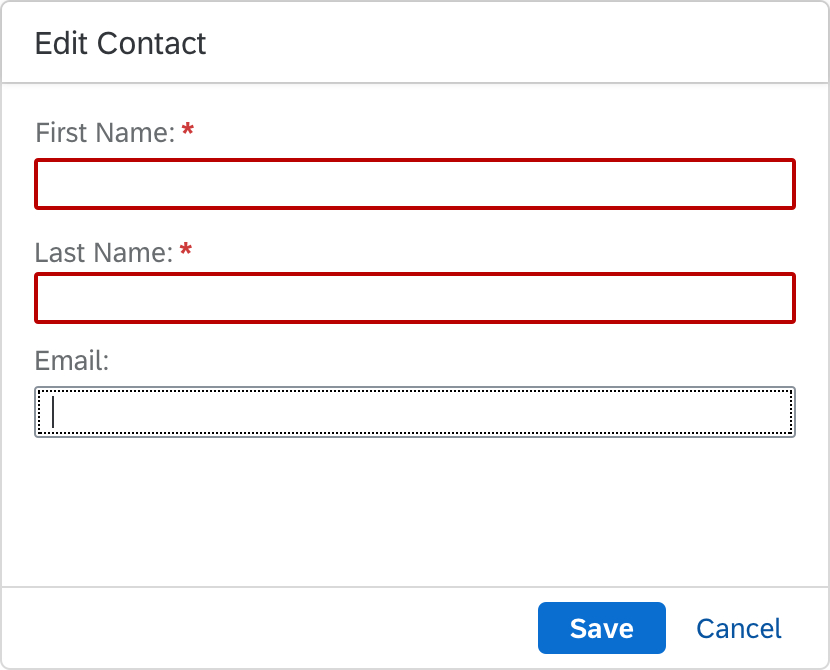
Highlighted form fields in a dialog

Resources

Want to dive deeper? Follow the links below to find out more about related controls, the SAPUI5 implementation, and the visual design.

Elements and Controls

Implementation

  • No Links.
Map

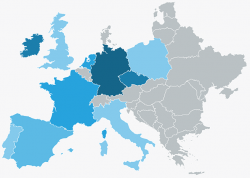
Maps are used to visualize data in an easy and intuitive way. A map is a symbolic visual illustration of areas, regions, and themes. SAP Visual Business supports analytic maps and geographic maps.

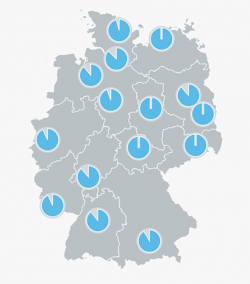
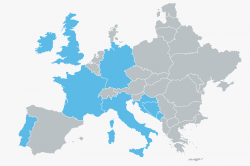
The analytic map shows regions such as continents or countries. Another term for this kind of map is a choropleth map.

In the context of a business application, the analytic map is useful for displaying quantitative or qualitative data by coloring various regions.

The analytic map is the best choice if you want to visualize region-specific values, such as for visualizing the sales revenue for different countries.

Analytic map
Analytic map

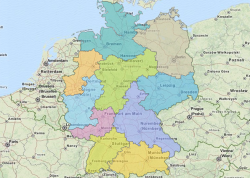
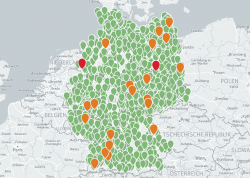
The geomap displays geographic elements like roads, cities, forests, and other details and is mostly used for navigation. In the context of a business application, a geomap is useful for displaying points of interest, area objects, or other charts over the map.

The geomap is the best choice if you have location-based data, and you want to show a road map, satellite map, or another specialist map in the background. For example, a geomap is good for visualizing the revenue of stores.

Geomap
Geomap

In addition to the analytic map and geomap control, the SAP UI5 map container control provides you with a toolbar on top of the map. It also enables you to switch between maps and charts, includes personalization, provides a full screen mode, and enables you to include a list panel stack for displaying content on top of the map.

Components

A map can include any of the following elements:

  • Toolbar (optional)
  • Navigation tools:
    • Legend (optional)
    • Navigation control (optional) and scale (optional)
  • Symbols for improved visualization of use cases:
    • Spots (optional)
    • Labels (optional)
    • Circles/geocircles (optional)
    • Areas (optional)
    • Routes (optional)
    • Container (optional) – here an arbitrary SAPUI5 control or chart can be shown on a map

Toolbar

If you need a toolbar, use the SAP UI5 map container control.

Navigation Tools

Legend

A panel containing a legend is displayed and expanded by default. You can collapse, expand, hide, or move the legend anywhere on the map if necessary.

The legend can be used interactively, in which case you have to enable the legend click event, which is provided by the control.

Legend
Legend

Navigation Control and Scale

Use the navigation control only if you do not use the chart container toolbar.

The navigation control is responsive and adapts to mobile and desktop devices. For mobile devices, the zoom function is visualized by using “+” and “”, while an extended navigation tool is used for the desktop version.

The scale of a geomap is shown by default, although for analytic map it is not.

Desktop navigation
Desktop navigation
Navigation for mobile devices

Symbols for Improved Visualization of Use Cases

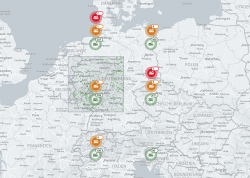
Spots

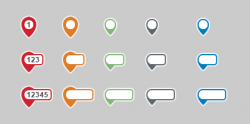
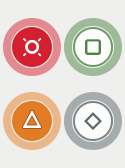
You can use spots to visualize specific locations on the map. There are five different types of spots: the default blue spot without any semantic value and the four semantic spots with icons. Adding numbers or text to a spot will replace an existing icon on the spot.

If you want to use a number with more than one digit, or text with up to five characters, you can use the relevant predefined spots that are provided. Spots are available for numbers containing up to one, three, and five digits. For text, spots are available for up to five characters (in all five colors). Use the label for numbers or text that exceed these limits. Ensure that numbers and texts on spots are not translated; if this is necessary, use labels.

Default spot
Default spot
Spots with default icons
Spots with numbers or text

Labels

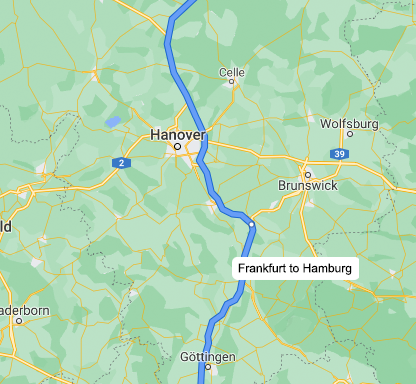
You can use a label to provide more information about a symbol. The label supports multiple lines and should be equally aligned for a group of symbols; for example, use the same alignment for all labels of spots.

For routes, the position of the label adapts to the map section. In other words, the label moves on the route so you can always see it at any zoom level. If a label is not sufficient, we recommend you use a container with the appropriate SAPUI5 control.

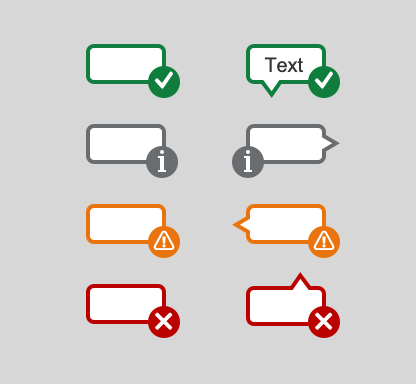
The label is available in five different colors: the default (neutral) white label and the semantic labels. The label adapts to the number of digits, and the content of the labels is translated if necessary.

In cases where a spot is insufficient, for example, if you want to include content that needs to be translated or that exceeds five characters, you can use a label instead of a spot. The label is available in four semantic colors, with or without anchors. It can be used as a standalone without any other symbols, like spots or routes.

Default label on a route
Standalone labels with semantic colors, with and without anchors

Circles/Geocircles

You can use circles to visualize specific, quantitative parameters, while geocircles can be used to visualize specific sizes or measures. The difference between circles and geocircles is as follows:

  • Circles: Radius is given in pixels – constant screen size.
  • Geocircles: Radius is given in meters – constant size in reality.

A use case for circles on a map might be to show the size of the biggest towns in a region or the revenue of a company per production location.

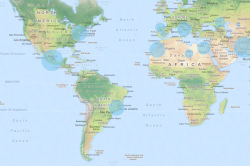
Analytic map displaying two parameters
Geomap with circles
Geomap with circles

Areas

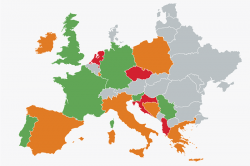
You can visualize personalized areas. This can be used, for example, for visualizing regions such as countries or zip code zones.

Analytic map with areas (based on regions)
Geomap with areas
Geomap with areas

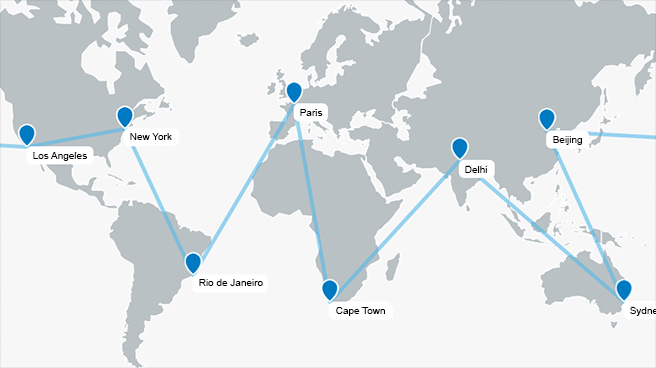
Routes

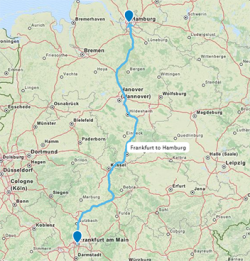
Routes can be displayed on maps with varying levels of detail, such as a map of the world or a local/national map depicting transport networks. For both levels of detail, app developers can adjust the following properties:
  • Dot width: The default dot width for a route is zero, which results in a solid line. You can adjust the dot width to enable dotted or dashed lines, or a combination of dots and dashes.
  • Route width: App developers can choose an appropriate route width. We recommend a route width of 3 px.
  • Color: We recommend that you use the SAP Fiori chart colors.
  • Arrow head: The route does not have an arrow head by default. You can enable an arrow head for the start and end points by changing the start or end property to 1.
  • Direction indicator (only if arrow heads are enabled): The direction indicator is not set by default. If the direction of a route should always be visible, you can use the direction indicator, which displays additional arrows/triangles on the route as soon as the start or end point arrows are outside the visible area. In addition to the direction indicator, we recommend that you also use a white borderline.
  • Borderline: No borderline is set by default. For accessibility reasons, we recommend that you only use a borderline to make a route more visible on the map.
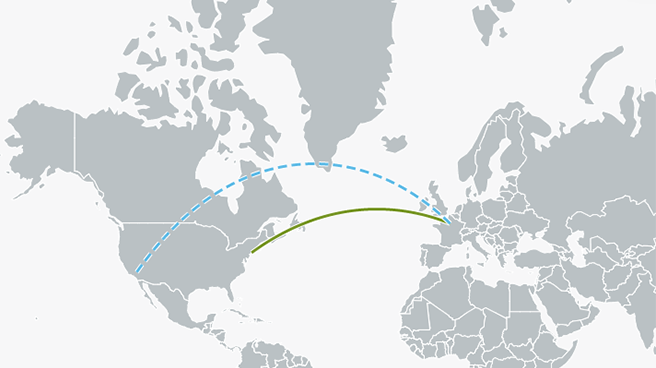
  • Curved route: Routes are displayed as straight by default. You can change them from straight to curved to display flight routes or bidirectional routes.

For accessibility reasons, we recommend that you use not only color, but also dot width for differentiation purposes. For example, use a solid line for planned routes and a dashed line for unplanned routes.

Analytic map with route
Analytic map with flight routes
Geomap with route
Geomap with route

Container

You can use containers to display an arbitrary SAPUI5 control on the map. The map control only provides the container. The default container is transparent without a border. The app team can personalize the container (in terms of fill, border, and size) and add an arbitrary SAPUI5 control.

Analytic map with container containing another SAPUI5 control

Behavior and Interaction

Zoom

There are four ways of performing a zoom:

  • Navigation tool: use the navigation controls to zoom in and out.
  • Mouse wheel: use the mouse wheel to zoom in and out.
  • Gesture: on a touchscreen, use the ‘pinch and spread’ gestures.
  • Keyboard: use the ‘+’ and ‘-‘ keys to zoom in and out, or use the ‘Z’ key to use the rectangular zoom.

Thumbnail Mode (Minimized Map Control)

The map control can be minimized to a thumbnail, which can be used for tiles on the SAP Fiori launchpad or for the object page. Note that the thumbnail is a full-scale VBI control. If you use data binding, the thumbnail is updated automatically.

The app development team can specify the size of the thumbnail.

In the minimized state, only the thumbnail click event is available; all other mouse, keyboard, and touch events are disabled.

Clustering

To avoid cluttered screens with too many objects on the map, you can use one of three cluster algorithms:

  • Grid clustering: Visual objects are clustered based on a grid. You can have multiple grid-based clusters. The visualization object is placed in the center of the grid cell with a specified offset.
  • Tree clustering: Complex clustering based on Voronoi diagrams. The clustering itself is based on the areas in the Voronoi diagram, and cluster objects are aggregated to a hierarchy over several levels of detail.
  • Distance clustering: Visual objects are clustered based on the visible distance between them. Objects are aggregated to a cluster object as long as they are within a specified range from the start object. The start object of a cluster is not specifically defined; only the nearest object that does not belong to a cluster is taken. The visualization objects are placed in the center of gravity of the covered objects. Thus the actual distance between them may vary. This type of clustering is fast, but the results may not be very convincing.

The control for visualizing clusters provides cluster icons in the four semantic colors (four types). If no type or text has been set, the default neutral, gray cluster is used. App developers can personalize the icons provided as follows:

  • Change color
  • Change icon
  • Add text
  • Replace the cluster icons provided with their own
Default cluster
Default cluster
Cluster icons provided (four types; without text)
Unclustered spots
Unclustered spots
Example: distance clustering with personalized semantic cluster icons
Example: grid clustering with personalized semantic cluster icons

Select

You can choose different selection modes: single selection to select a single item, and rectangular or lasso selection to select multiple items. You can also use the Shift key to add items to an existing selection, and the Ctrl key to select/deselect items.

Single Selection

This is the default selection mode. You can click your mouse button to select an object, while at the same time deselecting a previously selected object.

Rectangular Selection

You can switch to rectangular-selection mode by pressing the ‘R’ key. The cursor changes and you can use your left mouse button to draw a rectangle. Each object that lies within the rectangle is considered selected. Press the ‘R’ key again to leave this selection mode and return to single-selection mode.

Lasso Selection

You can switch to lasso-selection mode by pressing the ‘A’ key. The cursor changes and you can use your left mouse button to make a lasso selection. Each object that lies within the lasso is considered selected. Press the ‘A’ key again to leave this selection mode and return to single-selection mode.

View Tooltip

For desktops, a tooltip is enabled to provide additional information about the symbol.

Keyboard Shortcuts (desktop only)

Action Shortcut
Lasso selection A
Rectangular selection R
Zoom in +
Zoom out
Rectangular zoom Z
Move ← ↑ → ↓
Go to initial start position H

Styles

Analytical Map

Colors

For general rules about using colors in charts, see Chart – Color Palettes. You can define colors programmatically for each region.

Default Colors

Water and regions have default colors. The color of water cannot be changed. The color of each region can be changed individually. Keep the default color if the region has no data.

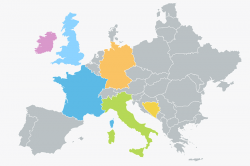
Default colors for analytic map

Regions Only

Colors from Qualitative Palette

Use colors from the qualitative palette to highlight particular regions. Use the first color of the qualitative palette. Also use colors from the qualitative palette to separate regions into distinct groups. Note that colors from the qualitative palette have no semantic value. For example, do not choose a color because it is blue or green as the hue associated to these colors may change in the future or may be customized by the customers. Start by using the first color and then the second color and so on, unless there is a good reason for not doing so. If there is no data for a region, keep the default color.

Map with one color
Map with one color
Map with multiple qualitative colors

Colors from Sequential Palette

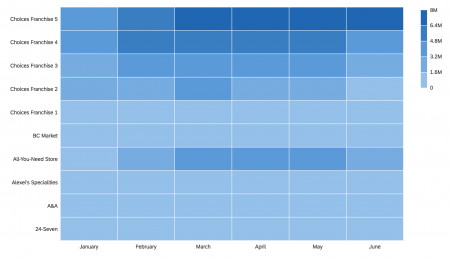
Use colors from the sequential palette to encode quantitative differences, that is, to visually represent the idea of level, progression, or graduation. If there is no data for an item, keep the default color. See the section on How to Use the Sequential Palette in the Chart – Color Palettes article.

Map with colors from the sequential palette

Colors from Semantic Palette

Use colors from the semantic palette to show that data points are bad, neutral, or good. If there is no data for an item, keep the default color.

Map with colors from the semantic palette

Colors for Symbols

Symbols and Regions

Map with Circles/Geocircles

If you need to display circles over a map and use sequential colors for the regions, use the sequential palette with the following colors:

Region Circle After
Multiple brightness of the first hue sapUiChartPaletteSequentialHue2; Opacity: 60% @sapUiLightestBorder

See the section on How to Use the Sequential Palette in the Chart – Color Palettes article.

Visualizing two parameters of interest

Guidelines

General Guidelines

  • If you want to include a toolbar and/or show additional content on a map, use the SAP UI5 map container control.
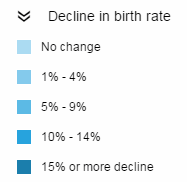
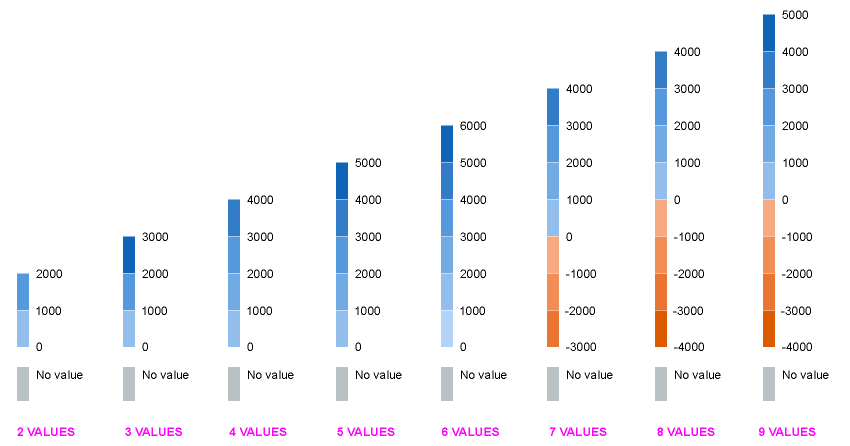
  • Use the sequential color palette if there are no more than six different states. If you have more than three states, we recommend that you use the tooltip or legend in addition to the colors to provide detailed information. The reason for this is that the contrast of the colors for maps is too low to differentiate all colors at first glance. The sequential palette aims to highlight the most interesting states by using the darkest and the lightest color.
  • Use the qualitative color palette if you want to visualize various states that are independent of each other, such as election areas.
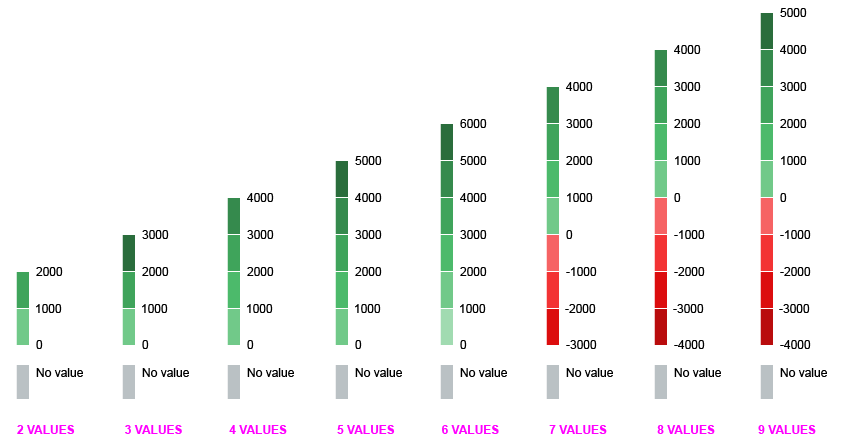
  • Use the semantic palette if you want to express good versus bad states, such as with revenue figures.
  • If you want to display two regions with specific parameters, a combination of coloring the regions and using circles would be the best choice. Avoid overlaps by providing different aggregation levels at different zoom levels. Note that there could be problems with relating a parameter to the radius of a circle because a user will compare the area and not the radius. The area has a quadratic relation to the radius. Consequently, a smaller number looks very small and cannot be visually compared with other values.

Resources

Want to dive deeper? Follow the links below to find out more about related controls, the SAPUI5 implementation, and the visual design.

Elements and Controls

Implementation

Object Handling – Copy

The copy pattern allows you to copy an object and then edit the newly created object.

Usage

Use the copy pattern if you want to copy an object and then edit the newly created object. If you want to reference to an existing object, use the create with reference pattern instead.

Layout

There are 4 use cases for copying an object:

  1. The object to be copied is part of the current table.
  2. The object to be copied is not part of the current table (for example, because it has been approved).
  3. The object to be copied is a template.
  4. The whole object is to be copied, for example, from an object page within a list-detail-detail view (flexible column layout).

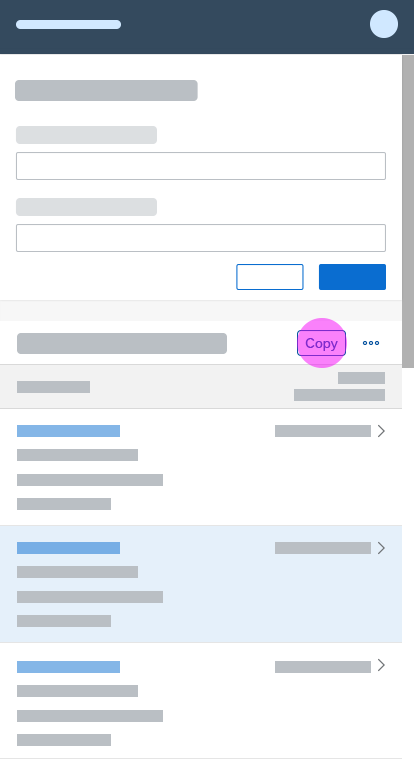
For use cases 1–3, place the Copy function (a transparent button) in the relevant toolbar (for example, above the form or table control).

For use case 4, place the Copy function in the header toolbar of the object page (global actions). For more information about the interaction, read about the flexible column layout.

Behavior and Interaction

This section describes the interaction flow of the copy pattern for different use cases.

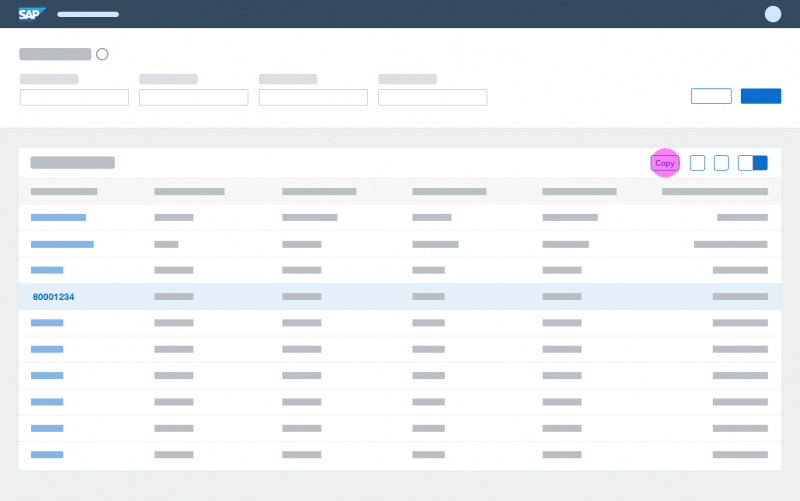
1) The copied object is part of the current table.

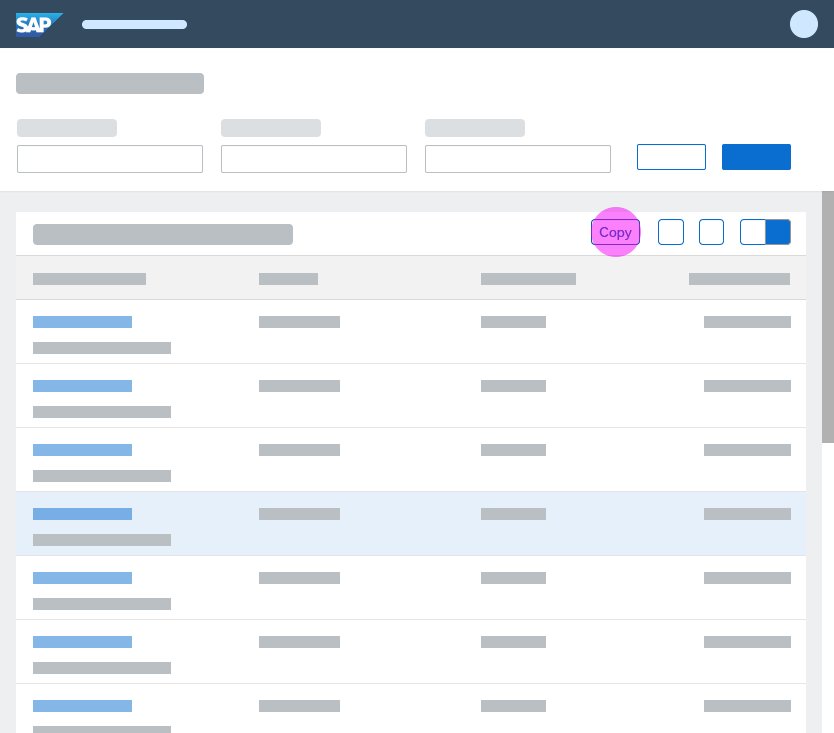
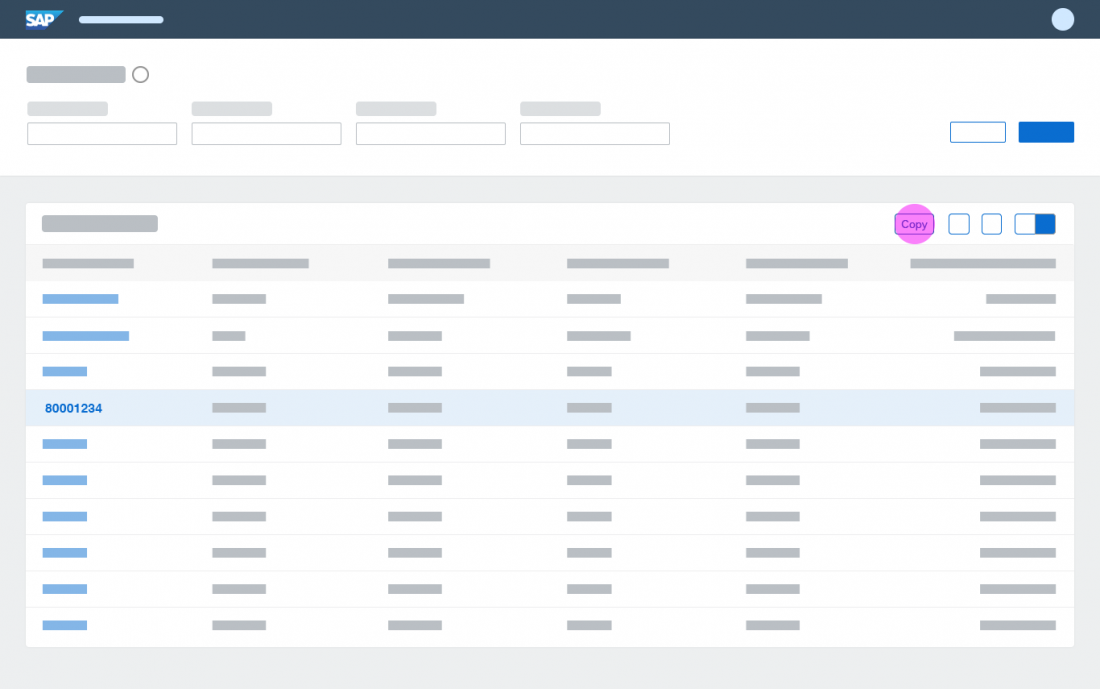
The user selects an item to be copied. Multiselection is not possible. Clicking the Copy button takes the user to the details page.

Copied object is part of a table

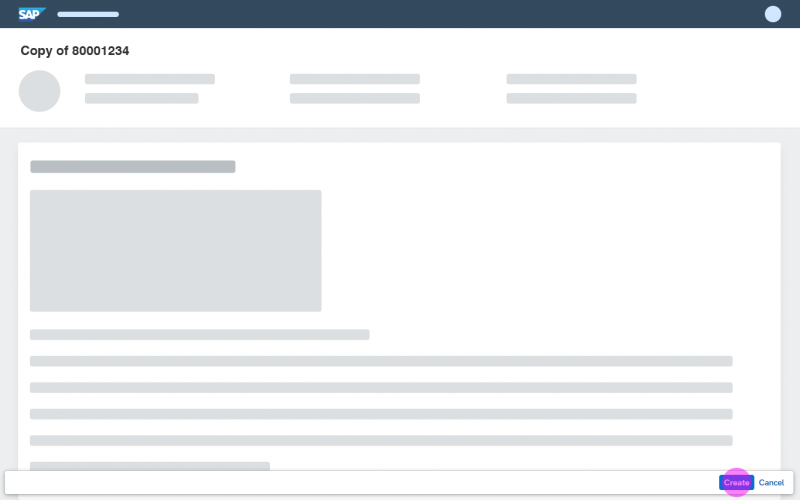
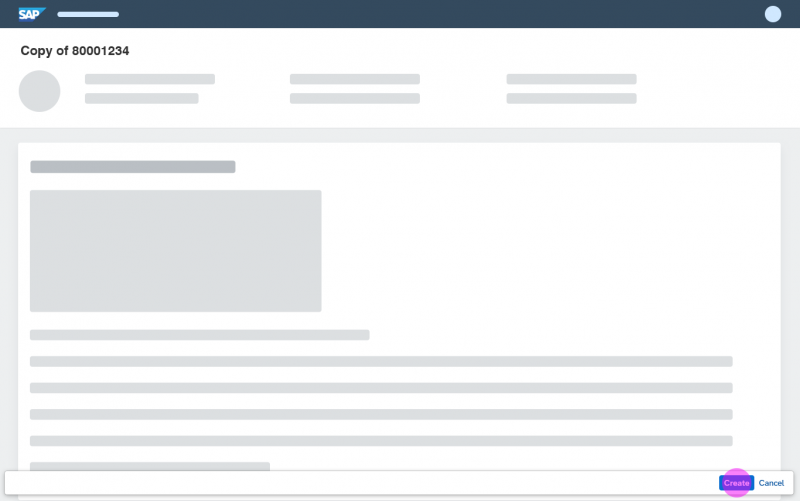
The form is prefilled with the data from the selected item on the previous page. The form remains in edit mode until the user clicks the Create button. If the user selects Cancel, a data loss message appears.

Details page after copying

2 + 3) The copied object is not part of the current table or is to be copied from a template.

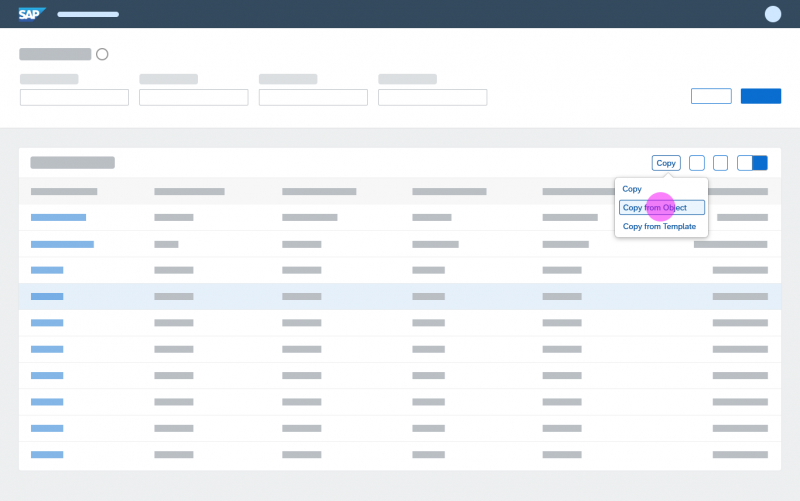
When the user clicks the Copy button, an action sheet appears. The user can choose one of three actions: CopyCopy from Object, or Copy from Template. You can also choose to show only one or two of these actions to the user.

Action sheet after clicking the 'Copy' button

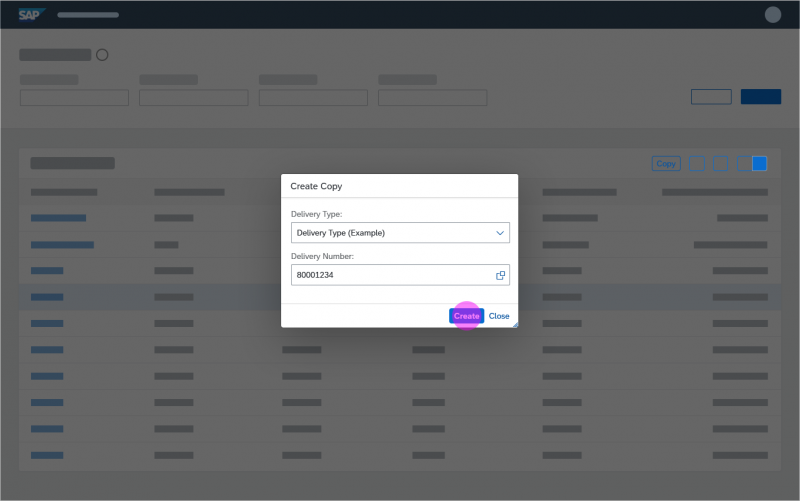
When the user selects Copy from Object or Copy from Template, a dialog appears prompting the user to choose an object or a template. When the user chooses one of these and clicks the Create button, the details page appears.

Dialog appears after the user chooses a copy action

The details page contains a prefilled form and remains in edit mode until the user clicks the Create button. If the user clicks Cancel, a data loss message appears.

Details page after copying

4)    The copied object is located in the details view (flexible column layout)

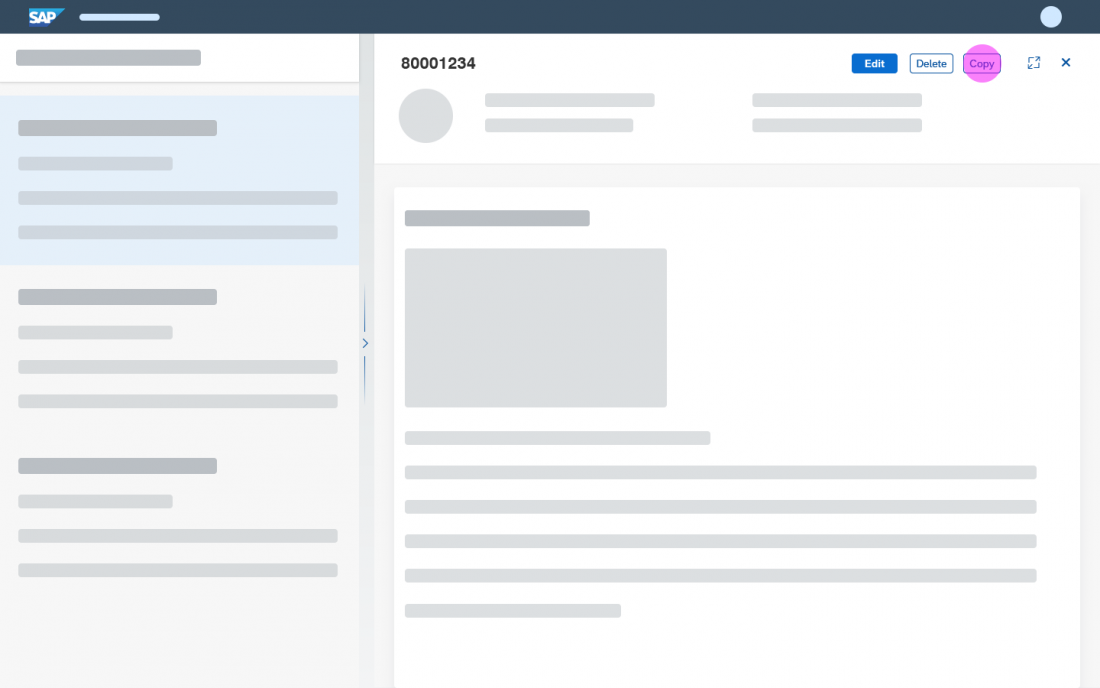
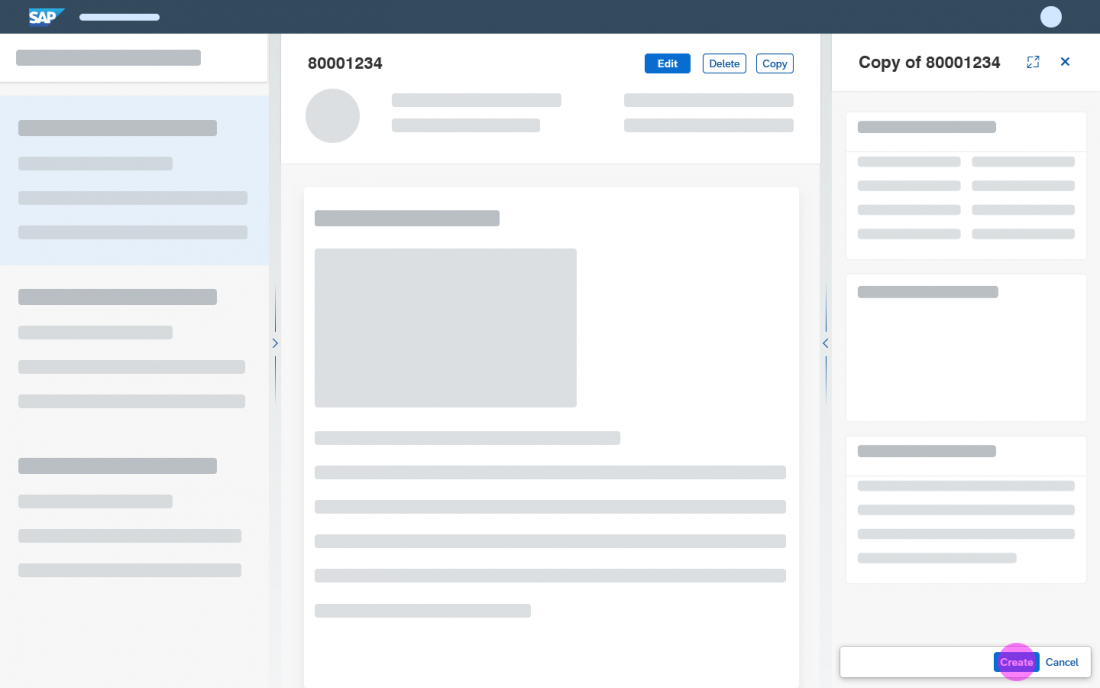
The user selects the item to be copied from the list view, for instance list report or worklist. The Copy button appears in the header toolbar of the object page within the first detail view. Clicking the Copy button takes the user to edit mode of the new item within the second detail view of the flexible column layout, also known as list-detail-detail mode.

List-detail view, with the 'Copy' button in the header toolbar of the object page

In edit mode, the form is prefilled with the data from the item selected on the previous page. The form remains in edit mode until the user clicks the Create button. If the user clicks Cancel, a data loss message appears.

List-detail-detail view in edit mode after copying

Responsiveness

The responsiveness of this page depends on the responsive behavior of the controls being used.

Copy pattern adapted to smartphone
Copy pattern adapted to tablet
Copy pattern adapted to desktop

Resources

Want to dive deeper? Follow the links below to find out more about related controls, the SAPUI5 implementation, and the visual design.

Elements and Controls

Implementation

Object Handling – Create with Reference

Use the create with reference pattern if you want to create a new object and reference it to an existing object.

Usage

This pattern shows the relationship between two objects only, and does not copy the content from one object to another. If you would like to copy an object and edit it, have a look at the article on copying instead.

Layout

There are several ways to trigger the create with reference function:

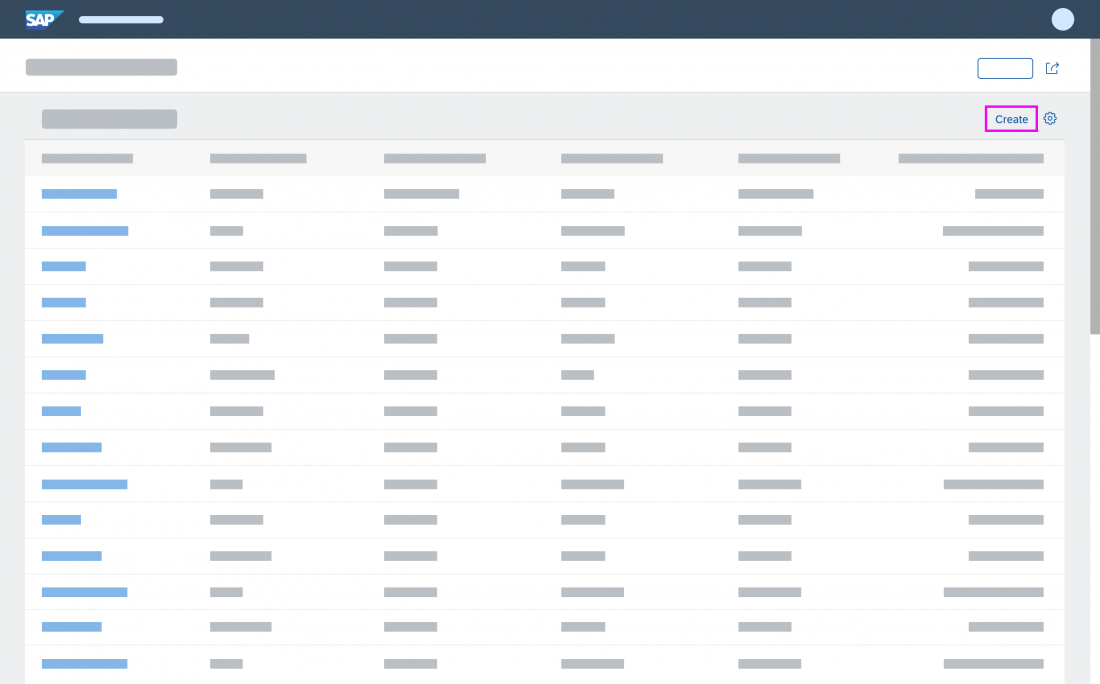
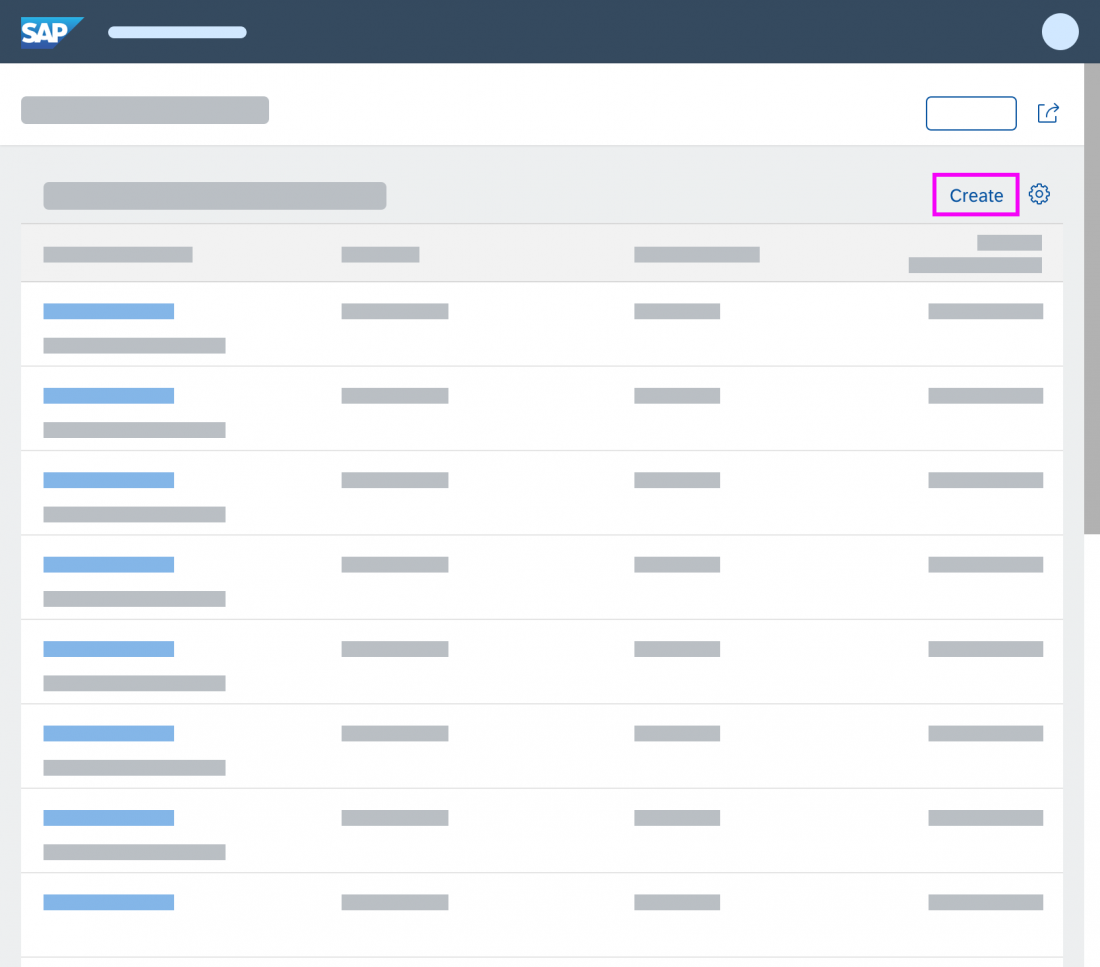
  • Clicking the transparent Create button in the toolbar (for example, above a form or table control).
  • Clicking the Create ( ) icon in the toolbar of a worklist or a list report (for example, in a list-detail-detail pattern using the flexible column layout).

There are two ways to create an object with reference to support different use cases:

  • Using the dialog to create objects with no more than 8 editable fields.
  • Using the details page to display large amounts of data that cannot be displayed in a dialog, such as long forms.

Behavior and Interaction

This section describes the interaction flow of the create with reference pattern.

Create with Reference Using a Dialog

Clicking the Create button takes the user to a dialog. This dialog opens with an unchecked checkbox and several editable fields for creating the new object, such as a line item.

If the user wants to reference another object, such as a sales order, he or she must select the checkbox and then select the Reference Type and the Reference ID. We recommend offering the value help dialog for selecting the reference ID. However, the choice of control will also depend on the type of content being referenced.

Clicking the Create button saves the entries and adds the object (line item) to the current table. If the user chooses Cancel, a data loss warning appears.

'Create with Reference' using a dialog

Create with Reference on Details Page

Clicking the Create button takes the user to the details page. This page contains an unchecked checkbox and a large form with editable fields for creating the new object, such as a line item.

If the user wants to reference another object, such as a sales order, he or she must select the checkbox and then select the Reference Type and the Reference ID. We recommend offering the value help dialog for selecting the reference ID. However, the choice of control will also depend on the type of content being referenced.

Clicking the Create button in the footer toolbar saves the entries. The create page then switches into display mode. The Back button takes the user to the previous page. If the user chooses Cancel, a data loss warning appears.

'Create with Reference' on details page

Responsiveness

The responsiveness of this page depends on the responsive behavior of the controls being used.

Create with reference pattern adapted to desktop
Create with reference pattern adapted to tablet
Create with reference pattern adapted to smartphone

Resources

Want to dive deeper? Follow the links below to find out more about related controls, the SAPUI5 implementation, and the visual design.

Elements and Controls

Implementation

Dynamic Side Content

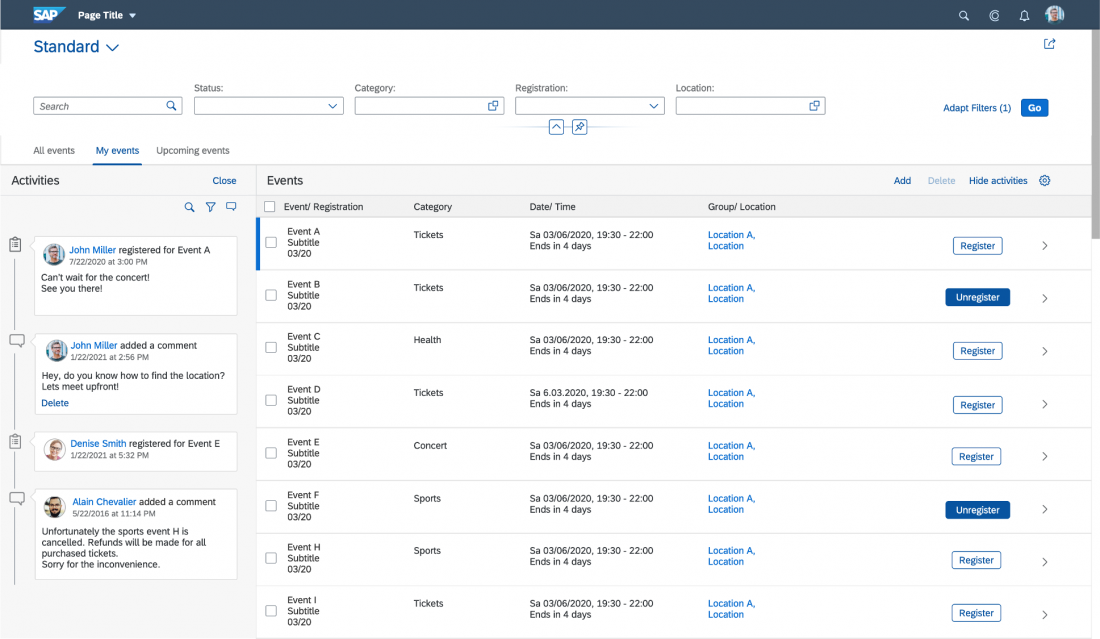
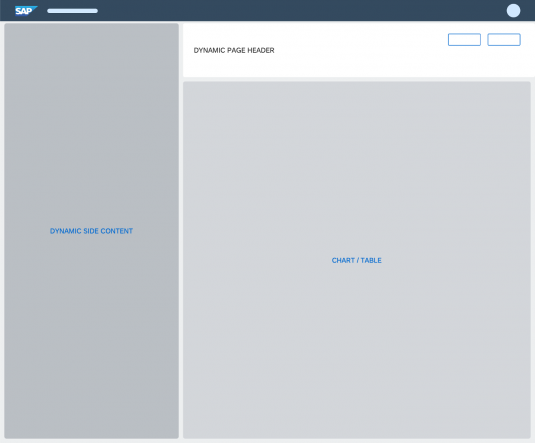
Dynamic side content is a layout control that displays additional content to help the user better understand the data that’s being displayed on the screen.  It is displayed in a way that flexibly adapts to different screen sizes.

App development teams can configure the behavior of the control on smaller screen sizes by following the relevant guidelines.

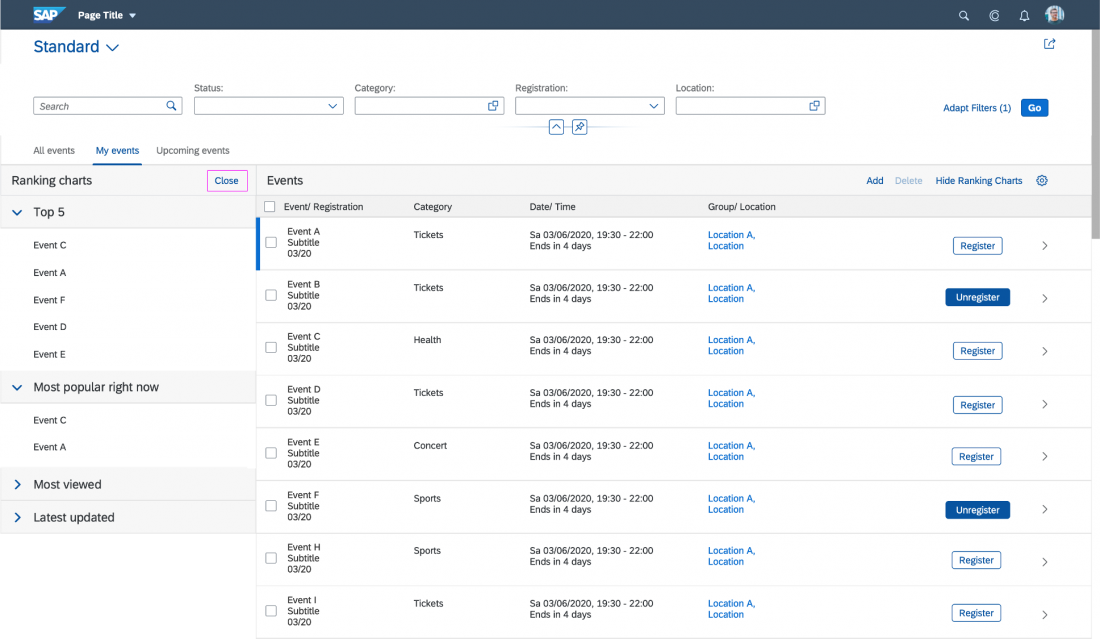
Dynamic side content layout

Usage

Use dynamic side content if:

  • You want to display information that:
    • Will enrich the main content and will help the user better perform his/her tasks;
    • Only makes sense when displayed next to the main container (side-by-side);
    • Influences the main content (for example, a filter for list; settings for chart, details for map).
  • Users should have access to all of the key functions and critical information in the app even if they do not see the side content. This is important because on smaller screen sizes it may be difficult to display the side content in a way that makes it easy for users to access.

Do not use dynamic side content if:

  • You want to display critical information that should be visible all the time. The dynamic side content is not meant to split the page into two equally important sections.
  • You want to display navigation or drilldown. For drilldown scenarios, use the Flexible Column Layout.
  • You want to display a list-detail scenario. Instead, use the Flexible Column Layout.
Information
Currently Dynamic Side Content is not available in Fiori Elements.

Layout

Dynamic side content is displayed to the left or right of the main content container.

The dynamic side content can be closed by a button that is displayed in its toolbar.

The dynamic side content can be opened, if it set to hidden, with an action within the container to which it is directly related, or by an action displayed in the container-related toolbar, if it is available.

When the dynamic side content is displayed side-by-side to the container, it doesn’t overlay it. The main container narrows down and makes space for the additional content to be displayed.

Responsiveness

The dynamic side content control is built for different screen sizes and layouts.

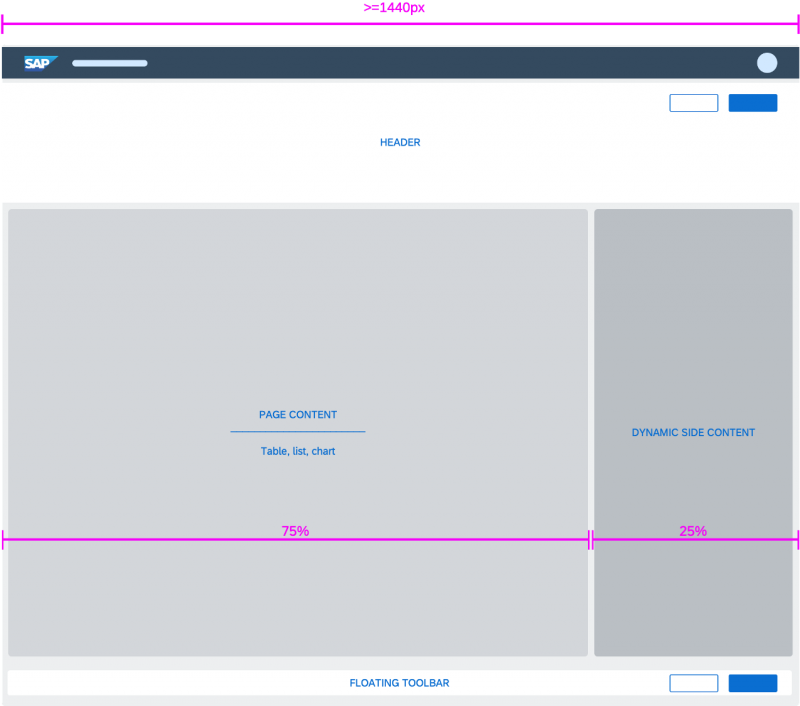
The default screen layout features the side content on the left or right side of the screen, covering 25% of the screen width on a large desktop (over 1440 px).

Dynamic side content - Default layout

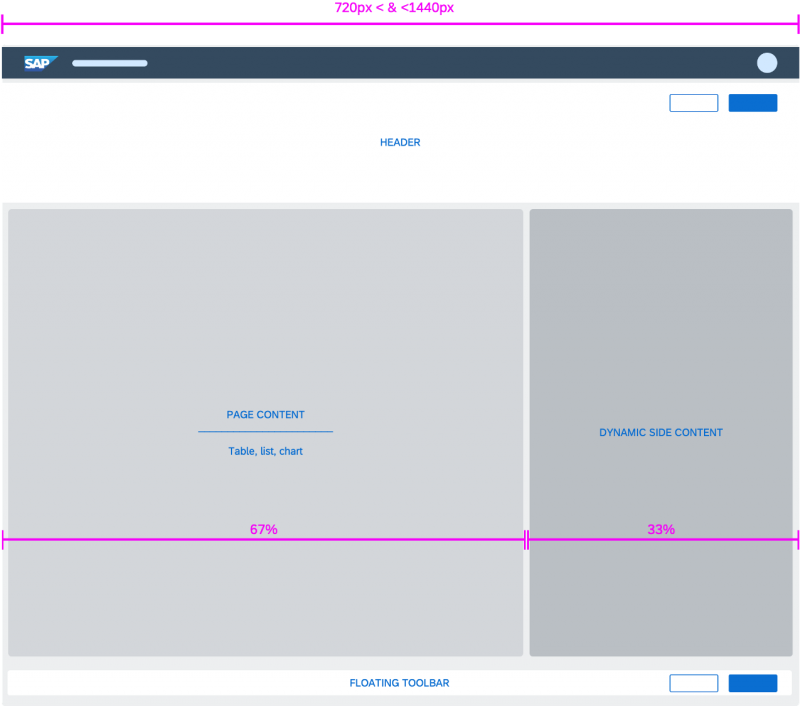
On smaller screen sizes (under 1440 px), the side content occupies 33% of the screen width to accommodate the nested controls. If the side content width falls below 320 px, the side content automatically slides under the main content, unless the app development team specifies that it should disappear.

Dynamic side content - Smaller screen sizes

On screen sizes of less than or equal to 720 px, the side content automatically disappears from the screen (unless specified to stay under the content) and can be triggered from a preset trigger (specified within the app). When the side content is triggered, it replaces the main content. We recommend that you always place the trigger for the side content in the same location, such as the container toolbar.

If only the side content is shown and the user increases the screen size, the main content is automatically displayed again. If the user then decreases the screen size, the side content disappears (unless specified to stay under the content), and can be opened again by the trigger.

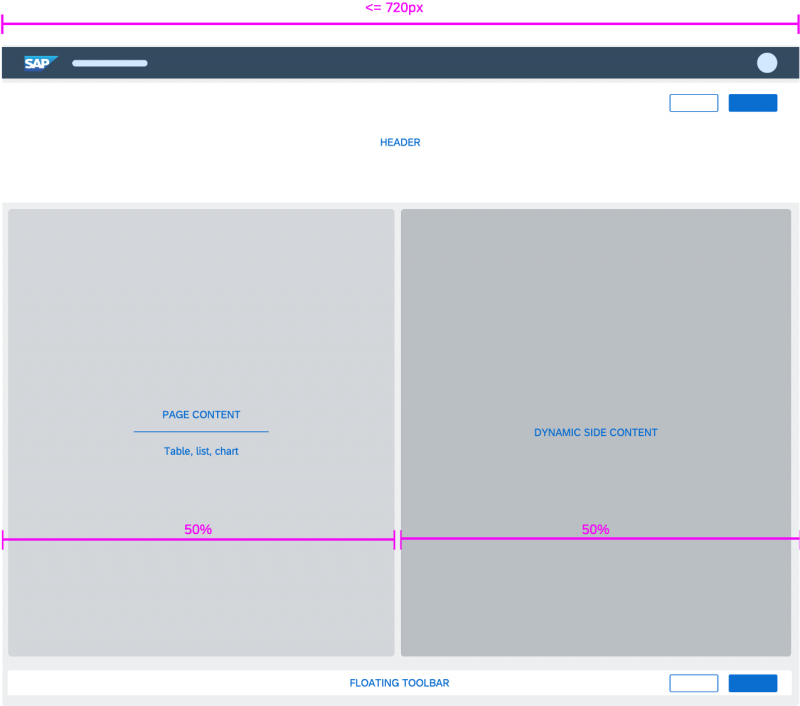
Equal split: A special view of the side content is the 50:50 view, which enables users to show more data, for example, for comparison purposes. The responsive behavior of the equal split is the same as in the standard view: The side content disappears on screen widths of less than 720 px and can only be viewed by triggering it.

Dynamic side content - Equal split

The app development team may specify that the side content should slide under the main content when the screen is resized to a smaller width. Sliding the side content under the main content on smaller screens allows it to remain on the screen at all times. However, it may only become visible after scrolling.

Navigation

The side content is always related to the main content, so it must show content that can be triggered from the main content. This also means minimizing navigation, such as drill-ins within the side content, and displaying content that is triggered from the main content area. An example would be showing additional details such as contact information or conversation history. If a different type of data relates to the main content, app developers can implement a switcher in the side content. However, we recommend that you keep the side content free of additional navigation elements.

Triggering the side content

The side content can be set to hidden by default, and it automatically disappears when the screen width is less than or equal to 720 px (except when it is set to be under the main content).The app design team can define the trigger point. Our recommendation is to put a transparent text button with a meaningful label in the container toolbar, or an action inside the container the dynamic side content is related to. Ensure that the user can understand how to trigger the side content. Please, avoid using icons, because they can confuse the user.

Hiding the side content

The side content should be hidden from the header (top) section of the side content. The side content container itself has no header. We therefore strongly recommend that you use a toolbar control with a title, a transparent button labeled Close, and a spacer between them.

Hiding side content – From the header section

Guidelines

Dynamic Side Content in Object Page

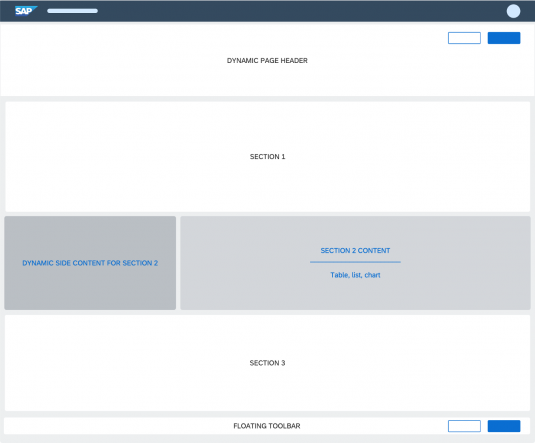
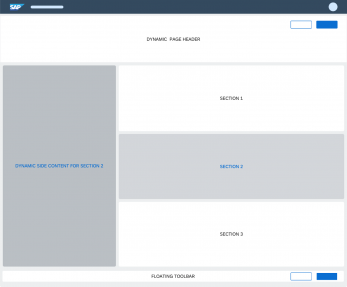
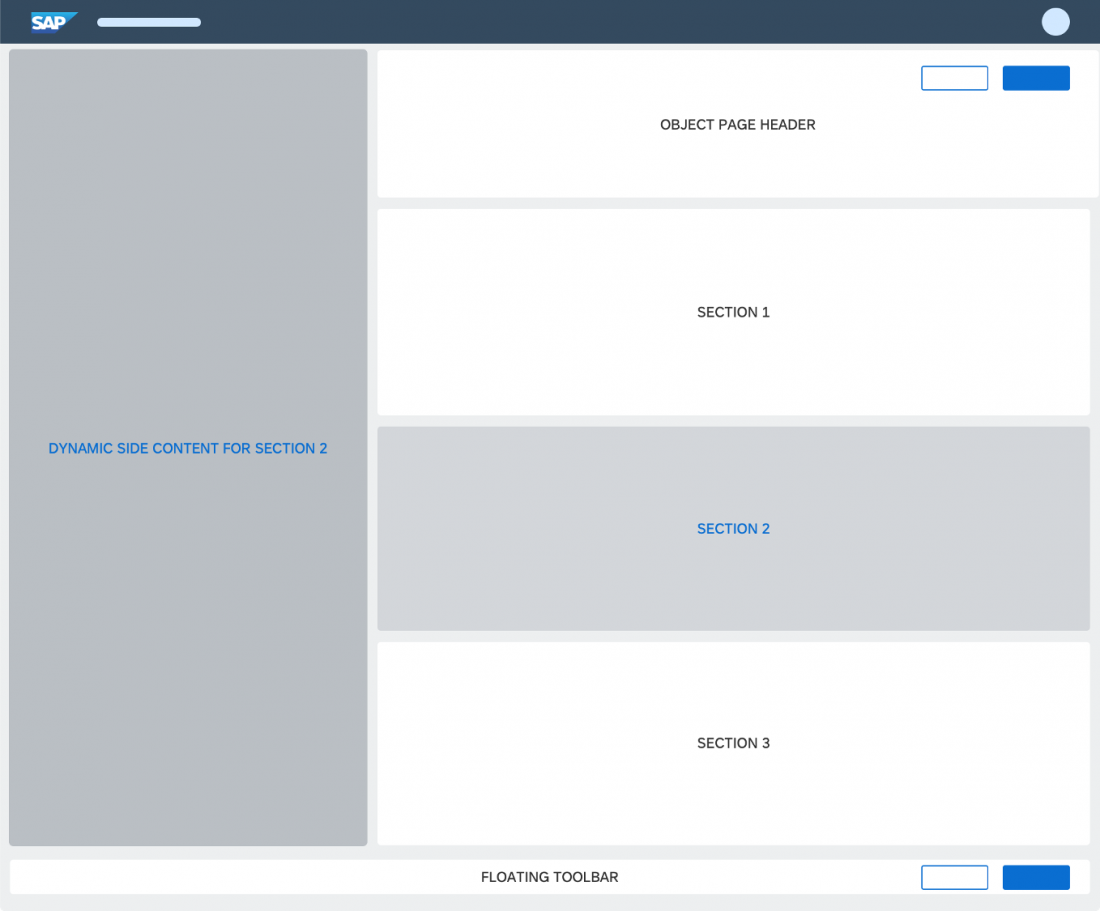
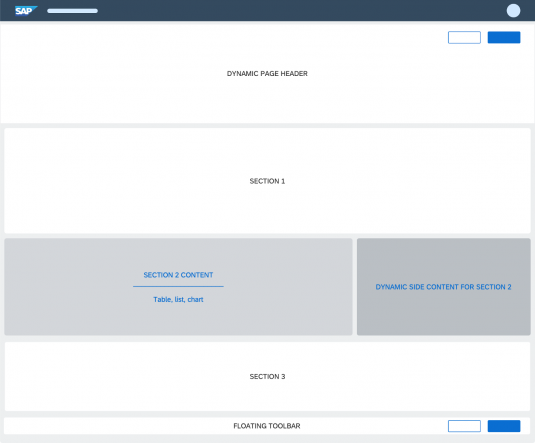
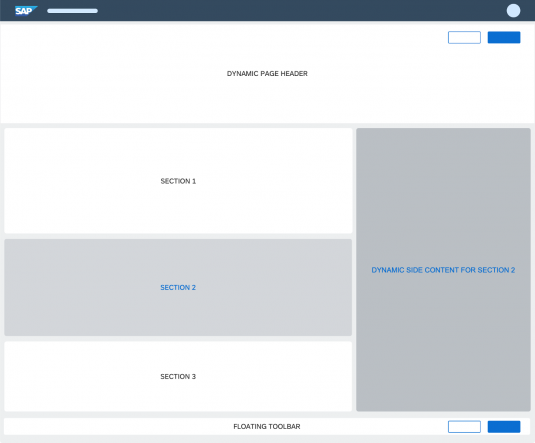
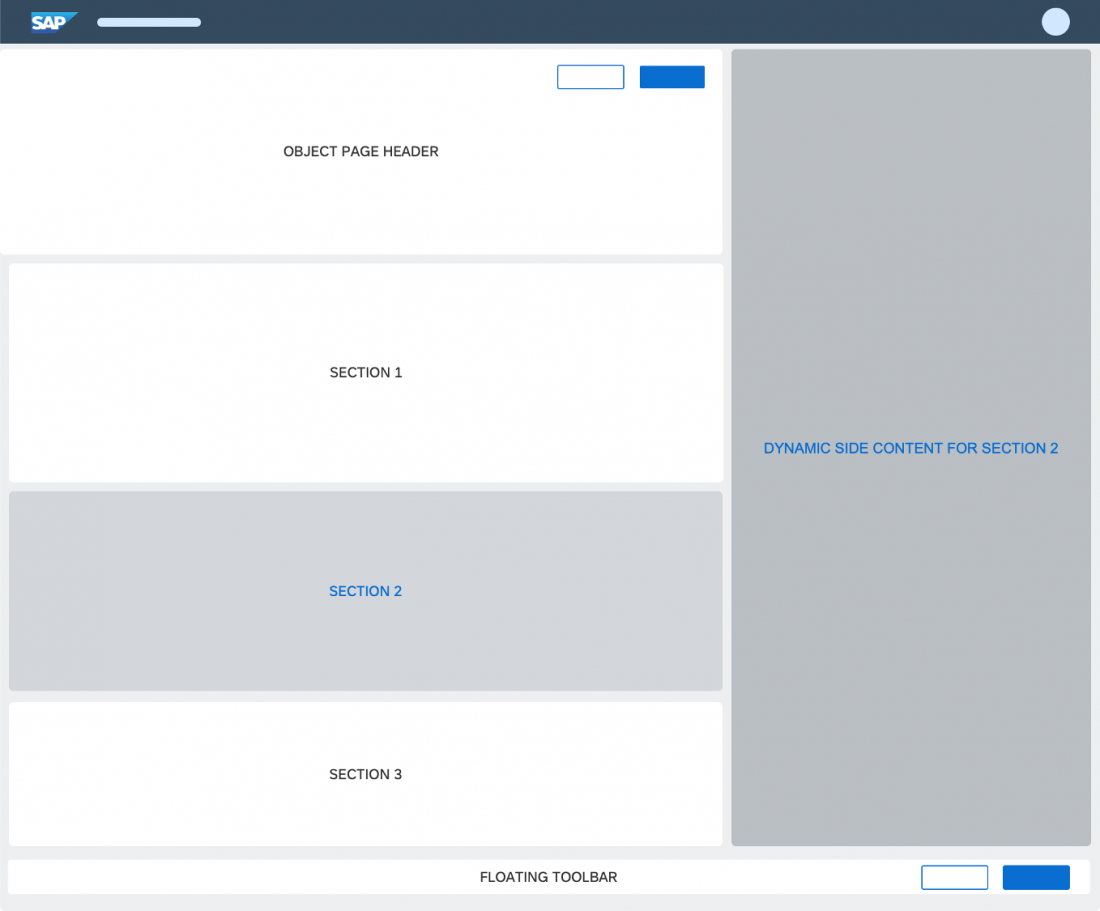
Dynamic side content can be used within the object page. Use dynamic side content within a section if you want to give the user additional data related to this section. If you want to display additional information about the object such as a timeline, include this information as a new section.

Do
Correct usage of dynamic side content in object page
Don't
Wrong usage of the dynamic side content in object page
Don't
Wrong usage of the dynamic side content in object page
Do
Correct usage of dynamic side content in object page
Don't
Wrong usage of the dynamic side content in object page
Don't
Wrong usage of the dynamic side content in object page

Do not separate the screen into two panels. Do not use it for navigation, for drilldown, or for displaying information related to the entire object.

Dynamic Side Content in List Report

Do not separate the page into two panels when you are using it inside the list report. The dynamic side content should be placed directly next to the table or the chart container.

Do
Correct usage of dynamic side content in list report
Don't
Wrong usage of dynamic side content in list report

Dynamic Side Content in Dynamic Page

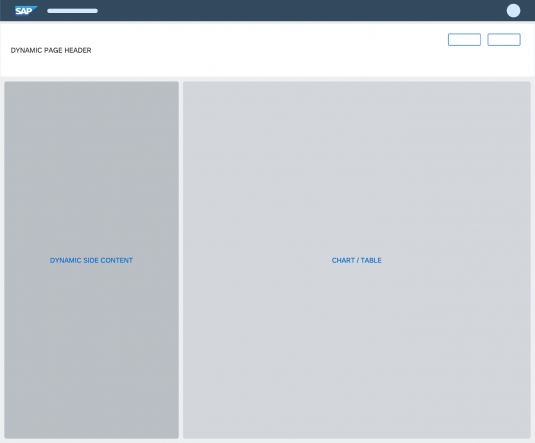
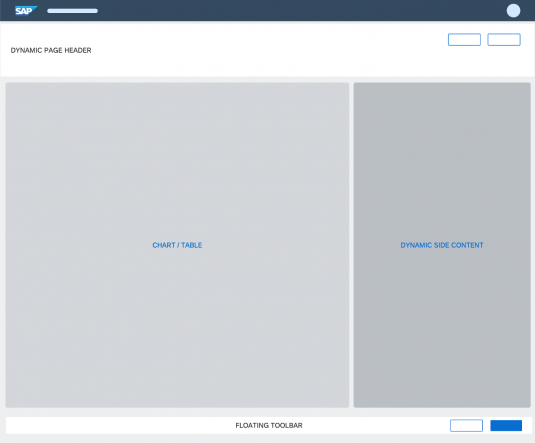
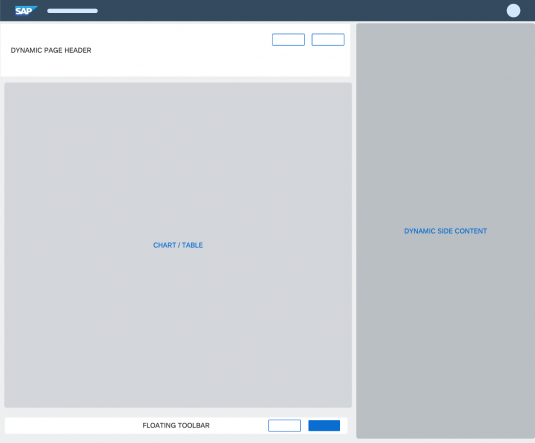
Do not separate the page into two panels if you use dynamic side content within the dynamic page layout. Place the dynamic side content directly next to the page container and under the header container. The header snaps manually and both sections have their own scrollbars.

Do
Correct usage of dynamic side content in dynamic page
Don't
Wrong usage of the dynamic side content in dynamic page

Examples

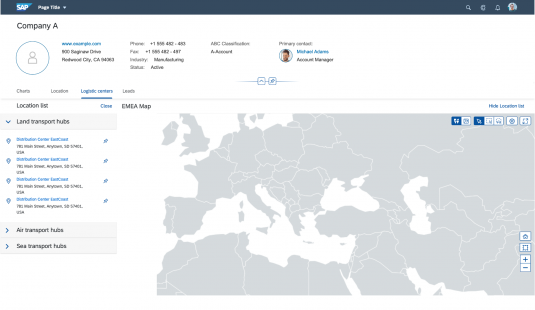
Dynamic side content in object page, used with map
Dynamic side content in list report, used with planning calendar
Dynamic side content with table

Use of Controls in the Dynamic Side Content

You can use most of the main controls in the dynamic side content, such as text, simple form, chart, list, panel, tree, timeline, or feed and notes. However, you must make sure that the control doesn’t result in the appearance of a horizontal scrollbar.

Do not use complex controls, such as tables.

Resources

Want to dive deeper? Follow the links below to find out more about related controls, the SAPUI5 implementation, and the visual design.

Elements and Controls

Implementation

Table Select Dialog

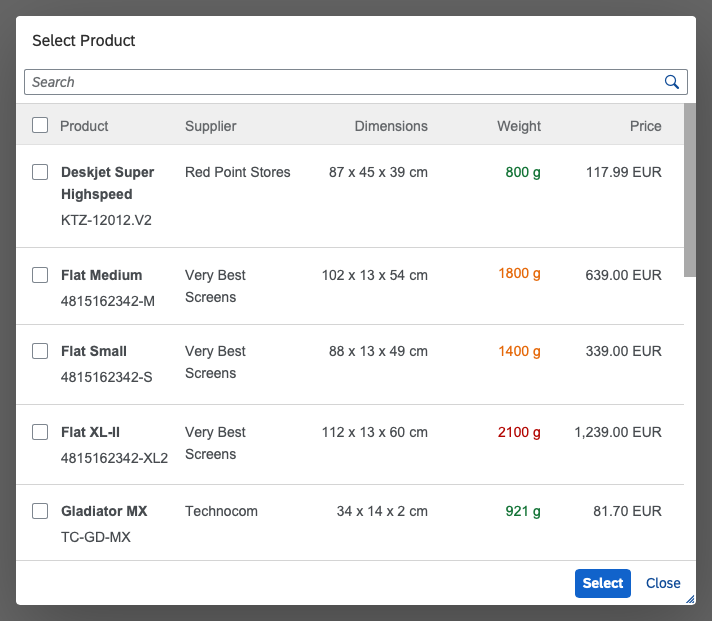
Table select is a commonly-used dialog that helps users to make a selection from a comprehensive table containing multiple attributes or values. With the dialog, users are also able to access additional information about the objects in the table without needing to select them first.

The dialog provides a responsive table layout with additional search, filter, and selection functionalities in the header. A footer toolbar provides actions for canceling or confirming the process.

Usage

Use the table select dialog if:

  • You need to help users select one or more items from a comprehensive list that contains multiple attributes or values.

Do not use the table select dialog if:

  • You need to help users pick one item from a predefined set of options that contains only one value. In this case, use the dropdown box instead.
  • You need to help users with query-based range selection and enhanced filter options. In this case, use the value help dialog instead.
  • Your use case requires tabs, filters, or actions in a select dialog.In this case, use a standard dialog instead.
  • Your use case only requires filtering without selection. In this case, use the filter toolbar instead.
Information
For more information on which selection control to choose, see the selection control overview.

Responsiveness

The table inside the table select dialog behaves like the responsive table. On smaller screens, the columns wrap and build a list that shows all the information. All other elements in the control are also responsive.

On bigger screens, the table select dialog also provides columns
The table in the dialog is responsive and wraps on smaller screens to show a list

Behavior and Interaction

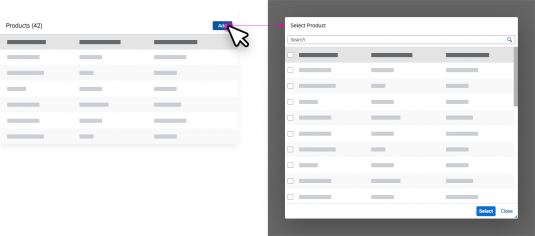
The table select dialog can be called up from any control. The trigger is usually a button with a selection icon in an input field, or an Add button in a toolbar.

Triggers

Input Trigger

This trigger can be useful if users need to select, for example, one customer from a large customer register.

Example of a trigger: the selection icon in the input field

“Add” Button

This trigger can be useful if users need to add an item to a list. For example, the dialog could help users select the product from a large product catalog. Clicking Select in the footer toolbar of the dialog adds the selected products to the list.

“Clear” Button

The Clear button allows users to clear all the selected items.

Example of a trigger: 'Add' button in a table

Sticky Header

The column headers and info toolbar in the table select dialog are “sticky”, which means that they stay fixed on top when scrolling (sap.m.Table, property: sticky).

Information
The “sticky” feature has some browser limitations, and is not supported in Internet Explorer and in Microsoft Edge versions older than 41. In these browsers, the headers of the table select dialog will not be sticky.
Example of sticky headers


Single Select

The single-select version does not need a Select button in the footer toolbar because the selected entry is taken over and closed as soon as a user selects an item from the table. If applicable, the entry is displayed in the field from which the dialog was triggered. Alternatively, a toast message can be shown if necessary.

Multi-Select

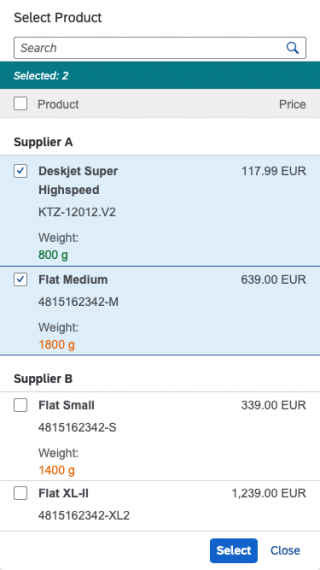
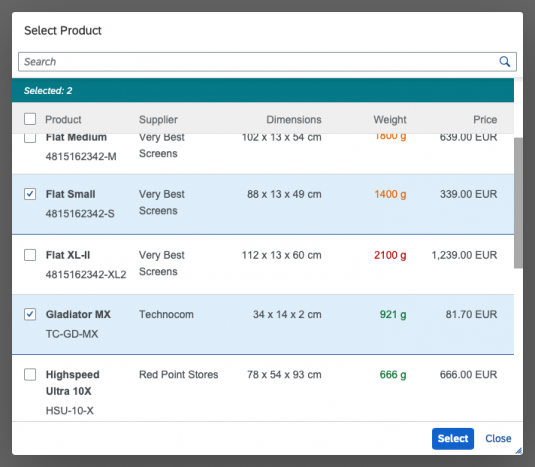
The multi-select version of the table select dialog provides checkboxes for users to choose multiple items. The blue infobar above the table indicates the number of selected items. The selection is taken over when the user closes the dialog via the Select button in the footer toolbar. Clicking Cancel closes the dialog without taking over the selected values.

Remembering Selections

If selections need to be memorized in order to help users make corrections, you can set the RememberSelections property to true. This restores the selection to the state it was in when the dialog was last opened as soon as users exit the dialog via Select or Cancel. The interaction flow of the RememberSelections property is shown and explained in the select dialog article.

Grouping

The list can also be displayed as grouped. Group headers divide the table into segments. A pregrouped table is useful for tables with many entries, which can be sorted by a single attribute.

Table select dialog with group headers

Resize and Drag Dialog

You can allow users to resize and drag the table select dialog by setting the resizable and draggable properties to “true”.

  • A resizable dialog makes sense if the items within the dialog can have long names or descriptions.
  • A draggable dialog allows users to see the app content behind the dialog.
Guidelines
Both features are optional. However, if you only need one, always set both properties to “true” for consistency reasons.

Guidelines

Set the information provided in the table select dialog from top to bottom as follows:

Dialog Header

Use the following format for the dialog header:

  • For single selection: Select [Business Object]
    Example: Select Product
  • For multiple selection: Select [Business Objects]
    Example: Select Products.

Search

The first interactive element in the dialog is a standard search field. Two types of search behavior are available:

  • live search, also known as “search-as-you-type,” which is triggered by each character that the user enters or deletes.
  • A manual search, which is triggered explicitly after the user enters text in the search field and clicks theSearch icon or presses the ENTER key. As soon as the user hits the Search button, a Delete icon appears at the end of the input field to delete the keyword and cancel the result list.

App developers need to decide which search to use. We recommend implementing the live search whenever possible. Use the manual search only if the amount of data is too large and if your app would otherwise run into performance issues. For more information, check out the article on searching.

Infobar

In multi-selection mode, an infobar shows the number of selected items. Use the following format:

[Business Objects] Selected: [Number of Items]
Example: Products Selected: 2

“Clear” Button

The “Clear” button for clearing all the selected items is optional. By default, the button is not shown. To display the button, set the showClearButton property to “true”.

Content

The content area provides a table. This behaves like the responsive table, so the columns wrap on smaller screens and display a list.

By default, the table select comes with a growing feature (property: growing = true). We recommend disabling the growing feature and setting this property to “false”. This ensures that all items in the table are loaded at once, and that the “Items selected” count, the search, and select/deselect features all work properly.

Footer Toolbar

In the multi-select version, the footer toolbar contains the Select and Cancel buttons. Select takes over the selection, while Cancel resets the selection to the state it was in when the user opened the dialog.

In the single-select version, only provide Cancel in the footer toolbar because the dialog takes over the selection as soon as the user chooses one.

Resources

Want to dive deeper? Follow the links below to find out more about related controls, the SAPUI5 implementation, and the visual design.

Elements and Controls

Implementation

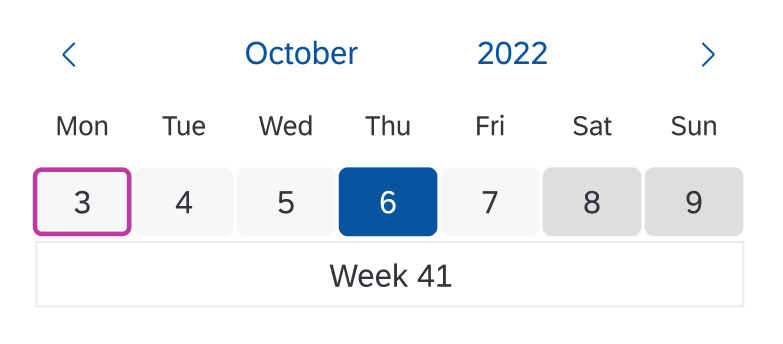
Calendar Date Interval

The calendar date interval displays a range of days in a single row. The control allows the user to select a single day, multiple days, or a range of days. Content corresponding to the date selection is usually displayed below the control. The user can navigate the date intervals by browsing through them (using the Previous and Next arrows), or by going directly to a specific month or year.

Compared to the regular date range selection control, this control offers a flexible date range and consumes very little vertical space. You can also adapt the width to fit the available horizontal space.

When to Use

  • The user simply needs a calendar. Use the calendar instead.
  • The user wants to pick a single date out of a calendar view. Use the date picker instead.
  • The user wants to pick a date and time. Use the date/time picker instead.
  • The user wants to pick a date range out of a calendar view. Use date range selection instead.
  • The user wants to set a dynamic date, such as “last x months”. Use the dynamic date instead.

Layout

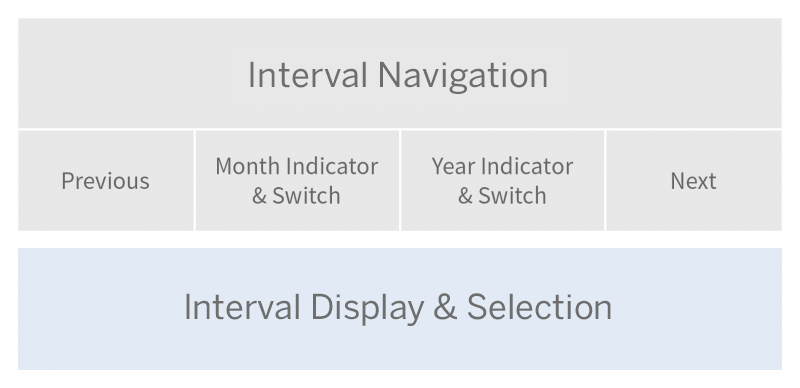
The date interval control is divided into two main areas: date interval navigation, and date interval display and selection.

The navigation area contains two arrows (one to the left, one to the right), which allow the user to navigate easily to the previous and next date ranges. This area also contains month and year indicators, which display the currently selected month and year. These indicators trigger the month and year navigation mode of the control.

The display/selection area is primarily used to display the range of days in the current date interval. You can also display a second row to show the calendar week (property: showWeekNumbers). When the user triggers month or year navigation, a range of months or years is displayed in this section to enable easy interval navigation.

Schematic visualization of calendar date interval

Components

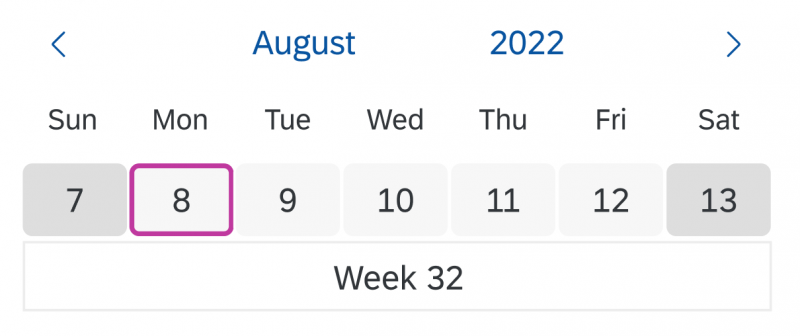
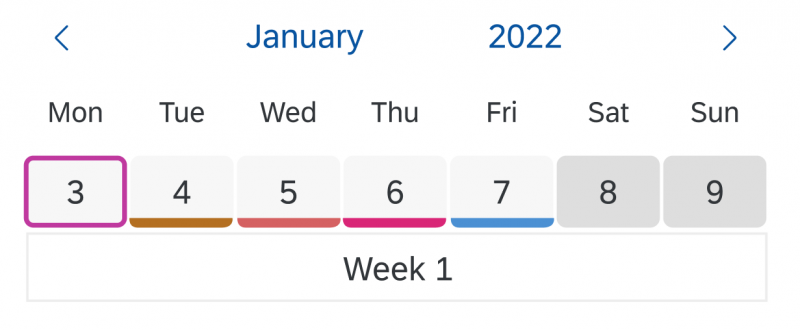
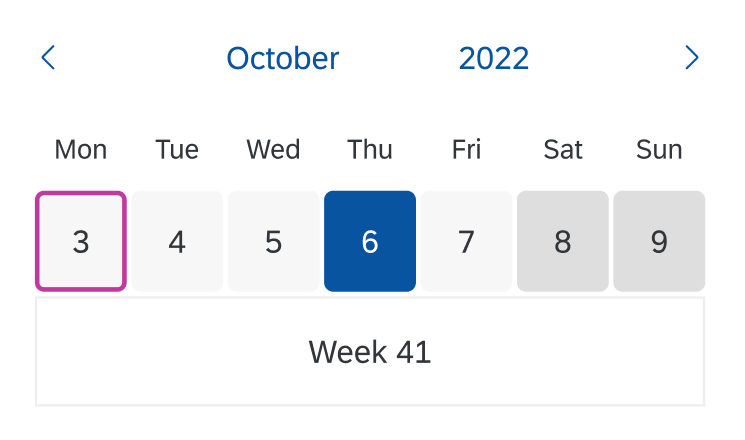
Current Day

The current day is highlighted by a colored frame. Weekends are shaded in a slightly darker gray.

Calendar date interval

Special Days

You can mark special days, such as public holidays, with a colored line along the lower edge.

Color markings for special days

Behavior and Interaction

The behavior and interaction of the calendar date interval control can be divided into two parts: navigation and selection.

Navigation

Previous/Next

The user clicks the Previous or Next arrow to replace the currently displayed date interval with the previous or next date or period. Previous/Next navigation can be used while the user is in selection mode, as well as in month, year, or year interval navigation mode.

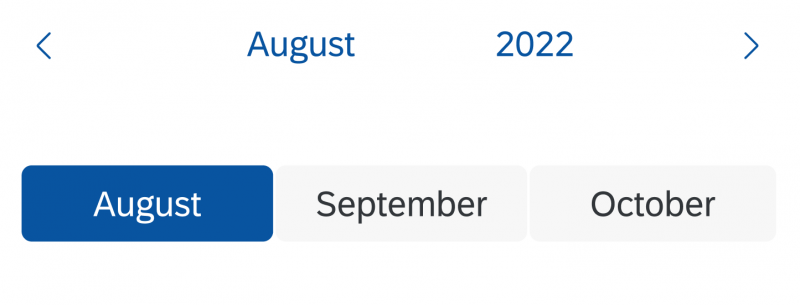
Navigation by Month

The user triggers month navigation mode by clicking the month link above the date range interval. The currently selected month is highlighted. Clicking a month switches the date range interval to the selected month. The user can browse the months by clicking the Previous and Next arrows.

Navigation by month
Navigation by month

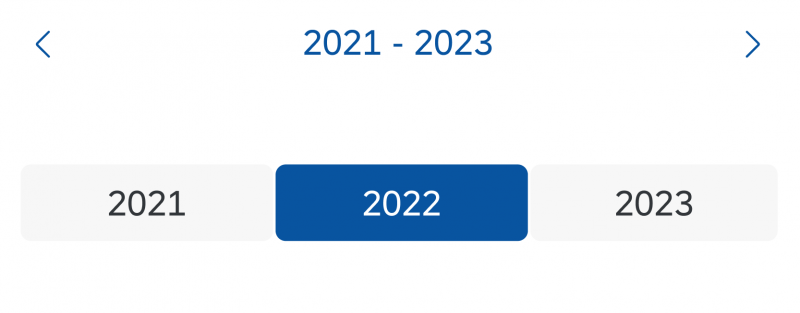
Navigation by Year

The user triggers year navigation mode by clicking the year link above the date range interval. The currently selected year is highlighted. Clicking a year switches the date range interval to the selected year. The user can browse the years by clicking the Previous and Next arrows.

Navigation by year
Navigation by year

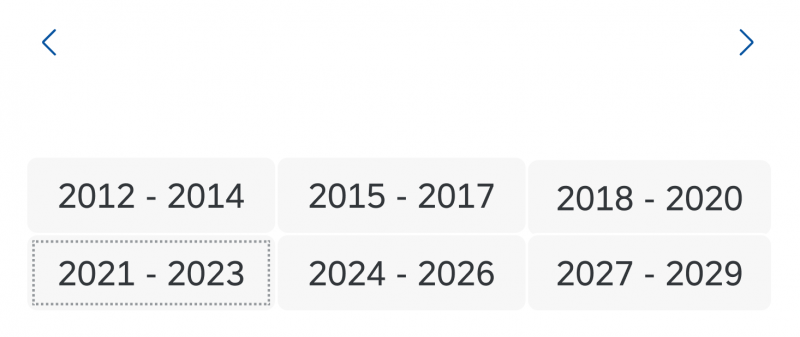
Navigation by Year Interval

The user triggers the year interval navigation mode by clicking the year interval above the year selection area. The year interval containing the currently selected year is highlighted. Clicking a year interval switches the year range to the selected set of years. The user can browse the year intervals with the Previous and Next arrows.

Navigation by year interval

Selection

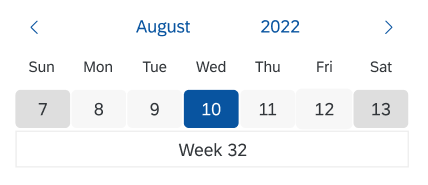
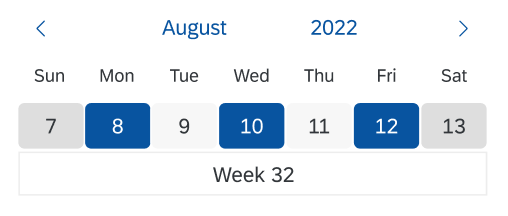
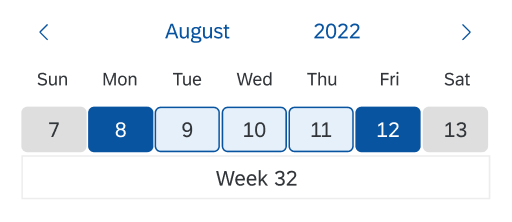
The calendar date interval control can be set up for single day selection, multiple day selection, or date range selection.

Single day

The user clicks an unselected day to select that particular day and deselect all previously selected days. Clicking a selected day a second time removes the selection. Only one day can be selected at a time. The selected day is highlighted.

Selection – Single day

Multiple days

The user clicks an unselected day to select that particular day. Clicking a selected day a second time removes the selection. Multiple days can be selected. Selected days are highlighted.

Selection – Multiple days

Date range

The user clicks an unselected day to select the start date. Clicking a second unselected day selects the end date. Both the start and end dates are highlighted. The days in between are highlighted in a lighter color. The minimum range is one day and only one range can be selected at a time.

Selection – Date range

Responsiveness

The horizontal space occupied by the control is already minimal, so the responsiveness is limited to the width of the control.

On small screens, the maximum number of days per range interval is automatically reduced to eight.

Cozy
Cozy
Compact
Compact

Examples

Calendar date interval displaying several weeks
Calendar date interval with a selection

Related Links

Elements and Controls

Implementation


Message Strip

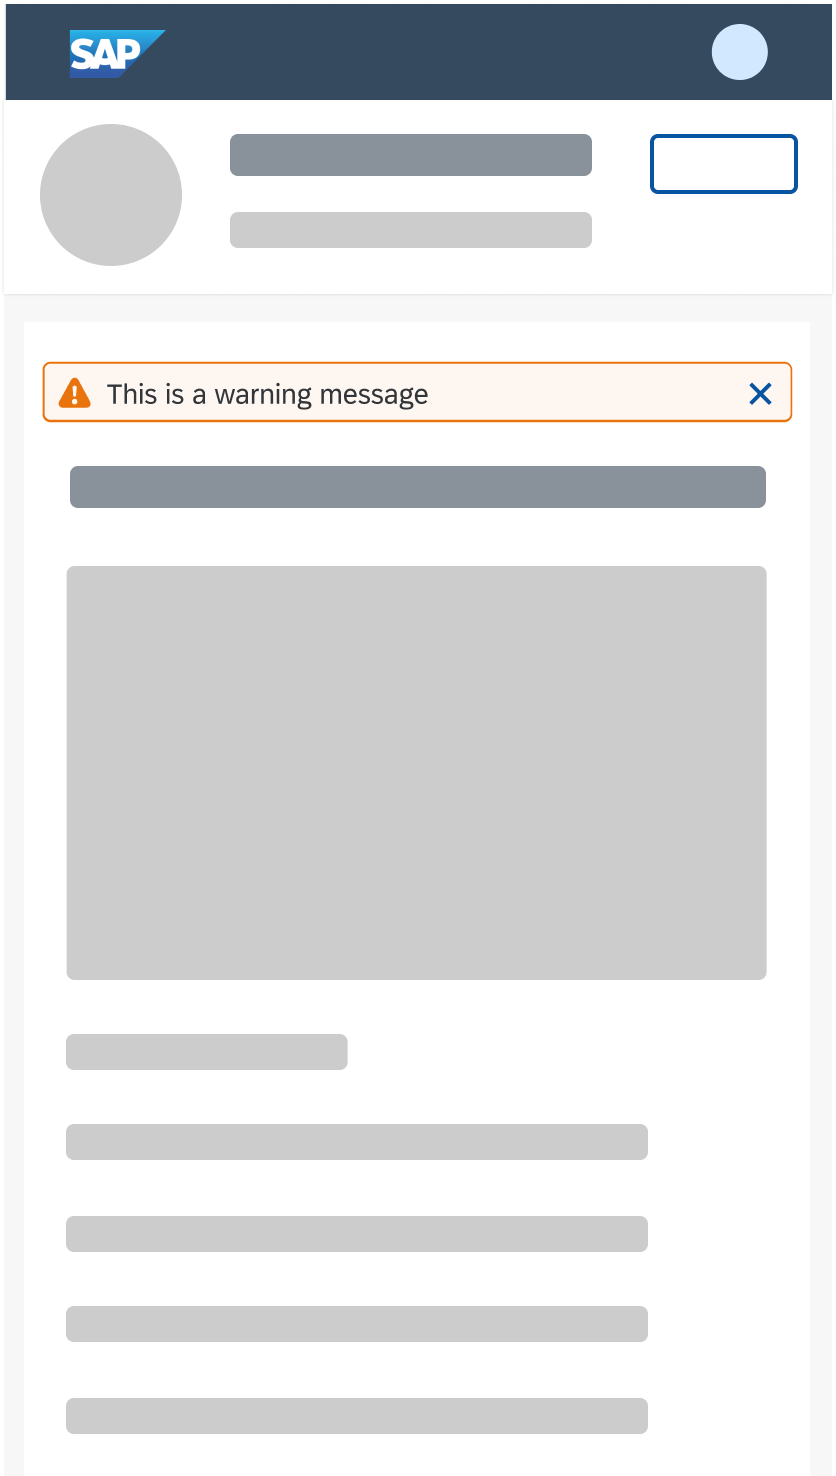
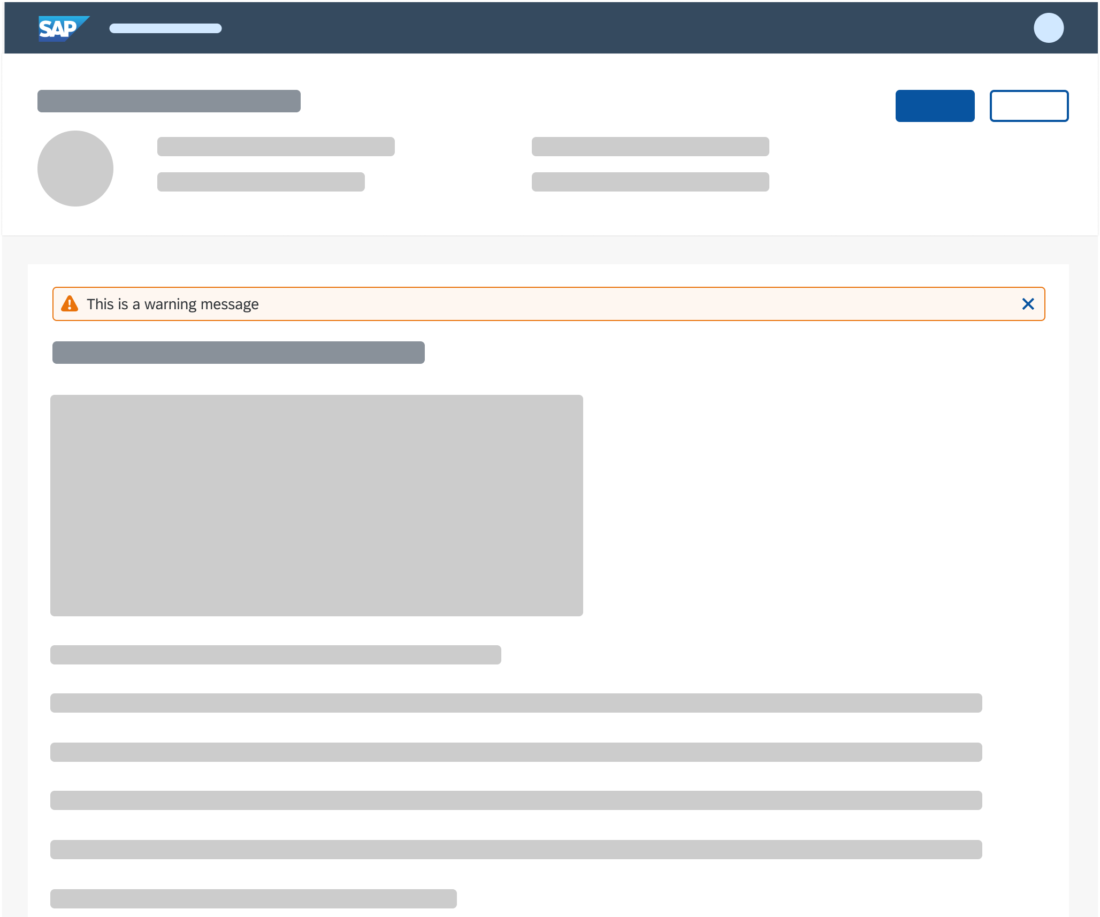
The message strip is a control that is used as an information bar. It contains information about an object or a status and can be embedded within the detail area of an object or page, or in the header of an object page.

Usage

Use the message strip if:

  • You want to provide information related to the object as a whole in the object header, such as the object status.
  • You want to provide information within the detail area of an object.
  • You want to inform your user about a status of an object.
  • You want to warn your user about an issue.

Do not use the message strip if:

  • You want to display information within a control, in the list of a list-detail layout, or above the page header.

Responsiveness

The message strip is fully responsive. Icons within the message strip are displayed to the left (custom icons) or right (Close action) of the message.  Text and links behave differently and wrap.

If you place the control within the detail area, it will always use 100% of the width and react to the responsiveness of the container.

Message strip on a smartphone (size S)
Message strip on a desktop (size L)

Types

The following semantic types are available.

  • Information
  • Warning
  • Error
  • Success
Different semantic types and colors

Behavior and Interaction

Static behavior

The message strip acts as an information bar. If you want to display a status related to an object, keep the interaction static and do not show the Close button.

Static behavior used to display a status

Interactive behavior

  • The app team can add a link in case more content is useful for the user to understand a situation.
  • Clicking the  Close button on the right-hand side hides the message strip. The app team can determine whether the message strip comes back on page reload, the next visit or never.
Interactive behavior with 'Close' function

Accessibility

When an application adds a message strip dynamically, also notify screen reader users.

Use the following structure for the screen reader notification text:

“New information bar of type <Error / Warning / Success / Information>: <text of message>”

To avoid an endless screen reader announcement, send a short message summary with only the most relevant information.

Properties

sap.m.MessageStrip is limited to the following properties:

  • Property:showIcon – Allows you to display an icon before the text
  • Property:customIcon – Allows you to display an icon from the icon library
  • Property:type – Changes the semantic color and the icon in front of the message strip
  • Property:text – Adds text to the control
  • Property:link – Adds a link
  • Property:showCloseButton – Adds a Close button

Resources

Elements and Controls

Implementation

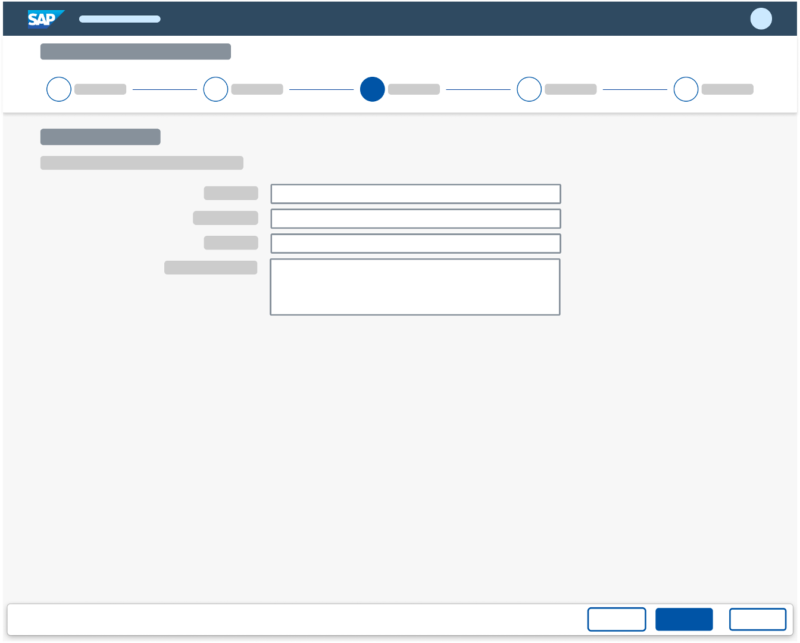
Wizard Floorplan

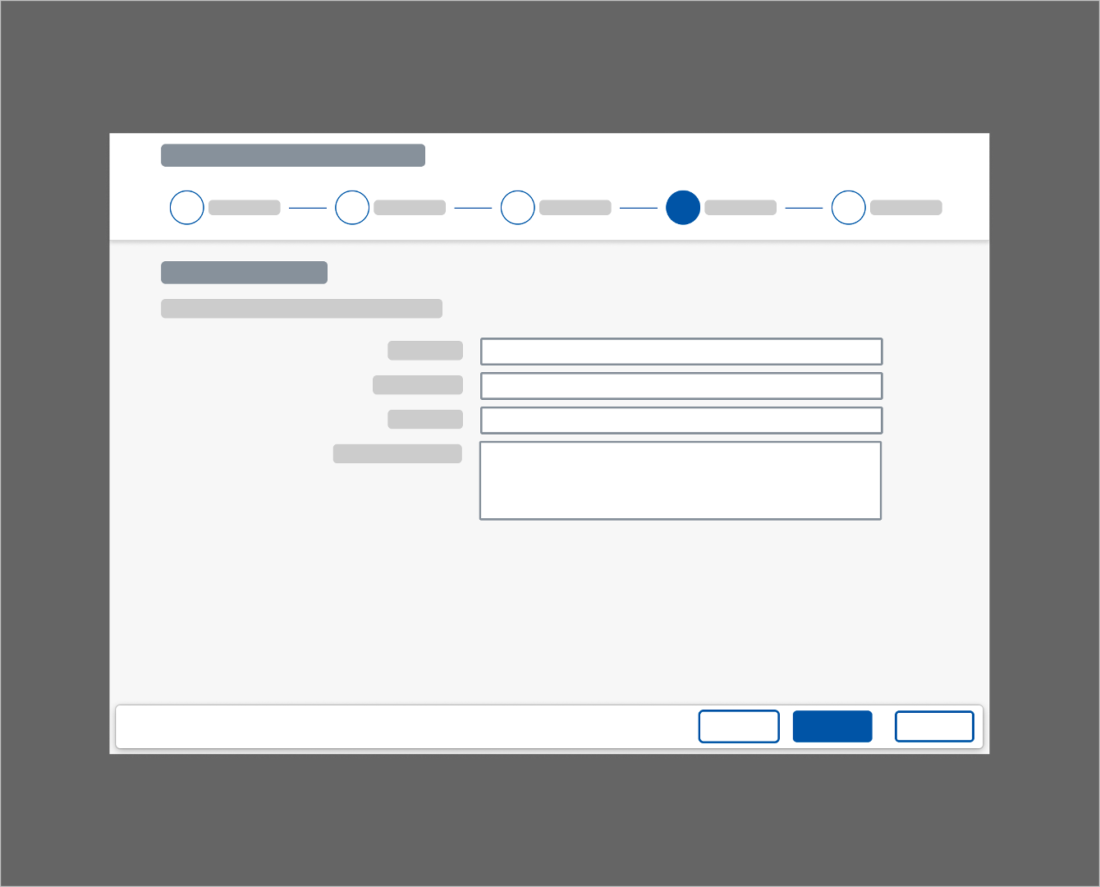
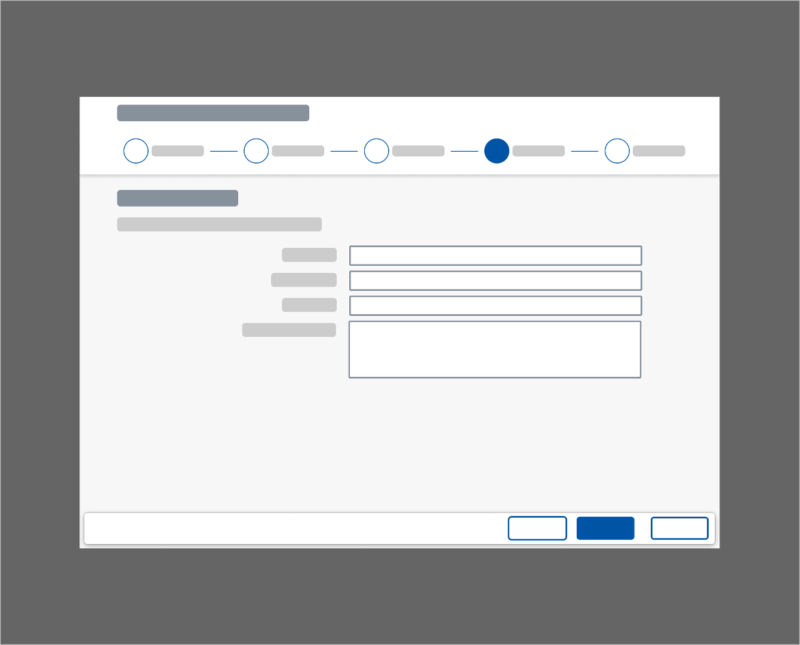
The wizard floorplan allows users to complete a long or unfamiliar task by dividing it into sections and guiding the user through it. The wizard consists of the walkthrough screen, where the form sections are revealed in sequence after each one is completed, and the summary page, where the form is displayed in read-only mode for assessment and final submission. In general, you can use the wizard both in full screen mode and in a modal dialog. Beyond that, the wizard in full screen mode can also be used in a flexible column layout.

Wizard in full screen mode - Steps
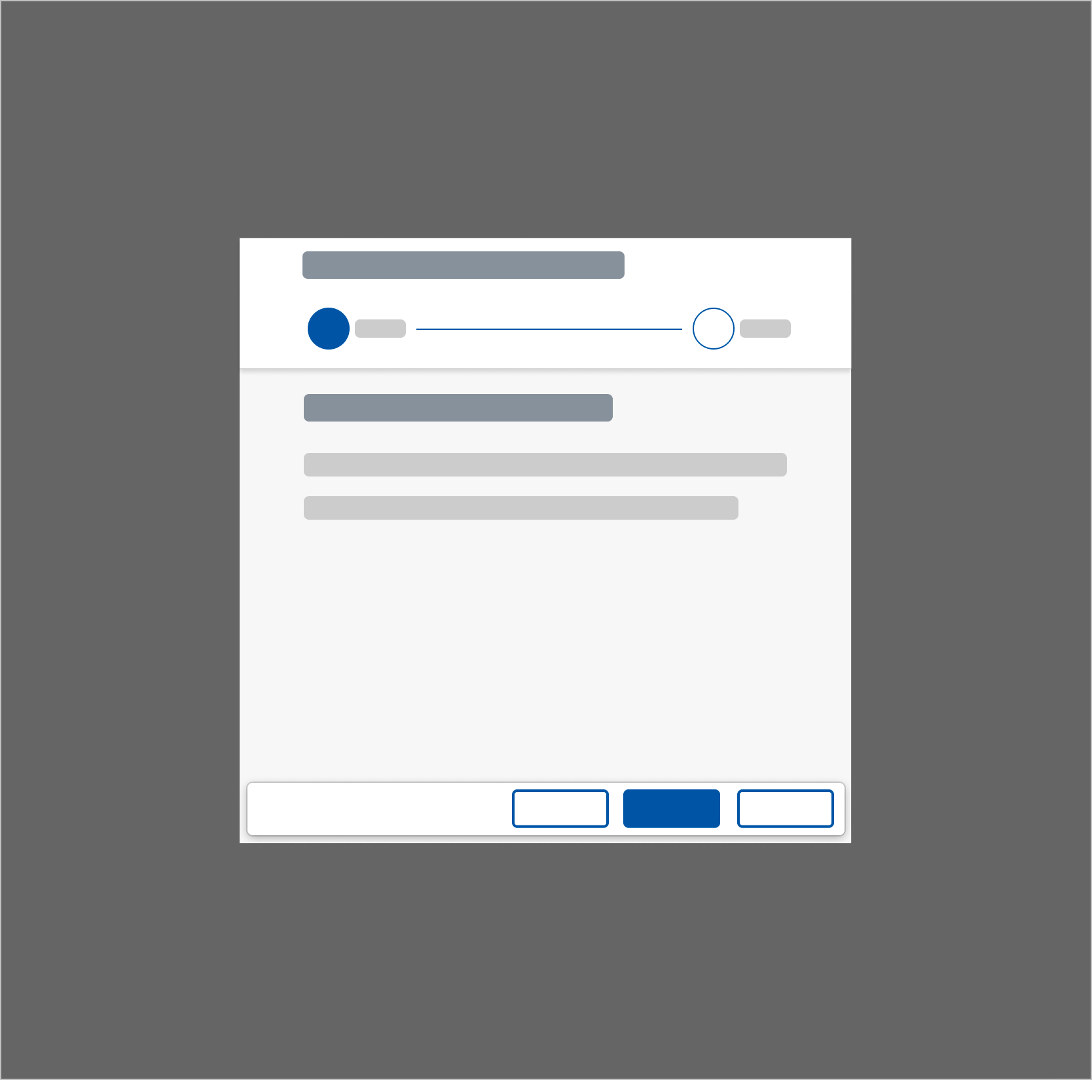
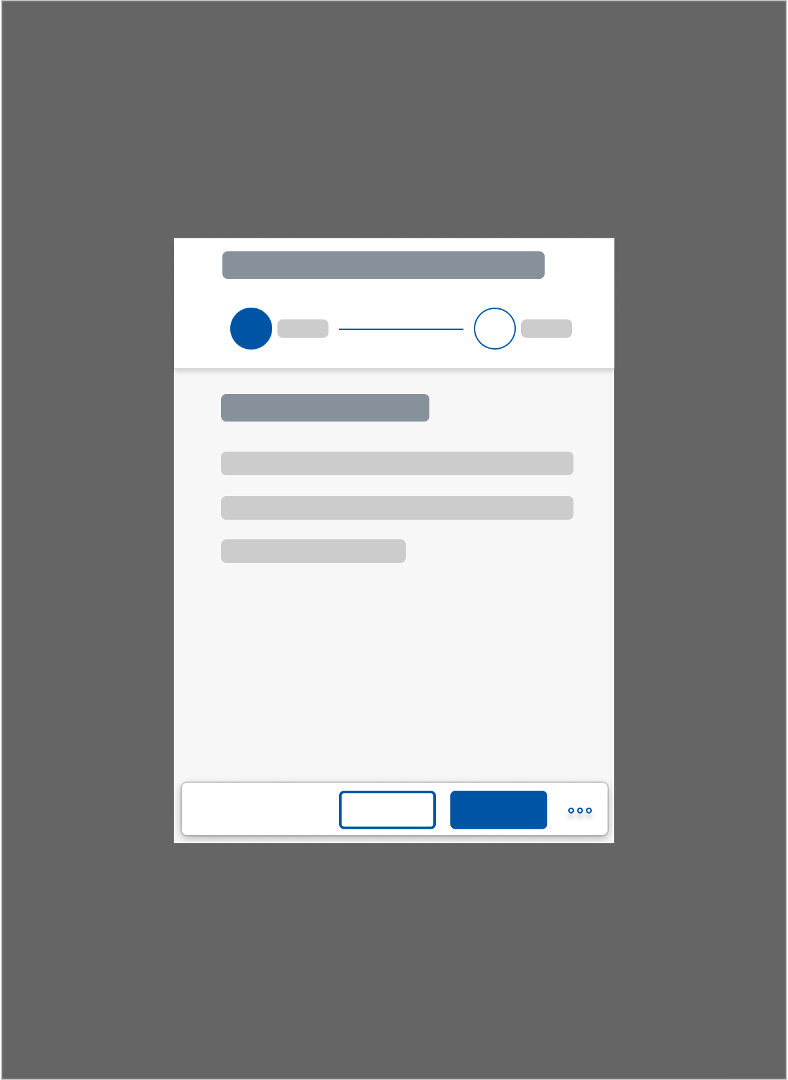
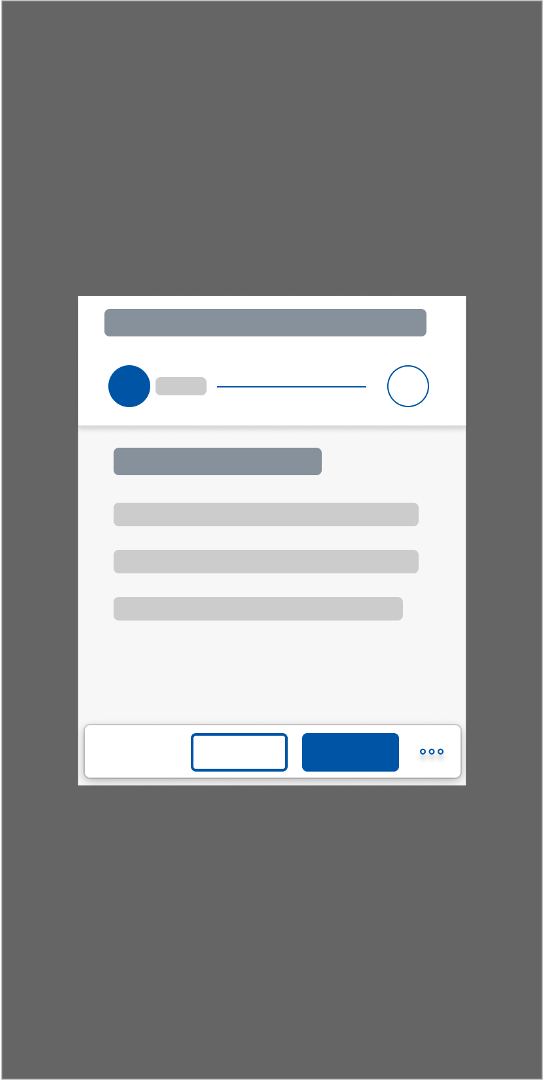
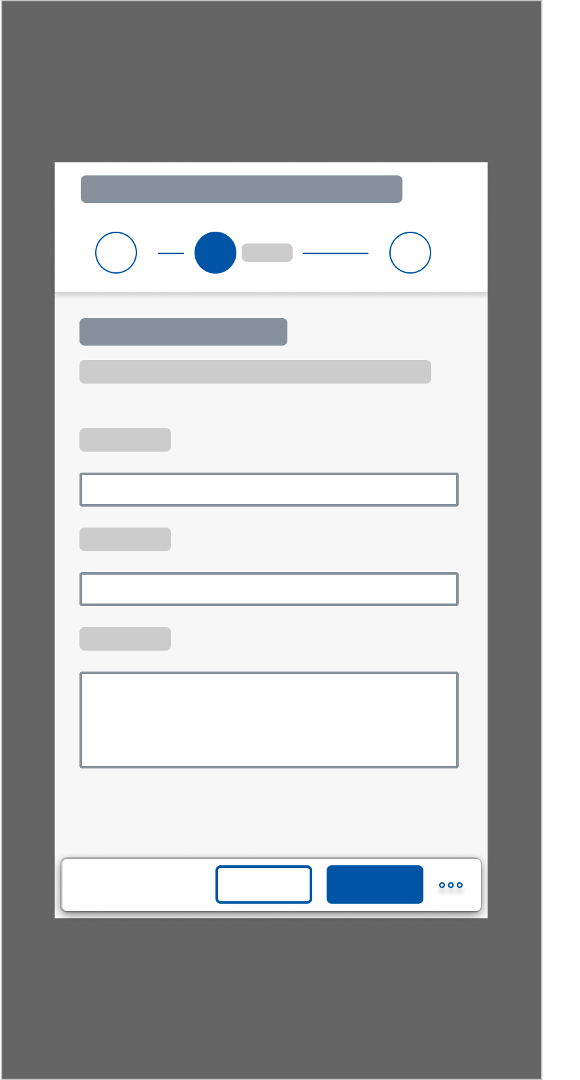
Wizard in a modal dialog - Steps

Usage

Wizard in Full Screen Mode

When to Use the Wizard Floorplan

The wizard aims to help users by dividing large or complex tasks into segments. Use the wizard if the user has to accomplish a long task (such as filling out a long questionnaire) or a task that is unfamiliar to the user. The flow should consist of a minimum of 3 and a maximum of 8 steps.

You can use the wizard for both create and edit scenarios. For edit scenarios, you can either offer a wizard or let users edit the object page directly, depending on your use case.

When Not to Use the Wizard Floorplan

If you have a task with only 2 steps or a format that the user is familiar with (for example, it is part of their daily routine), do not use the wizard as it only adds unnecessary clicks to the process. If your process needs more than 8 steps, the wizard will not support those steps, as the process is too long and can be confusing for the user. In this case, consider restructuring the task.

Consider whether the classic edit screens (edit flow or object page) are more suitable for your use case.

Wizard in a Modal Dialog

When to Use the Wizard in a Modal Dialog

We recommend using the wizard in a modal dialog if:

  • The wizard is closely connected to the triggering page, and the user needs to return to that page quickly.
  • Users need to be able to open the wizard from any part of the product/page.
  • The size of the wizard needs to be flexible.

When Not to Use the Wizard in a Modal Dialog

Don’t use the wizard in a modal dialog if the app you are using is a standalone application that has no relation to the page it has been triggered from. Instead, use it in a full screen layout.

Structure

The wizard has two screens: the walkthrough screen, where users complete a segmented task, and the summary screen, where they can check the data they are about to submit. Wizard content is not restricted to forms; you can also use other elements, such as a value help dialog.

Walkthrough Screen

After triggering the wizard from a floorplan, the user is taken to the main walkthrough screen, which shows only the first section of the form. Users can also trigger the wizard app from another application, from the launchpad, or from a notification. The wizard always starts at the initial walkthrough page and ends after the user has clicked the main action (such as Create or Submit) on the summary screen.

The wizard comes with two different behaviors, which have different navigation patterns. Their usage depends on the use case.

Anchor Bar / One-Page Behavior

The anchor bar behaves in the same way as the anchor bar in an object page. It consists of a series of links (steps) that are arranged horizontally at the top of the page. Clicking a link navigates to the respective step on the page.

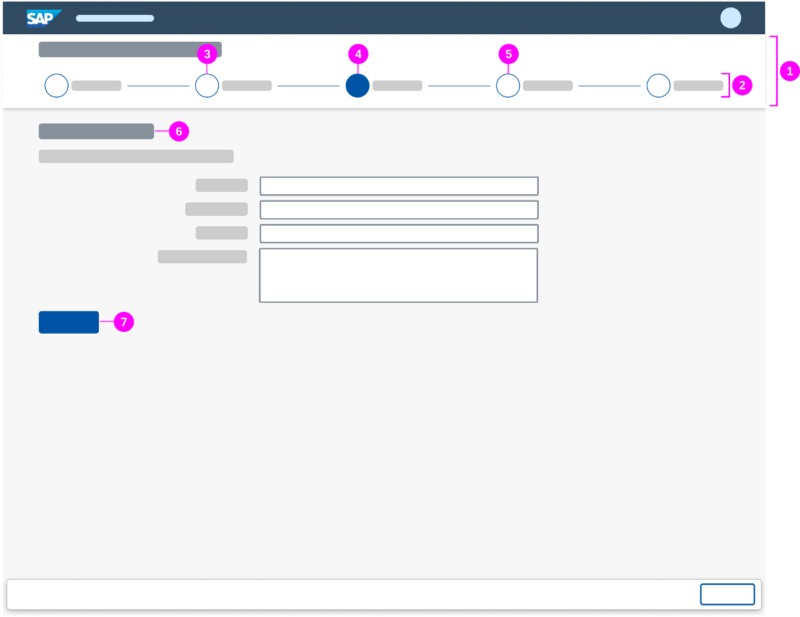
The Next Step button is only used on the walkthrough page. Once the user has filled out all the necessary fields, a Next Step button appears below the content, which allows the user to continue with the next section of the form. If the user needs to navigate to the previous section of the form, it is possible either to scroll up the page or to navigate back by using the progress bar. When the user has completed the last section of the wizard, the button label changes to Review, and the user is taken to the summary screen. On the summary screen, the user can use either the Edit button in the footer or the Back arrow to return to the wizard and edit any of the fields. The wizard footer is used to display the Cancel button, which exits the wizard. If the user has modified any fields, a data loss warning appears. If the form is long, and the user may have to save it before finishing, you can offer a Save as Draft option in the footer.

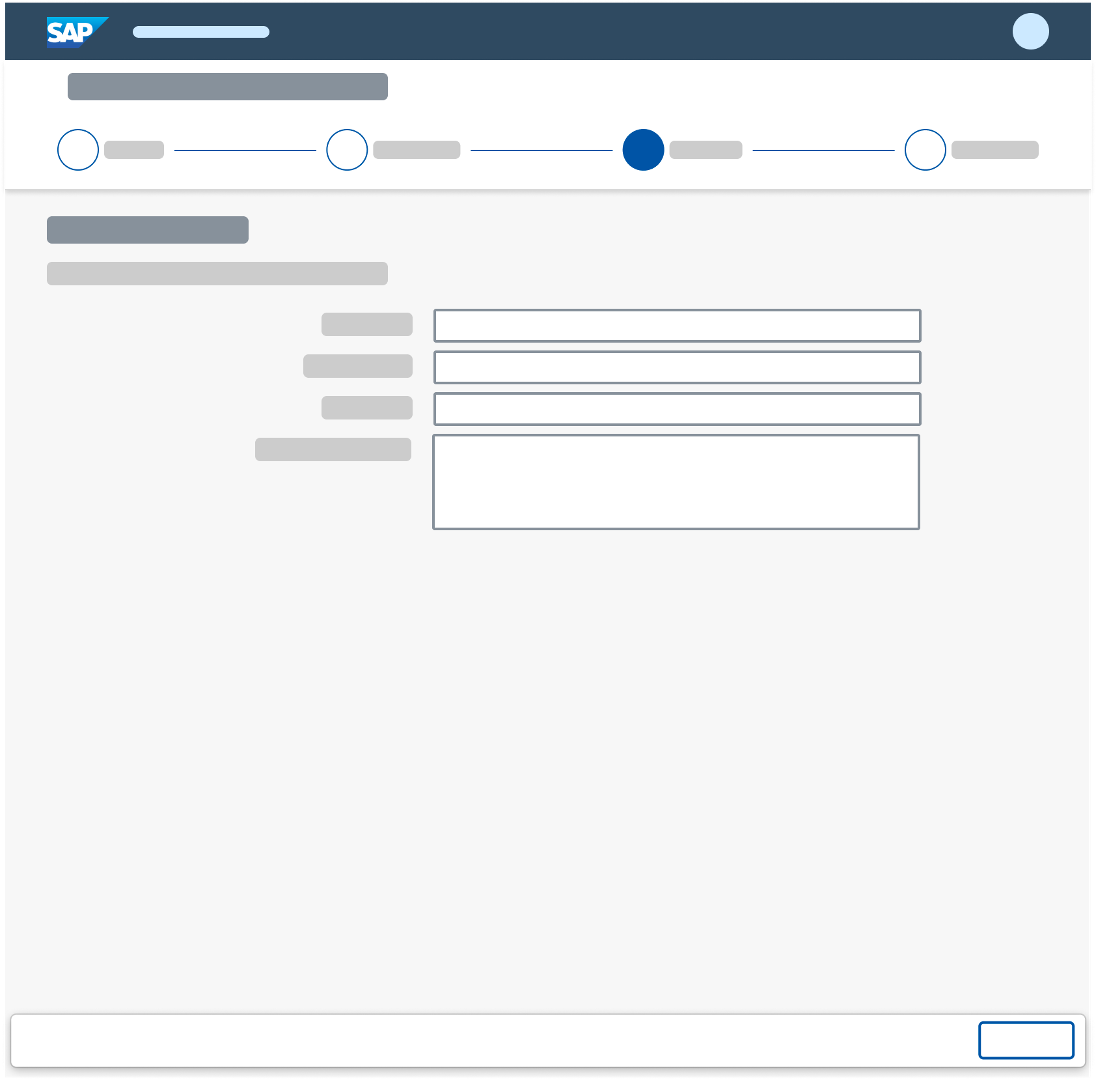
Walkthrough screen in full screen layout used with an anchor bar
  1. Header toolbar with title
  2. Progress bar
  3. Completed step
  4. Current step
  5. Upcoming step
  6. Step title (for example: 3. Payment)
  7. Action for the next step

Tab Bar

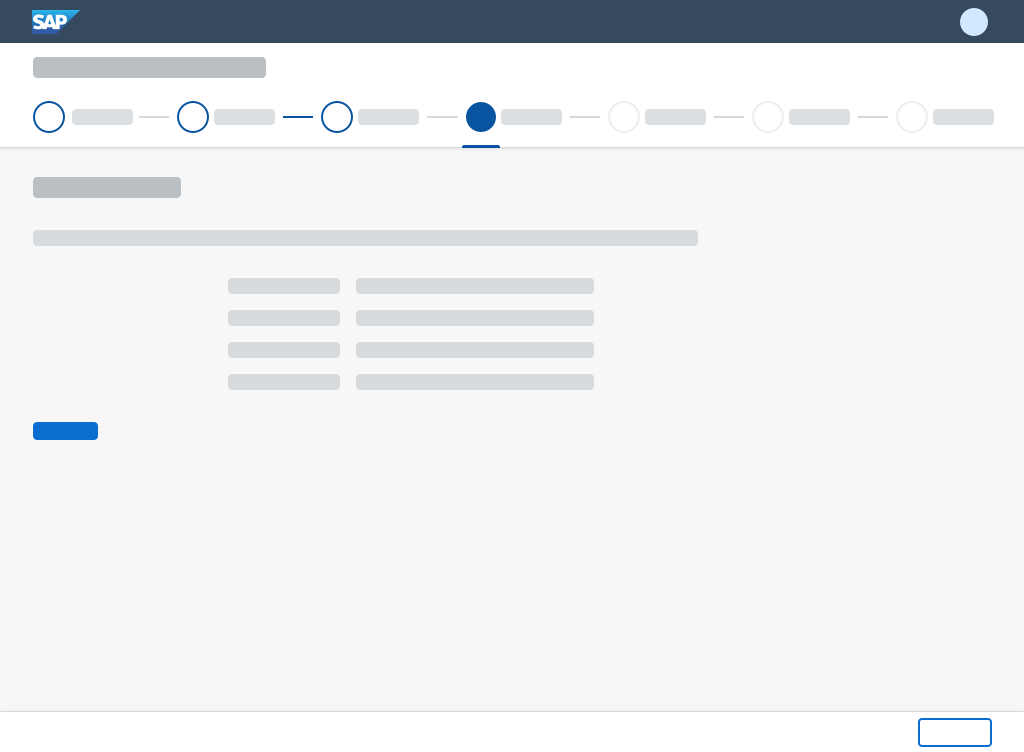
As an alternative to the anchor bar, you can also use the tab mode (property: rendermode, value: Page). It is visualized in the same way, but shows a series of tabs (steps). These are arranged horizontally at the top of the page and each represents a subpage. Clicking a tab displays the respective subpage.

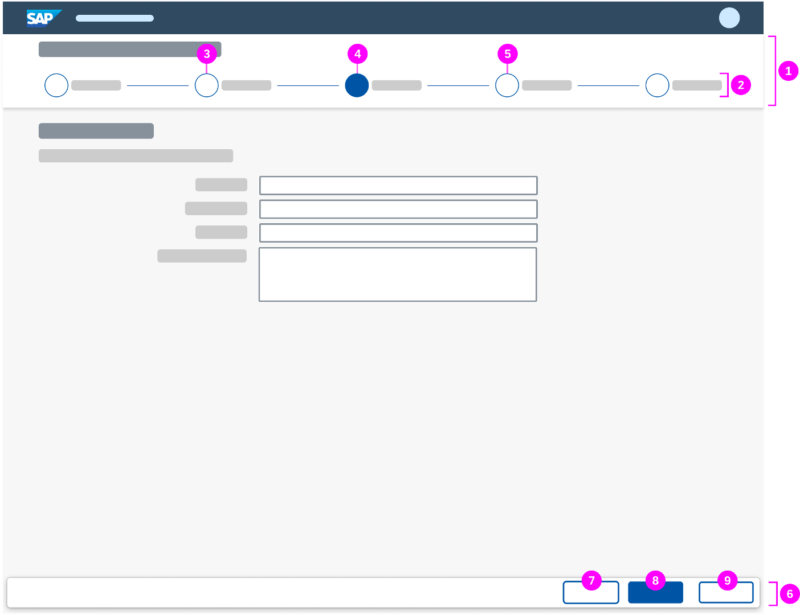
Unlike the anchor bar, the tab bar comprises not only a Next Step button but also a Previous Step button. Place the Next Step button in the footer toolbar, as in the summary screen. As soon as users move to the following step, show an additional Previous Step button on the left. This follows the guidance for action placement: if the primary action (such as Next Step) is a forward path, it needs to appear to the right of the secondary action. In the case of the wizard, the secondary action is Previous Step. The negative path action Cancel remains unchanged.

After filling out all the necessary fields for a step, the user can navigate to the next step by clicking the Next Step button. To navigate back to the previous step, the user can either click the Previous Step button or use the progress bar at the top of the wizard. If you use tabs, each tab is a single wizard step.

When the user has completed the last wizard step of the walkthrough screen, the Next Step button changes to Review, and the user is taken to the summary screen. Since the tab bar is also used for the summary screen, the user can either use the Previous Step button to return to the prior wizard step or use the Next Step button, which changes to the Create/Submit button to finalize the wizard application.

To go back and edit entries for single wizard steps, the user can either use the Edit buttons on the summary screen or select the step in the progress bar. Beneath the Next Step/Previous Step buttons for processing the wizard, the wizard footer toolbar is also used to display the Cancel button, which exits the wizard.

If the user has modified any fields and navigates away, a data loss warning appears. If the form is long, and the user may have to save it before finishing, you can offer a Save as Draft option in the footer.

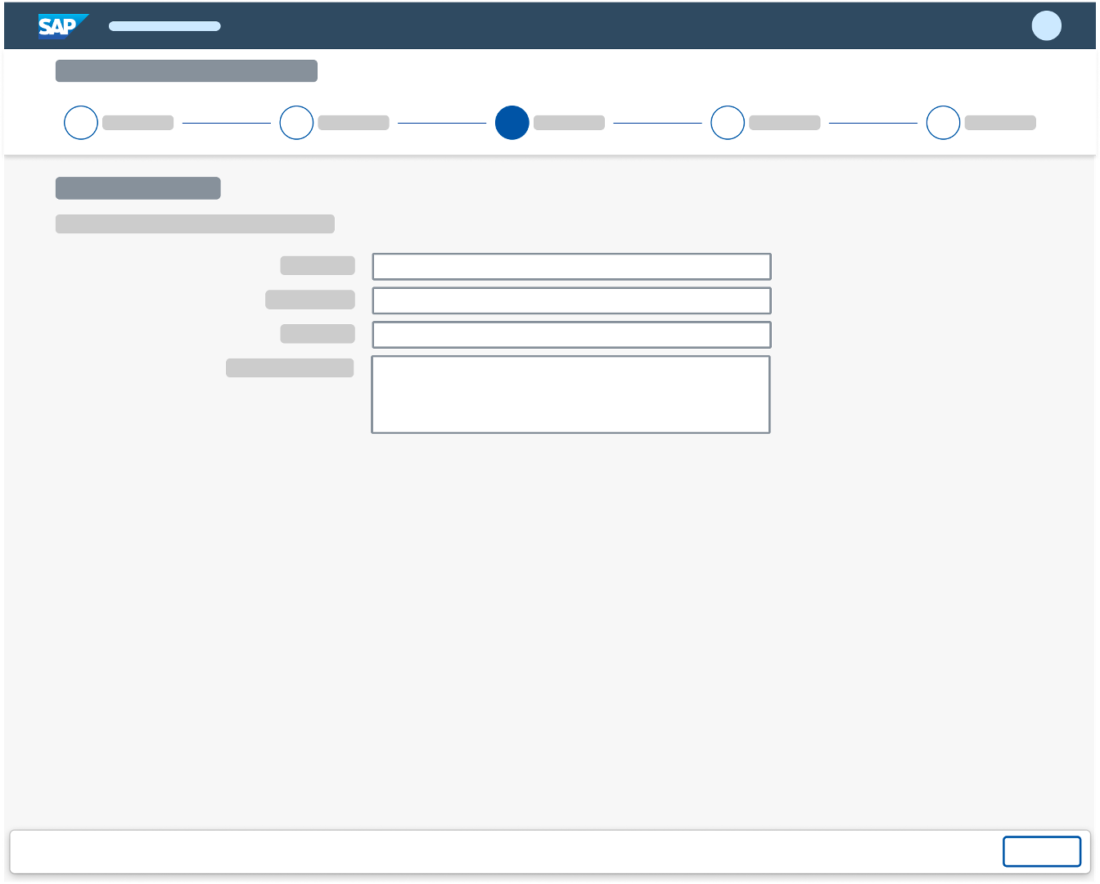
Walkthrough screen in full screen layout used with a tab bar
  1. Dynamic page header with title
  2. Progress bar
  3. Completed step
  4. Current step
  5. Upcoming step
  6. Dynamic page footer toolbar
  7. Previous step button
  8. Next step/finalizing button
  9. Cancel button to exit wizard

The title in the header toolbar above the wizard remains unchanged during all the wizard steps. Align this title left, and make it clear to users where they are and what they are doing (for example, New Sales Order or Sales Order 4815162342). Especially in edit scenarios, it is vital to give users a unique identifier for the object they are changing.

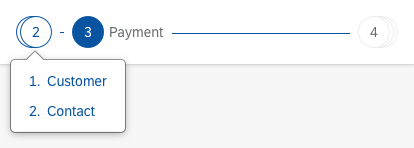
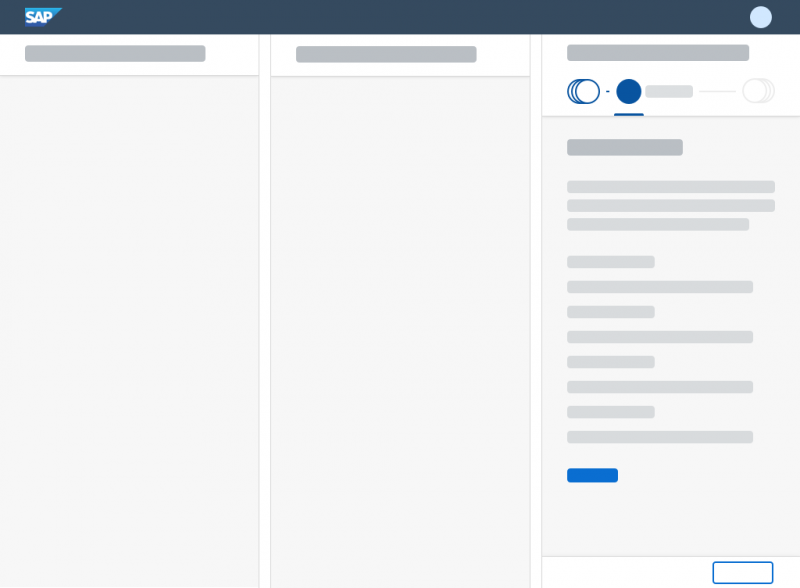
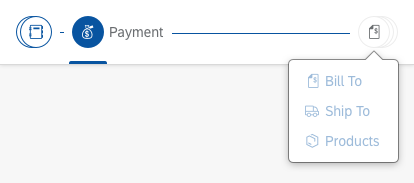
The progress bar below the header highlights the completed steps and the current step. It also allows the user to navigate between steps by clicking any of the circles. If there are multiple steps, and the screen width is reduced, the steps on the progress bar are grouped. This behavior is the same on smartphone, tablet, and desktop screens.

Wizard tooltip – Grouped steps

In certain use cases, the steps in the wizard depend on the choices the user makes along the way. The user’s entries for one step determine the follow-on steps (“branching”). In these cases, a dotted line shows that more steps will follow.

Wizard branching
Wizard branching

Since the wizard is a lightweight way to create or edit objects, applications can use a quick confirmation popover instead of the heavier data loss message when the user selects Cancel.

If the wizard is used to create an object, the text in the popover should read Discard this <object>?’ . If the wizard is used to edit an object, use the text Discard changes? In both cases, use Discard as the action on the popover.

Structure – Quick confirmation

Modifying dependent steps: If there are steps that depend on each other (for example, a selection in step 2 triggers an additional step), and the user modifies the parent step, the dependent step is changed or deleted. Beforehand, the user is warned that data will be lost.

Summary Screen

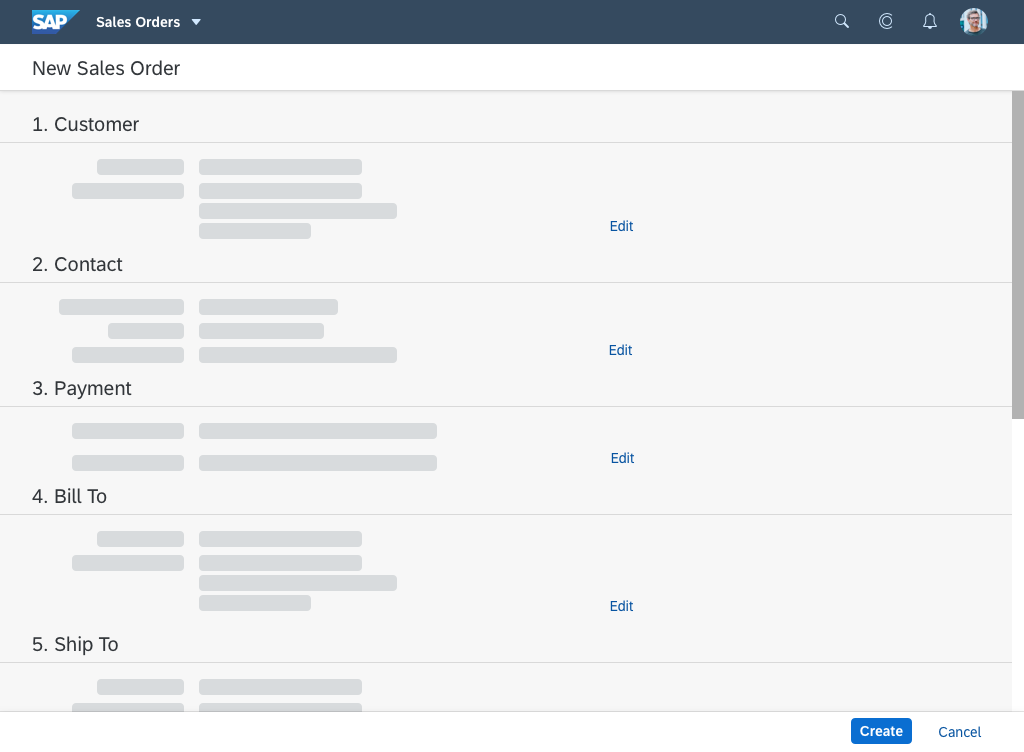
On the summary screen, users can check all their entries before the object is actually created or changed. Depending on the use case, and whether the wizard is used with an anchor bar or a tab bar, the structure of the summary screen differs.

  • If the wizard is used with an anchor bar, the summary screen has no progress bar or anchor navigation, and shows the form sections for all the steps in read-only mode.
  • If the wizard is used with a tab bar, the summary screen is included as a step in the progress bar, and therefore the progress bar and the tab bar are still visible. It shows the form sections for all the steps.

To allow the user to go back and edit entries, provide an Edit button in each form section. Alternatively, users can click the Previous Step button or scroll up to go to the previous step/section.

On the summary page, show the finalizing action, such as Create or Save.

Wizard summary page example

Layout

The wizard floorplan can be used in both the full screen layout and in a modal dialog. Thanks to its responsive behavior, it is also possible to use the full screen layout in the flexible column layout. Since there are no subsequent pages after the wizard, it always occupies the rightmost column – there is no navigation from the wizard to a subsequent page. After completing (or canceling) the wizard, the user is always returned to the triggering page.

Wizard in full screen layout used with tab bar
Wizard in a modal dialog used with tab bar
Wizard in full screen layout used with anchor bar
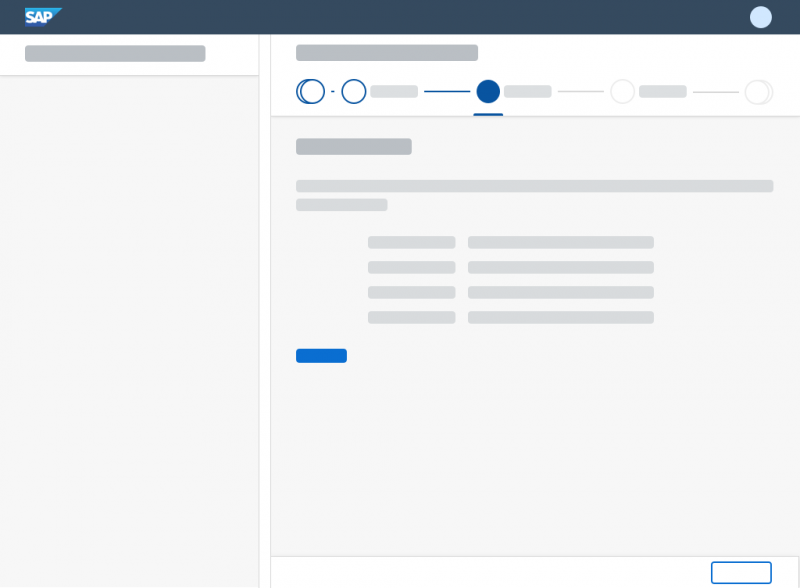
Wizard in flexible column layout (2/3)
Wizard in flexible column layout (1/3)

Types

There are two types of wizard – “standard” and “branching” – which differ in terms of the functions they offer.

Use the standard type if:

  • The total number of steps is known in advance.
  • The number of steps does not change during usage.
  • There is linear progression from one step to the next.

Use the branching type if:

  • The total number of steps is not known.
  • The number of steps may change during usage.
  • There is non-linear progression. In other words, the user’s choice during one step determines which step comes next.

In both types of wizard you can let users skip steps. Label these steps as “Optional”.

Styles

In addition to the functional types, there are also different visual styles.

Numbers and Icons

By default, both versions use a number inside a circle to represent each step. You can also use icons instead of numbers to help users identify the steps. If you plan to use icons, be sure to assign icons to all the steps (not just to some). Always choose unique, clearly distinguishable icons for each step.

Steps represented by numbers
Steps represented by icons

Labels

To help users identify the individual steps even more easily, app developers can assign labels. As with icons, labels must be applied to all or none of the steps.

If there is enough horizontal space, all labels are shown.

All labels are visible

As the width is reduced, the label is only shown for the currently selected step.

Labels - reduced width

The unselected and outermost steps are stacked on top of each other to further accommodate the reduced space.

Stacked labels
Stacked labels

To access steps inside a stack, users click can open a list of hidden steps.

Labels - stacked popover

Optional Steps

For optional steps, add an (Optional) label. Place the (Optional) label below the content label for the step.

Do
Correct: '(Optional)' label below the content label for the step

Explanatory Texts

Ideally, the headlines and field labels for each step should provide enough information for users to complete their tasks. However, if additional explanations are needed, applications can put a simple text underneath a step headline – either via the sap.m.Text or the sap.m.FormattedText control.

Responsiveness and Adaptiveness

The wizard floorplan is available in the sizes: S, M, L and XL. This is also applicable to the wizard in a modal dialog.

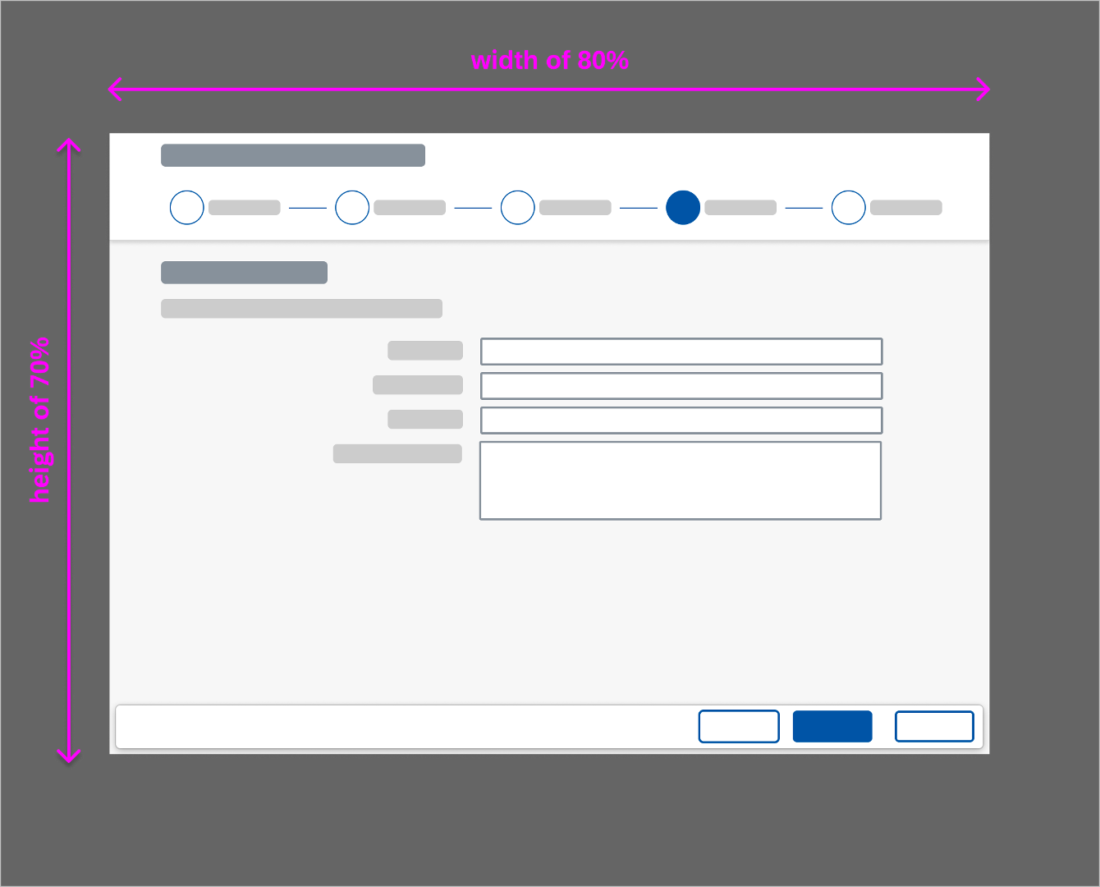
As the size being used highly orientates on the content and the space that is needed for it, there aren’t any fixed sizes available. For a wizard with a lot of content, in modal dialog it is recommended to use width of 80% and height of 70%. For less content, the size of the modal dialog should match the content.

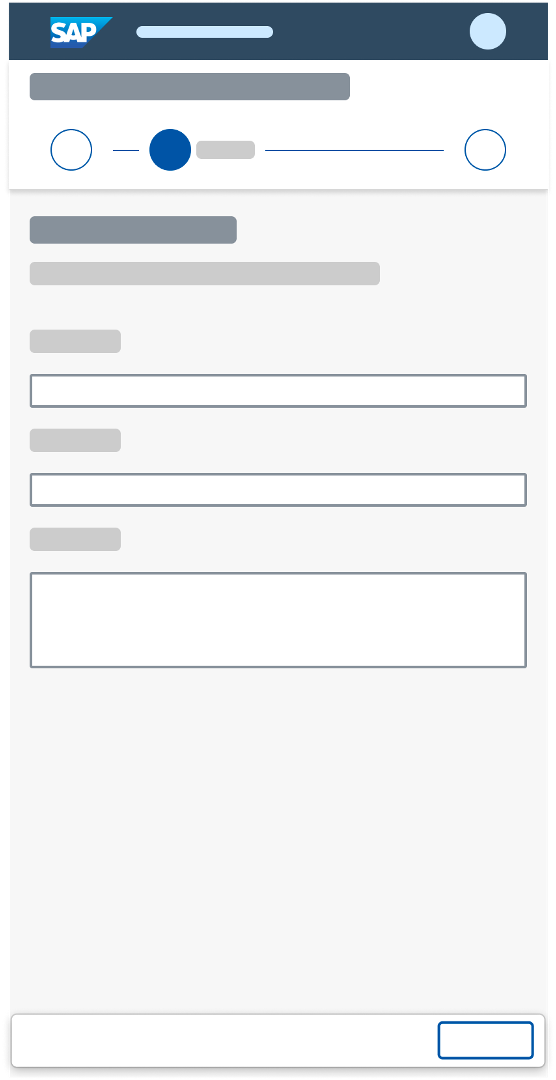
Wizard - Size L
Wizard - Size L
Wizard - Size M
Wizard - Size M
Wizard - Size S
Wizard - Size S
Wizard modal dialog - Size L
Wizard modal dialog - Size M
Wizard modal dialog - Size S

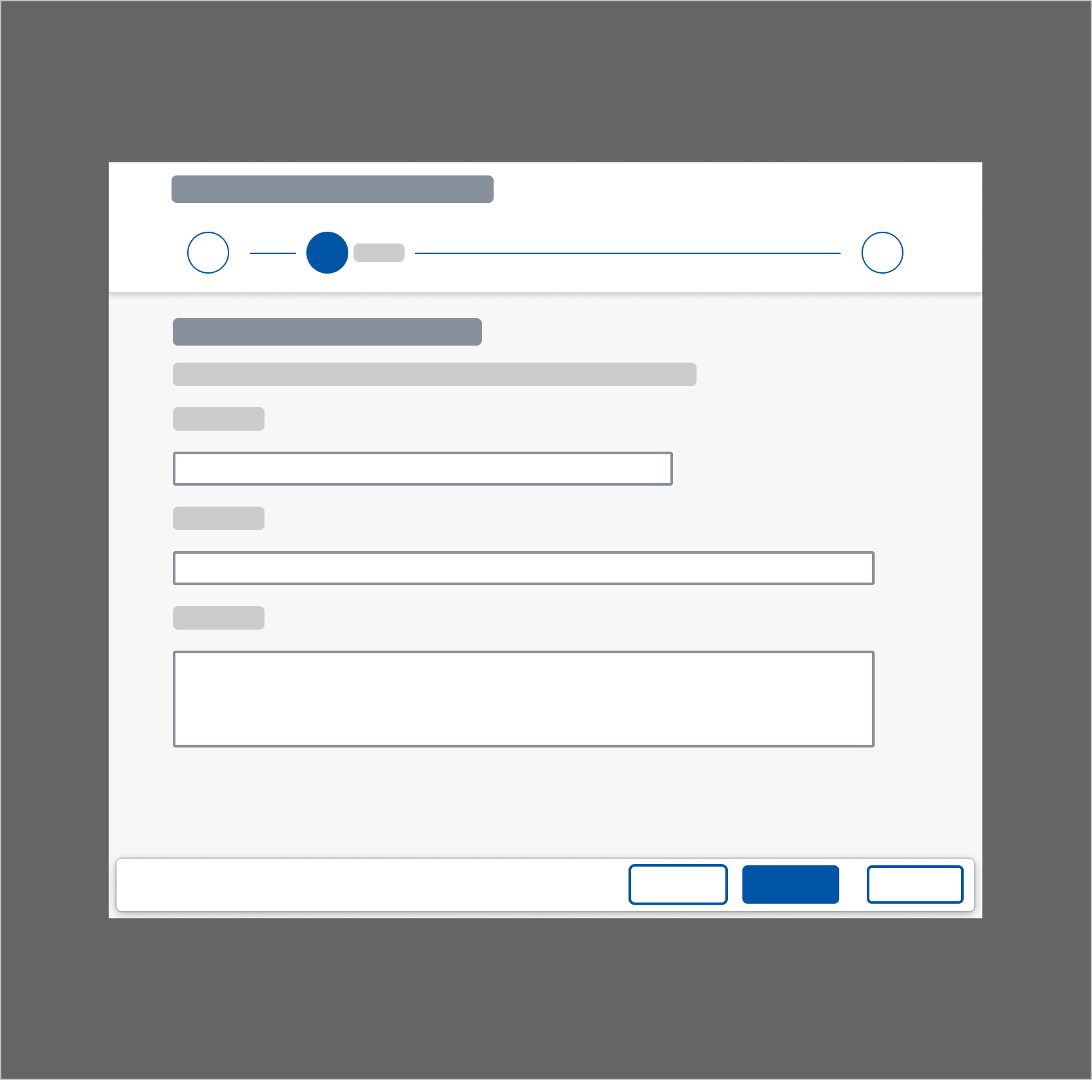
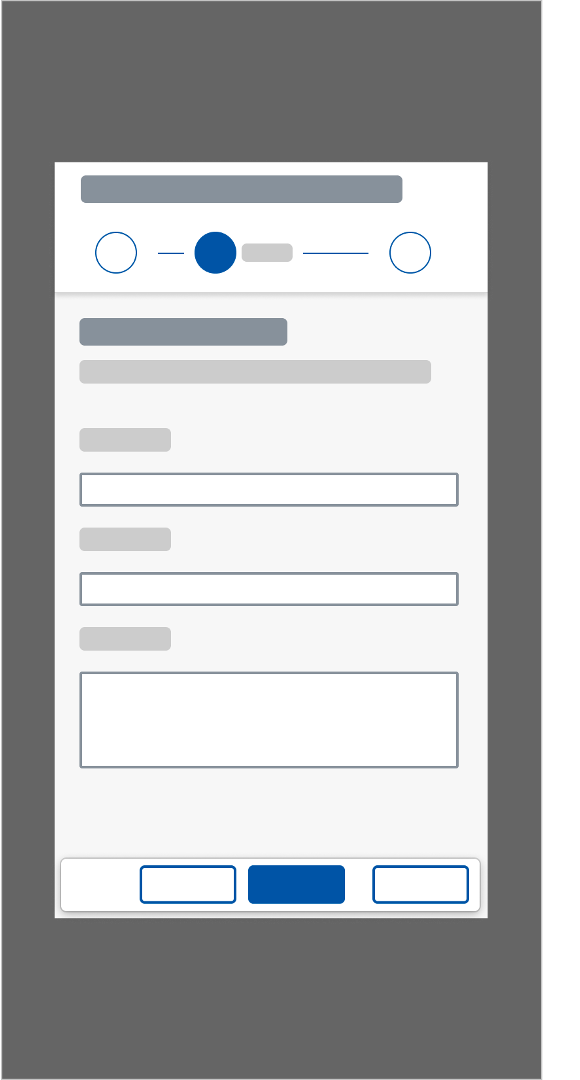
If there is not much content available with a lot of whitespace around it, the wizard in a modal dialog could look like this:

Micro wizard - Size M (1)
Micro wizard - Size M (2)
Micro wizard - Size S

The wizard in full screen layout as well as in the modal dialog supports all common screen sizes and is available in cozy and compact modes, as well as high-contrast black (HCB).

On small screen if the space needed for the action buttons located in the footer toolbar (Previous/Next step) is not enough an overflow appears on the right side, containing the cancel button.

Wizard modal dialog overflow behavior - Size S

Behavior and Interaction

Initial Focus

When the wizard is first loaded, focus on the first editable control in the first step.

Exceptions:

  • The user opens a page using a link that jumps directly to a specific step. In this case, focus on the first editable control in this step.
  • The user opens the wizard using one of the Edit actions from the review screen. In this case, focus on the first editable control in the selected editing step.

Error and Draft Handling

Error Handling

Error handling is done via message popovers. When the user clicks the button for the next step, the form sections and fields are validated. When the user clicks the Create button on the summary page, the entire form is validated. If there are any errors, the message popover is displayed, and clicking any of the error items scrolls the page to the relevant field, which is also highlighted in red.
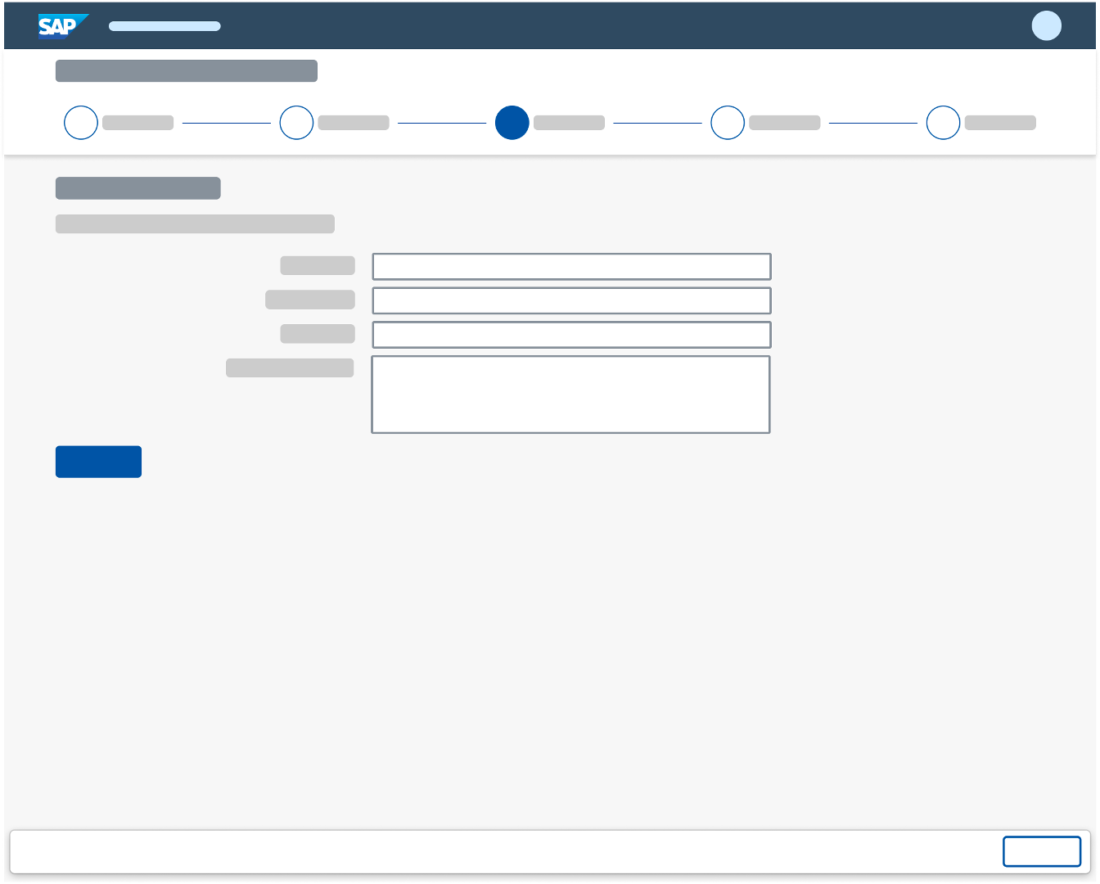
Section validation differs from validation of the entire form:

  • Section validation: Validates the entries in the form fields.
  • Form validation: Checks the entire form for back-end system errors (such as duplicated data entry).

Draft Handling

If a draft already exists when a user enters the wizard, show a dialog to inform the user. For more information, see Draft Handling.

Expand to Full Screen

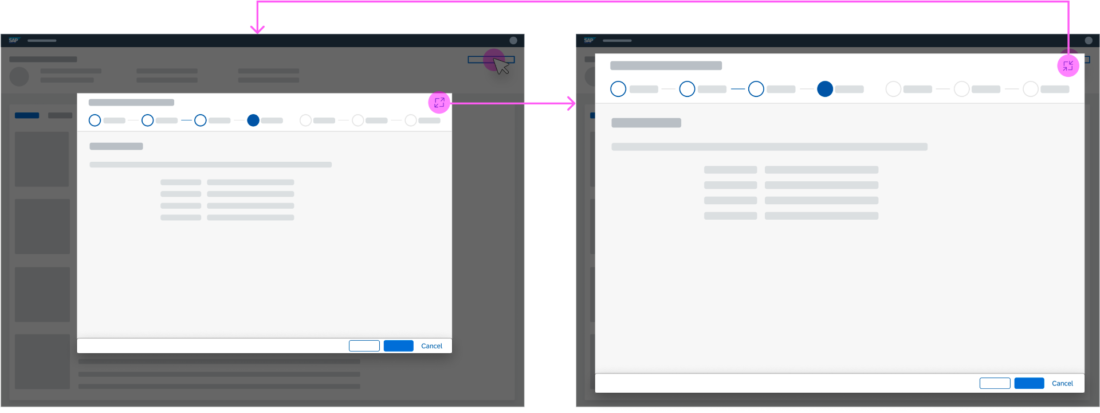
If the wizard is displayed in a modal dialog, the user can switch between the standard size and a near full screen size. This is done by clicking the Enter Full Screen icon  on the top-right corner.

Wizard modal dialog - Expand to near full screen size

Resizing & Dragging

Resizing

If the wizard is in a modal dialog, we advise against allowing users to resize the dialog freely. This distracts users and prevents them from solving their tasks quickly.

Dragging

If the wizard is in a modal dialog, you can allow users to drag and drop the dialog to a different position on the page by clicking on the top of the dialog window. This can be helpful if the user needs information from the underlying page.

Busy States

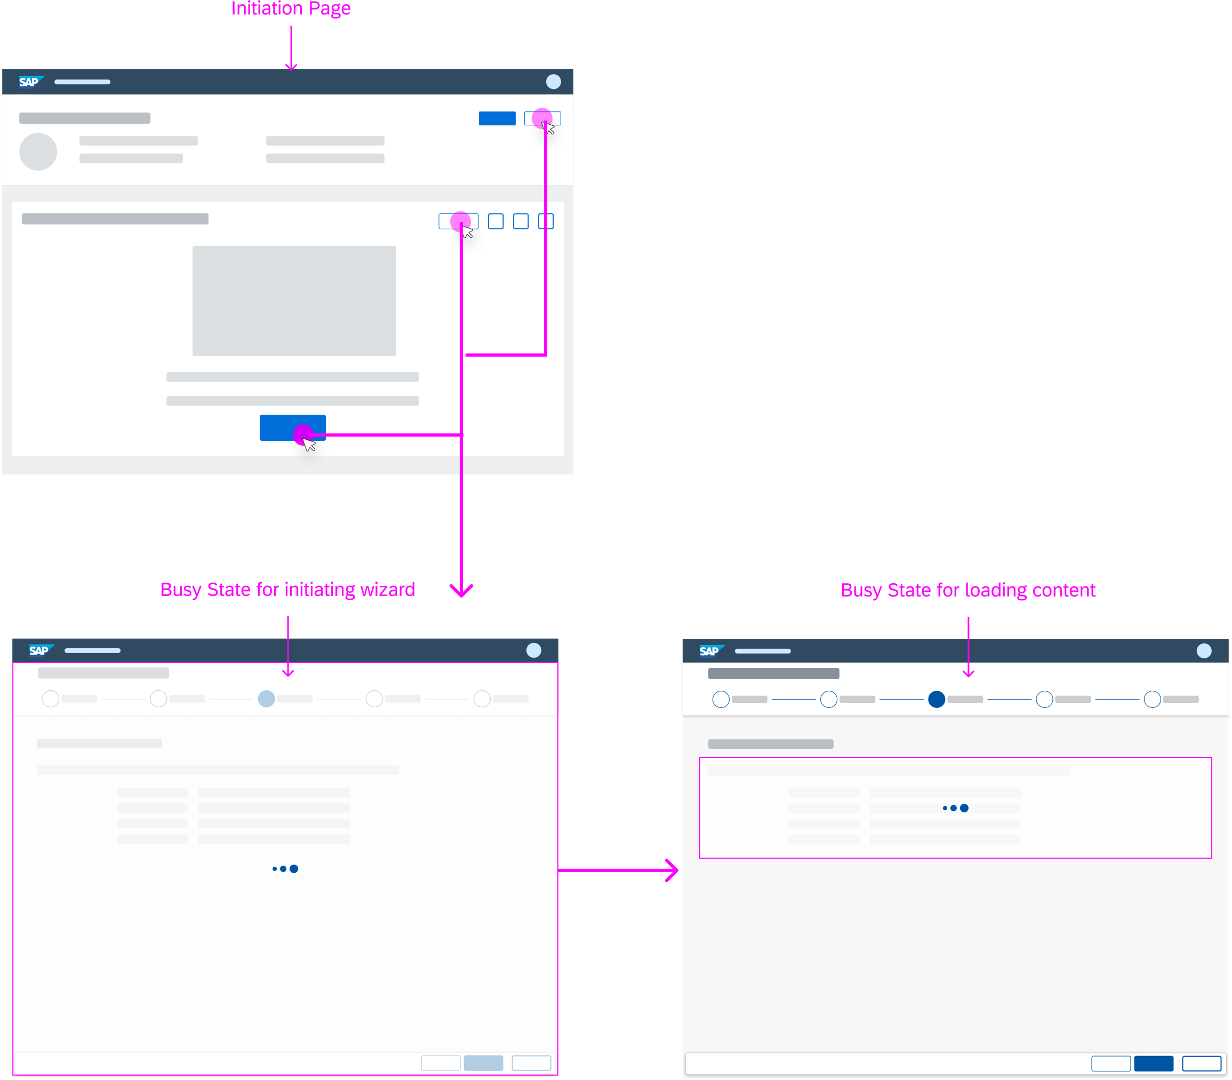
You can also use busy states. Currently, there are two different types of busy states available. One for initiating the wizard from a floorplan, and another for loading the single content parts of a wizard step.

Initiating the Wizard from a Floorplan

If initiating the wizard from a floorplan takes longer than one second, the control shows a busy state. As soon as the wizard is available, the busy state is removed, and the single parts of the wizard step are loaded.

Busy state - Initiating wizard from a floorplan (example)

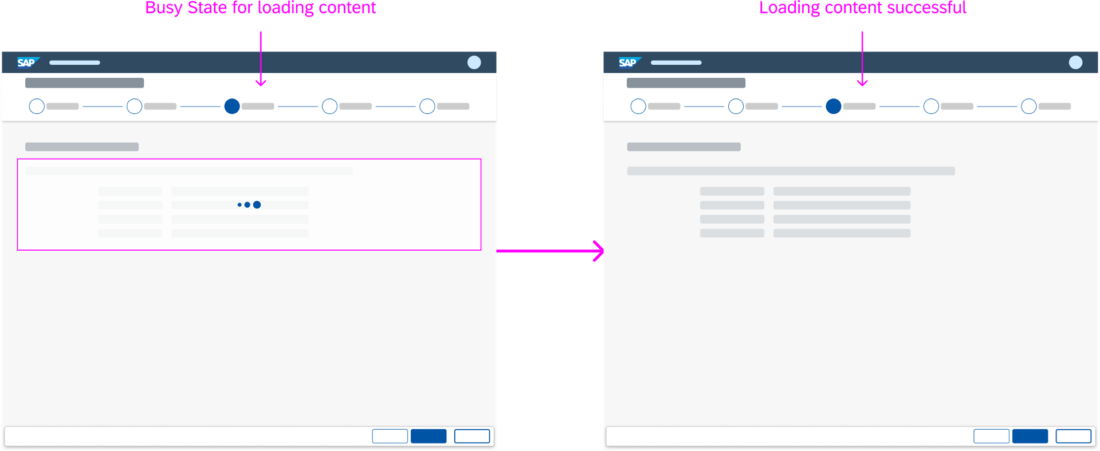
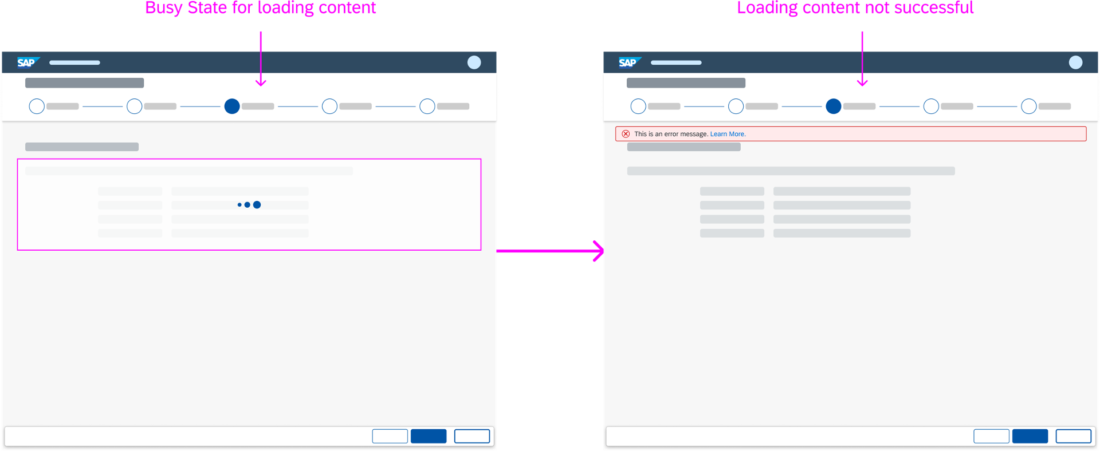
Loading the Single Parts of a Wizard Step

If loading the single parts of a wizard step takes longer than one second, set the control to the busy state. If loading was successful, the busy indicator is removed and the content is shown. If loading wasn’t successful, the busy indicator is removed, an error message strip appears, and the content isn’t shown.

Busy state - Loading the single parts of a wizard step (successful)
Busy state - Loading the single parts of a wizard step (not successful)

Dynamic Page

Header

Even though the wizard floorplan consumes the dynamic page, the wizard header does not allow snapping. The wizard floorplan comes with its own step-based header that already saves space.

Footer Toolbar

The footer toolbar of the wizard floorplan conforms to the standard dynamic page layout and uses the sap.m.bar control.

Developer Hint
If you use the wizard in a dynamic page layout, set the height of the wizard to “auto” instead of “100%”. Otherwise, a scrollbar issue may occur.

Resources

Want to dive deeper? Follow the links below to find out more about related controls, the SAPUI5 implementation, and the visual design.

Elements and Controls

Implementation

  • Form (SAPUI5 samples)
  • Wizard (SAPUI5 samples)
  • Form (SAPUI5 API reference)
  • Wizard (SAPUI5 API reference)

Table Personalization Dialog

The table personalization dialog allows you to display and modify table settings. It is a UI pattern that defines the column order and visibility.

Usage

Use the table personalization dialog if:

  • You have small tables.
  • You have a manageable number of columns.

Do not use the table personalization dialog if:

  • You have large tables.
  • You have a lot of columns to manage.

For larger tables you can use the P13n dialog instead.

Responsiveness

On a desktop and tablet, the control appears as a dialog window.

On smartphone devices, always display the table personalization dialog in full screen mode.

Smartphone - Size S
Smartphone - Size S
Tablet - Size M
Tablet - Size M
Desktop - Size L/XL
Desktop - Size L/XL

Layout

Position on the Screen

The dialog always opens in a modal window in the center of the screen.

For smartphones, stretch the dialog to fill the entire screen. For tablet and desktop devices, keep the modal window.

Layout of the Dialog

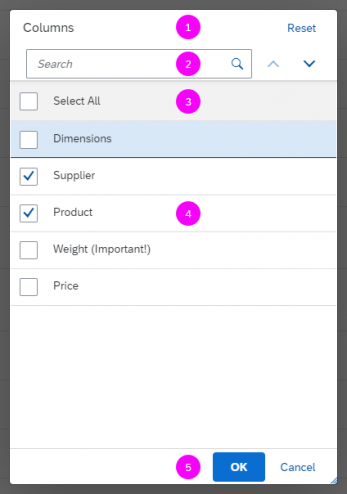
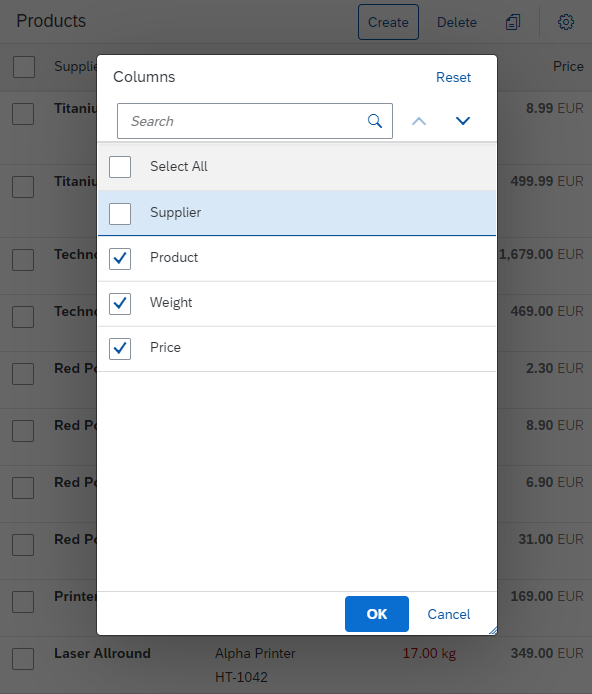
The table personalization dialog comprises the following five areas:

(1) Header

(2) Toolbar

(3) List Header

(4) Column list

(5) Footer toolbar

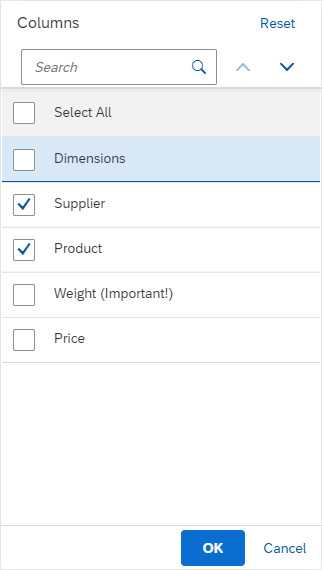
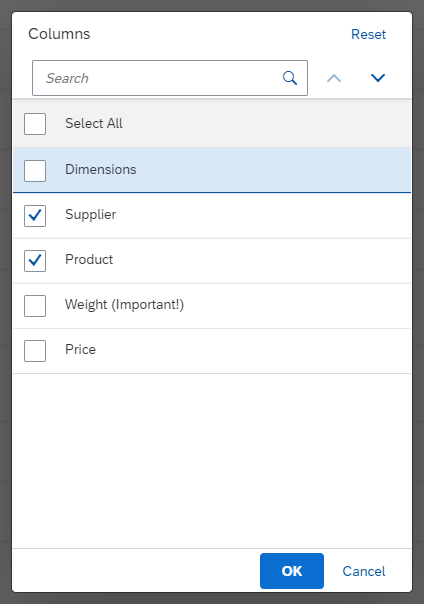
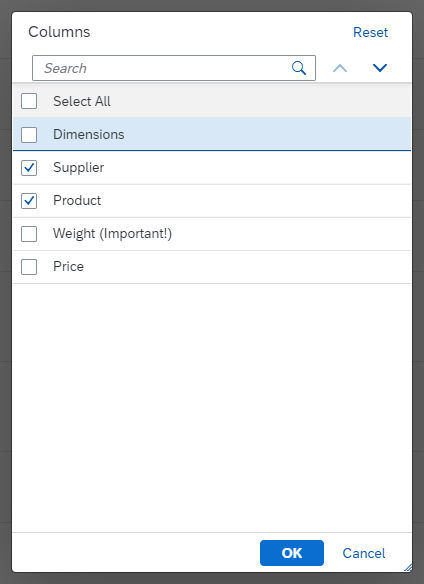
Table personalization dialog – Overview

Components

The table personalization dialog contains the following sections:

Dialog Header

The header displays the dialog title and the Reset button to revert to the initial state.

Dialog header
Dialog header

Toolbar

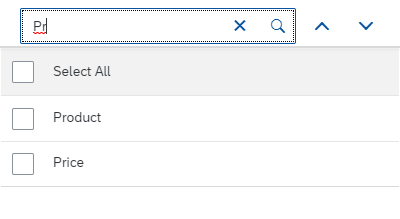
The toolbar displays the Move Column Up and Move Column Down buttons, and the Search field.

Toolbar
Toolbar

List Header

The list header displays the Select All checkbox for selecting all columns.

List header
List header

Column list

The column list displays the available columns. The user can filter the selection using the search field in the toolbar.

Column list
Column list

Footer toolbar

The footer toolbar displays an OK and a Cancel button.

Footer toolbar
Footer toolbar

Behavior and Interaction

The table personalization dialog is resizable.

Open the Dialog

To open the table personalization dialog, the user clicks the  (Settings) button on the right-hand side of the table toolbar.

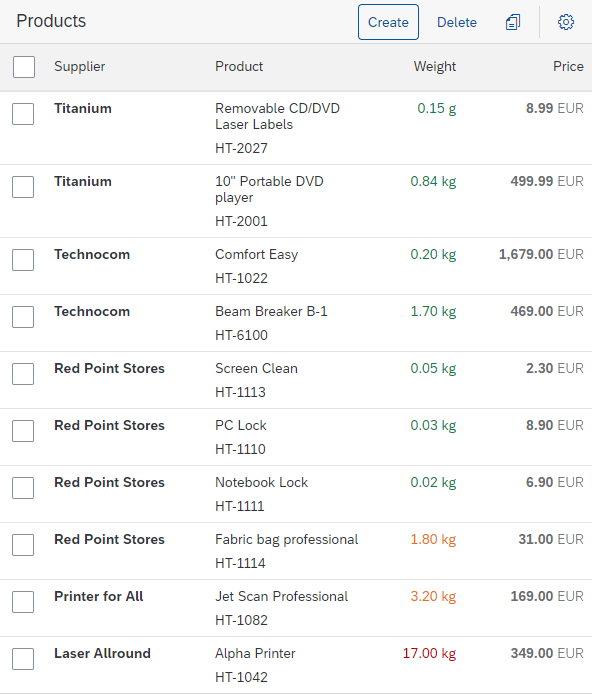
Table with settings button
Table personalization dialog opened

Show or Hide Columns

To show or hide columns, the user selects or deselects the checkbox for a column (list item).

The column is hidden in the table
The column is visible in the table

The user can also show or hide all columns with just one click. A checkbox on the left-hand side of the list header enables all list items to be selected or deselected.

Show all
Show all
Hide all
Hide all

Move Columns

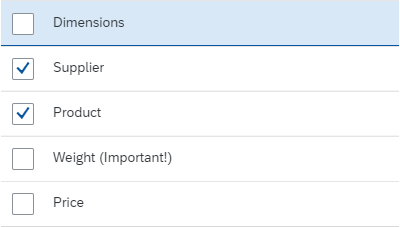
Users can change the order of the columns in the table using the   (Move Column Up) and   (Move Column Down) buttons in the toolbar.

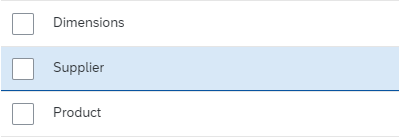
To change the order, click an item (not on the check box, but on the rest of the line), and click the button: Items on top are farthest to the left in the table, items on bottom are farthest to the right.

Move buttons
Move buttons
The column 'Supplier' will be moved. It is not checked, though, therefore the result of moving this column will not be visible in the table.

Search/Filter Columns

Users can search for or filter columns using the search field in the toolbar.

Search field
Search field

The search is a live search (also known as “search-as-you-type”), which is triggered by each character the user enters or deletes. For more information, see search.

To clear the filters, the user can delete all characters manually, or use the  icon.

The list then shows all columns again.

Search while you type

Reset Personalization

The Reset button in the dialog header resets all settings to the initial state.

If the table personalization dialog is used together with variant management, the button resets the changes to the initial state of the selected variant.

Reset button
Reset button

Confirm/Cancel Changes

The changes are applied when the user closes the dialog with the OK button.

The Cancel button closes the dialog without applying the changes.

OK and Cancel buttons

Resources

Elements and Controls

Implementation

SAP Fiori Elements

SAP Fiori elements is a framework that comprises the most commonly used floorplan templates and is designed to:

  • Speed up development by reducing the amount of frontend code needed to build SAP Fiori apps.
  • Drive UX consistency and compliance with the latest SAP Fiori design guidelines.

The articles in the “SAP Fiori Elements Framework” section of the guidelines cover all the design possibilities based on the current technical capabilities of the SAP Fiori elements framework and the version used to develop your application.

Video: What is SAP Fiori elements?

Versions

Ask your engineering colleagues what SAP Fiori elements version they will use to develop your app because there are differences in the design options that each version supports. The articles in this section of the guidelines indicate when such differences exist.

Each version of SAP Fiori elements supports a different version of OData (Open Data Protocol), as their names indicate:

  • SAP Fiori elements for OData version 2 (V2)
  • SAP Fiori elements for OData version 4 (V4)

Usage

Your ultimate decision about whether or not to use SAP Fiori elements should be based on two factors:

  • Is the floorplan you want to use supported by SAP Fiori elements?
  • Does the SAP Fiori elements floorplan deliver all the features you need to provide to your user? If not, consider building a freestyle application instead.

Please note that the analytical list page and the overview page are only available as SAP Fiori elements.

Supported Floorplans

The following floorplans are available as SAP Fiori elements templates:

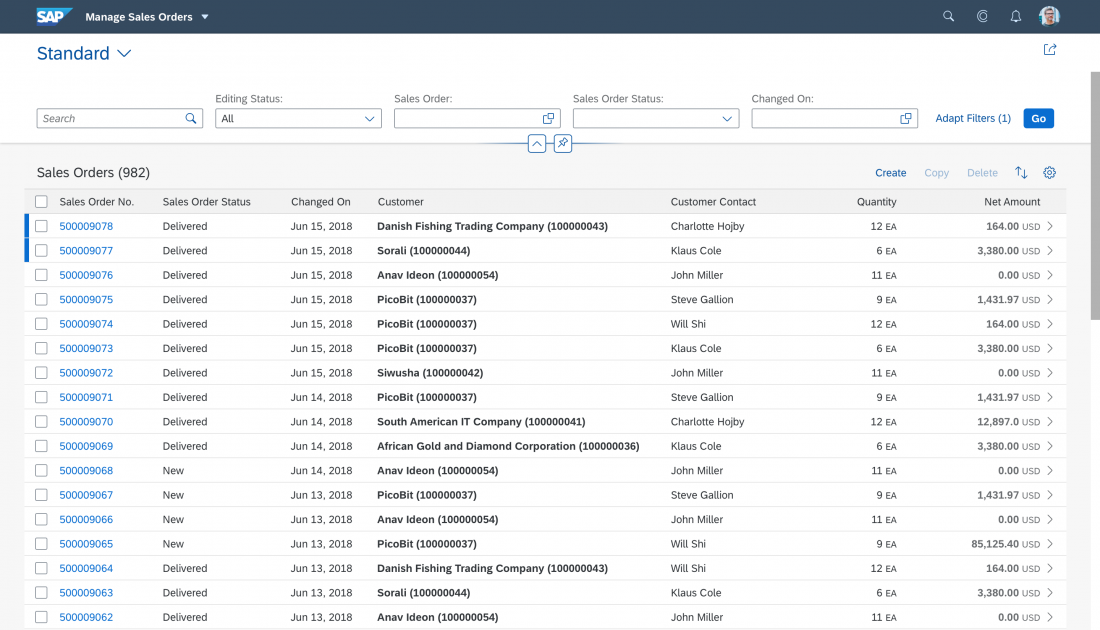
List report
List report
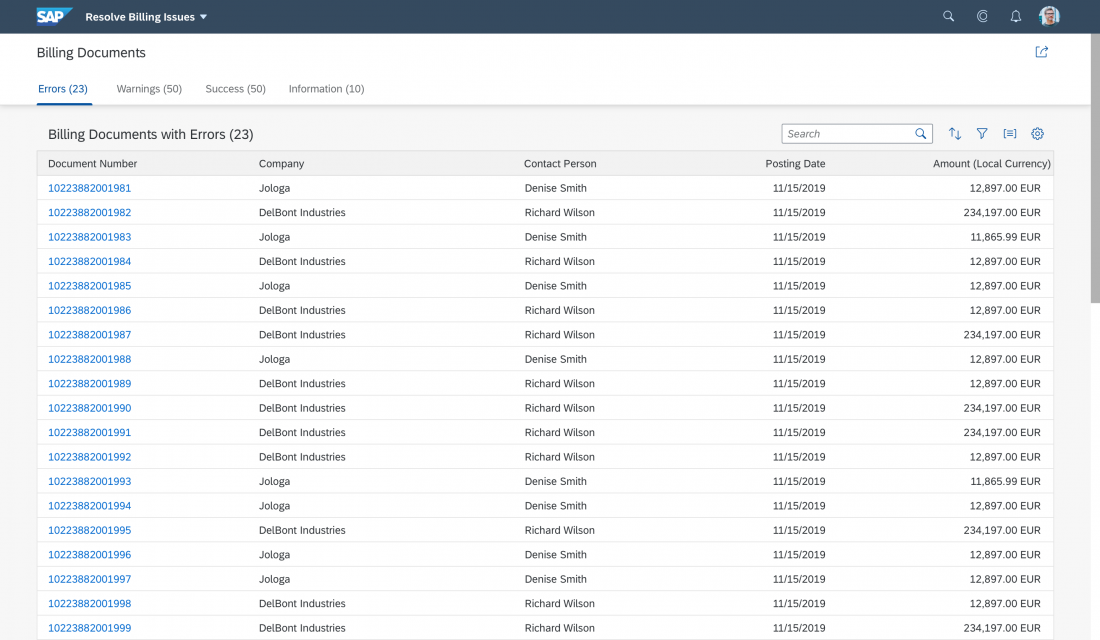
Worklist
Worklist
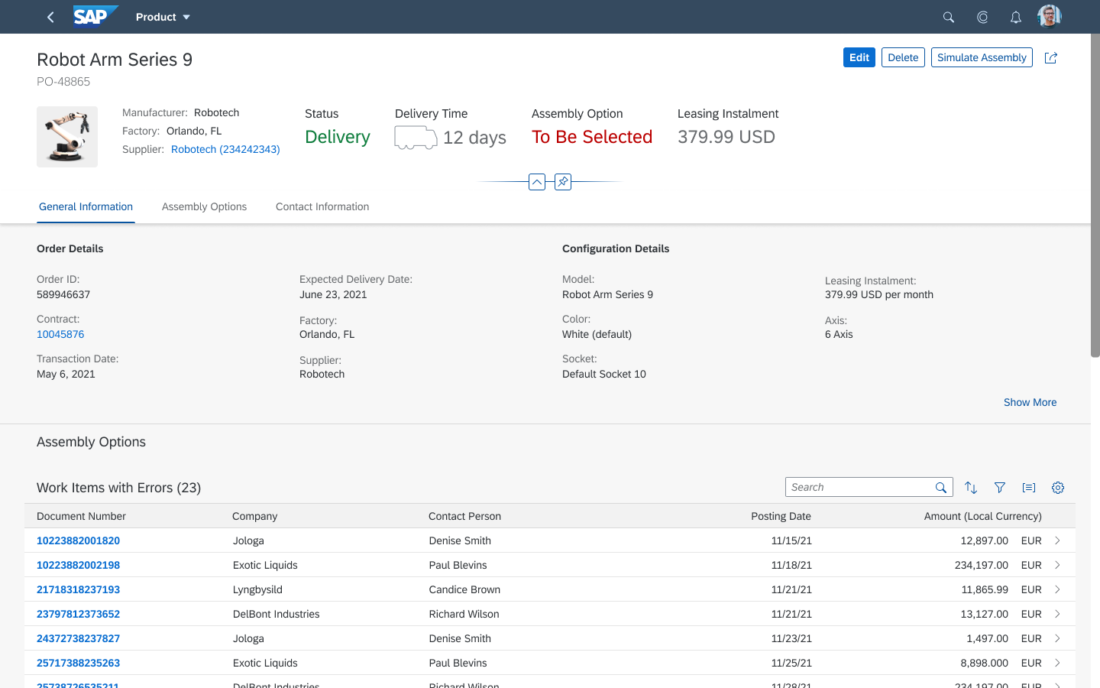
Object page
Object page
Overview page
Overview page
Analytical list page

Each floorplan can be placed inside the flexible column layout, except the overview page. The overview page must always be implemented as a standalone application that pulls in data from a minimum of two other applications.

Supported Features

Both SAP Fiori elements for OData V2 and for OData V4 offer:

  • Message handling
  • The global edit flow, which includes draft handling
  • Keyboard shortcuts for basic operations
  • Custom shortcuts for application-defined actions. Note that custom shortcuts for inline actions on table rows are not supported.
  • Seamless navigation across applications with the:
    • Inner app state that stores the state of the current page when the user leaves it, including such details as filter values, table and chart personalization, and the selected tab or section. The app state restores these details when the user returns.
    • Support of the SAP Fiori Launchpad feature called sap-keep-alive mode.
      With sap-keep-alive mode, the app page is restored to the same state it was in when the user left it, including scroll position and table selection. It also improves the performance of the page reload after back navigation.
      However, ensuring the page reflects changes that the user made in an external application before returning to it requires explicit configuration by the application developers.

Only SAP Fiori elements for OData V2 supports the local edit flow without draft handling.

Placeholder Texts

Some UI texts provided by the SAP Fiori elements framework are generic placeholders. Always replace them with text that is meaningful to your user – for example:

Placeholder Text Replaced Text
List Report Create Object Create Sales Order
Object Page New Object New Sales Order
Overview Page Could not perform action Unable to approve the request


For more information, see: Replacing Placeholder Text.

Developer Hint
For more information about placeholder texts in SAP Fiori elements, see Localization of UI Texts.

Extensions

It’s possible to create extensions to deliver features that are not supported by SAP Fiori elements. However, this is not recommended because the associated code will need to be maintained.

Developer Hint
You can create extensions, by adapting the manifest.json of your app, or through annotations or UI adaptation. For more information, see the Extending SAP Fiori Elements-Based Apps.

Related Links

Want to dive deeper? Follow the links below to find out more about related controls, the SAPUI5 implementation, and the visual design.

Chart – Value-Based Legend

The value-based legend is used to visually represent value ranges through color shades. It is currently available for the heatmap and treemap.

Value-based legend example on a heatmap

Layout and Responsiveness

By default, the value-based legend is positioned to the right of the data plot. If there isn’t enough space (for example, in portrait mode on a smartphone), it moves to the bottom. In this case, it is displayed in a condensed format.

Responsiveness on a smartphone - Portrait mode

Behavior

The default value-based legend comprises five segments and uses the first hue of the sequential color palette.

Default value-based legend

Customization

Number of Segments

You can change the number of segments from two to nine. The corresponding value ranges are automatically calculated and assigned to each shade. However, you need to assign the colors to the segments yourself.

Recommended Colors for the Sequential Palette

Recommended sequential value-based legend from two to nine items
Color Name
2 values sapUiChartPaletteSequentialHue1Light2
sapUiChartPaletteSequentialHue1
3 values sapUiChartPaletteSequentialHue1Light2
sapUiChartPaletteSequentialHue1
sapUiChartPaletteSequentialHue1Dark2
4 values sapUiChartPaletteSequentialHue1Light2
sapUiChartPaletteSequentialHue1Light1
sapUiChartPaletteSequentialHue1
sapUiChartPaletteSequentialHue1Dark1
5 values sapUiChartPaletteSequentialHue1Light2
sapUiChartPaletteSequentialHue1Light1
sapUiChartPaletteSequentialHue1
sapUiChartPaletteSequentialHue1Dark1
sapUiChartPaletteSequentialHue1Dark2
6 values sapUiChartPaletteSequentialHue1Light3
sapUiChartPaletteSequentialHue1Light2
sapUiChartPaletteSequentialHue1Light1
sapUiChartPaletteSequentialHue1
sapUiChartPaletteSequentialHue1Dark1
sapUiChartPaletteSequentialHue1Dark2
7 values sapUiChartPaletteSequentialHue1Light2
sapUiChartPaletteSequentialHue1Light1
sapUiChartPaletteSequentialHue1
sapUiChartPaletteSequentialHue1Dark1
sapUiChartPaletteSequentialHue2Light2
sapUiChartPaletteSequentialHue2Light1
sapUiChartPaletteSequentialHue2
8 values sapUiChartPaletteSequentialHue1Light2
sapUiChartPaletteSequentialHue1Light1
sapUiChartPaletteSequentialHue1
sapUiChartPaletteSequentialHue1Dark1
sapUiChartPaletteSequentialHue2Light2
sapUiChartPaletteSequentialHue2Light1
sapUiChartPaletteSequentialHue2
sapUiChartPaletteSequentialHue2Dark1
9 values sapUiChartPaletteSequentialHue1Light2
sapUiChartPaletteSequentialHue1Light1
sapUiChartPaletteSequentialHue1
sapUiChartPaletteSequentialHue1Dark1
sapUiChartPaletteSequentialHue1Dark2
sapUiChartPaletteSequentialHue2Light2
sapUiChartPaletteSequentialHue2Light1
sapUiChartPaletteSequentialHue2
sapUiChartPaletteSequentialHue2Dark1
Example of a heatmap with an 5-segment sequential value-based legend

When you use the sequential color palette, you can also change the recommended hue illustrated above (still based on the SAP Fiori chart color palette). If you do so, follow this example for the choice of shades.

Recommended Colors for the Semantic Palette

Recommended semantic value-based legend from two to nine items
Color Name
2 values sapUiChartPaletteSemanticGoodLight2
sapUiChartPaletteSemanticGood
3 values sapUiChartPaletteSemanticGoodLight2
sapUiChartPaletteSemanticGood
sapUiChartPaletteSemanticGoodDark2
4 values sapUiChartPaletteSemanticGoodLight2
sapUiChartPaletteSemanticGood1Light1
sapUiChartPaletteSemanticGood
sapUiChartPaletteSemanticGoodDark1
5 values sapUiChartPaletteSemanticGoodLight2
sapUiChartPaletteSemanticGoodLight1
sapUiChartPaletteSemanticGood
sapUiChartPaletteSemanticGoodDark1
sapUiChartPaletteSemanticGoodDark2
6 values sapUiChartPaletteSemanticGoodLight3
sapUiChartPaletteSemanticGoodLight2
sapUiChartPaletteSemanticGoodLight1
sapUiChartPaletteSemanticGood
sapUiChartPaletteSemanticGoodDark1
sapUiChartPaletteSemanticGoodDark2
7 values sapUiChartPaletteSemanticGoodLight2
sapUiChartPaletteSemanticGoodLight1
sapUiChartPaletteSemanticGoodHue1
sapUiChartPaletteSemanticGoodDark1
sapUiChartPaletteSemanticBadLight2
sapUiChartPaletteSemanticBadLight1
sapUiChartPaletteSemanticBad
8 values sapUiChartPaletteSemanticGoodLight2
sapUiChartPaletteSemanticGoodLight1
sapUiChartPaletteSemanticGood
sapUiChartPaletteSemanticGoodDark1
sapUiChartPaletteSemanticBadLight2
sapUiChartPaletteSemanticBadLight1
sapUiChartPaletteSemanticBad
sapUiChartPaletteSemanticBadDark1
9 values sapUiChartPaletteSemanticGoodLight2
sapUiChartPaletteSemanticGoodLight1
sapUiChartPaletteSemanticGood
sapUiChartPaletteSemanticGoodDark1
sapUiChartPaletteSemanticGoodDark2
sapUiChartPaletteSemanticBadLight2
sapUiChartPaletteSemanticBadLight1
sapUiChartPaletteSemanticBad
sapUiChartPaletteSemanticBadDark1
Example of a heatmap with an 5-segment semantic value-based legend

Range

Finally, you can manually set the range for each segment. Note that for a given segment number, “segment number + 1” values are needed (example: [0,8,9,10,11,20] for five segments).

If the overall range being defined is different from the real data range, the “>” and “<” signs are displayed in the legend.

Resources

Want to dive deeper? Follow the links below to find out more about related controls, the SAPUI5 implementation, and the visual design.

Elements and Controls

Implementation

  • No links.