
- SAPUI5 Version 1.122
- SAPUI5 Version 1.120
- SAPUI5 Version 1.118
- SAPUI5 Version 1.116
- SAPUI5 Version 1.114
- SAPUI5 Version 1.112
- SAPUI5 Version 1.110
- SAPUI5 Version 1.108
- SAPUI5 Version 1.106
- SAPUI5 Version 1.104
- SAPUI5 Version 1.102
- SAPUI5 Version 1.100
- SAPUI5 Version 1.98
- SAPUI5 Version 1.96
- SAPUI5 Version 1.94
- SAPUI5 Version 1.92
- SAPUI5 Version 1.90
- SAPUI5 Version 1.88
- SAPUI5 Version 1.86
- SAPUI5 Version 1.84
- SAPUI5 Version 1.82
- SAPUI5 Version 1.80
- SAPUI5 Version 1.78
- SAPUI5 Version 1.76
- SAPUI5 Version 1.74
- SAPUI5 Version 1.72
- SAPUI5 Version 1.70
- SAPUI5 Version 1.68
- SAPUI5 Version 1.66
- SAPUI5 Version 1.64
- SAPUI5 Version 1.62
- SAPUI5 Version 1.60
- SAPUI5 Version 1.58
- SAPUI5 Version 1.56
- SAPUI5 Version 1.54
- SAPUI5 Version 1.52
- SAPUI5 Version 1.50
- SAPUI5 Version 1.48
- SAPUI5 Version 1.46
- SAPUI5 Version 1.44
- SAPUI5 Version 1.42
- SAPUI5 Version 1.40
- SAPUI5 Version 1.38
- SAPUI5 Version 1.36
- SAPUI5 Version 1.34
- SAPUI5 Version 1.32
- SAPUI5 Version 1.30
- SAPUI5 Version 1.28
- SAPUI5 Version 1.26
- Latest SAPUI Version 1.124
- SAPUI5 Version 1.122
- SAPUI5 Version 1.120
- SAPUI5 Version 1.118
- SAPUI5 Version 1.116
- SAPUI5 Version 1.114
- SAPUI5 Version 1.112
- SAPUI5 Version 1.110
- SAPUI5 Version 1.108
- SAPUI5 Version 1.106
- SAPUI5 Version 1.104
- SAPUI5 Version 1.102
- SAPUI5 Version 1.100
- SAPUI5 Version 1.98
- SAPUI5 Version 1.96
- SAPUI5 Version 1.94
- SAPUI5 Version 1.92
- SAPUI5 Version 1.90
- SAPUI5 Version 1.88
- SAPUI5 Version 1.86
- SAPUI5 Version 1.84
- SAPUI5 Version 1.82
- SAPUI5 Version 1.80
- SAPUI5 Version 1.78
- SAPUI5 Version 1.76
- SAPUI5 Version 1.74
- SAPUI5 Version 1.72
- SAPUI5 Version 1.70
- SAPUI5 Version 1.68
- SAPUI5 Version 1.66
- SAPUI5 Version 1.64
- SAPUI5 Version 1.62
- SAPUI5 Version 1.60
- SAPUI5 Version 1.58
- SAPUI5 Version 1.56
- SAPUI5 Version 1.54
- SAPUI5 Version 1.52
- SAPUI5 Version 1.50
- SAPUI5 Version 1.48
- SAPUI5 Version 1.46
- SAPUI5 Version 1.44
- SAPUI5 Version 1.42
- SAPUI5 Version 1.40
- SAPUI5 Version 1.38
- SAPUI5 Version 1.36
- SAPUI5 Version 1.34
- SAPUI5 Version 1.32
- SAPUI5 Version 1.30
- SAPUI5 Version 1.28
- SAPUI5 Version 1.26
Analysis Path Framework
Intro
Analysis Path Framework (APF) is a framework for creating interactive, chart-oriented analytical drilldown apps by configuration. APF-based apps enable the user to view and analyze the data of several key performance indicators (KPIs) from different data sources. Users can interactively explore data step by step from different perspectives to analyze and investigate root causes. In each analysis step, you can investigate KPIs/measures and select relevant data to filter the information provided in subsequent steps. By combining different analysis steps and applying filters, you interactively create your own flexible analysis path.
Analysis Path Framework-based app
APF can consume OData services that are based on the following data sources:
- Calculation views
- ABAP CDS views
- BW OData queries
APF is integrated into SAP Smart Business as an advanced KPI drilldown option.
Responsiveness
APF-based apps are responsive and ensure a consistent user experience for desktop or tablet devices.
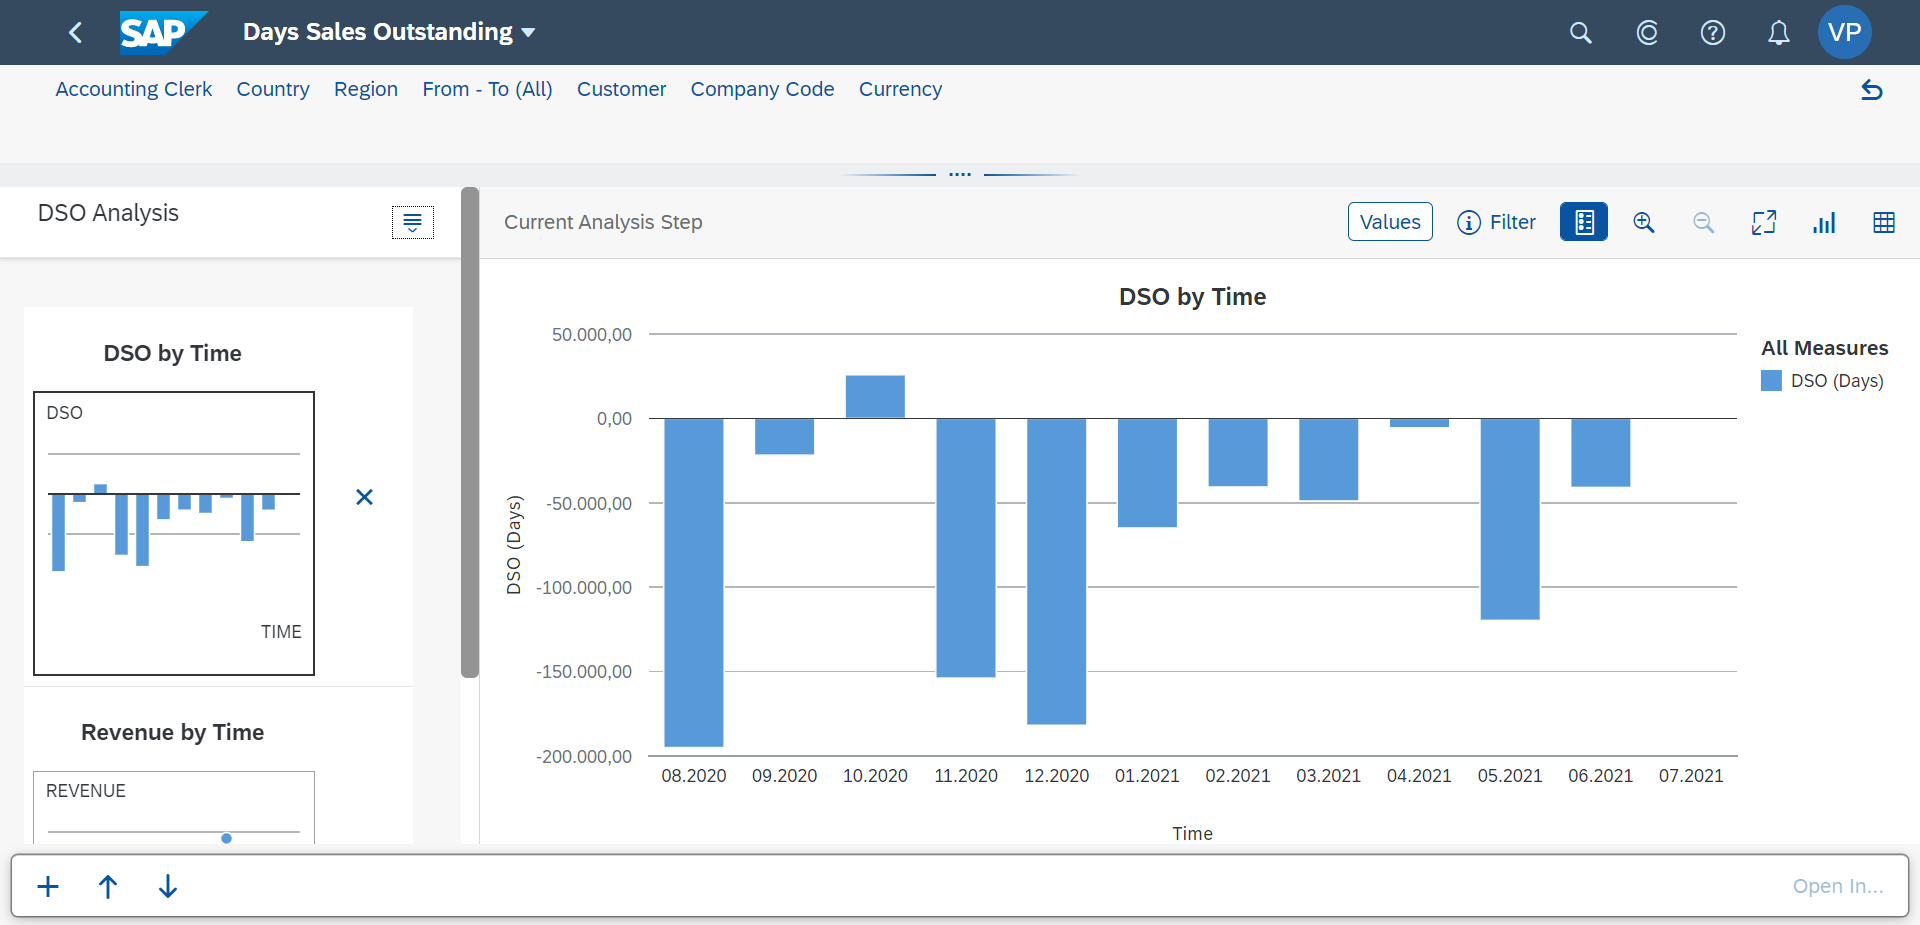
APF-based app on desktop
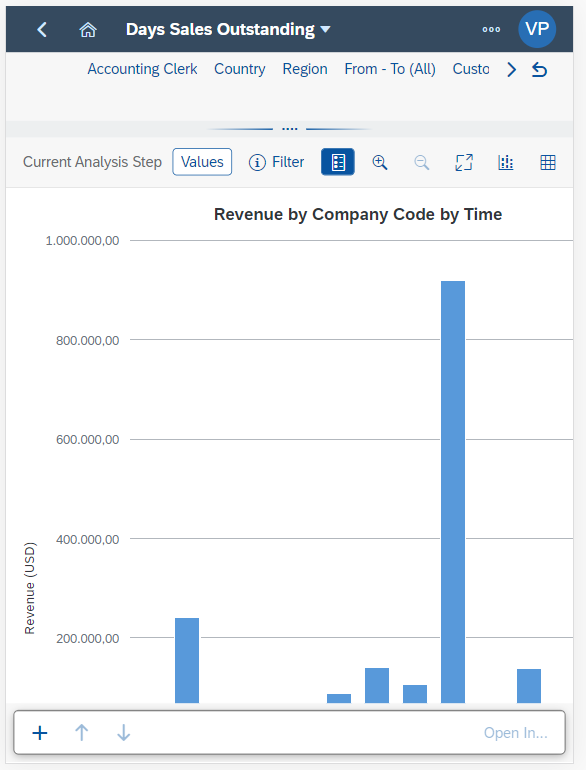
APF-based app on iPad
Layout
The page consists of the following:
- A header area
- An overview area (the analysis path display), where all analysis steps that have been added can be viewed at a glance
- A details area (the analysis step display), where charts or tables can be analyzed
- The footer toolbar
Behavior and Interaction
The header area contains the app title as well as global filters. Selections made in global filters are applied to all analysis steps of an analysis.
When designing, you can either configure each filter individually or use the smart filter bar.
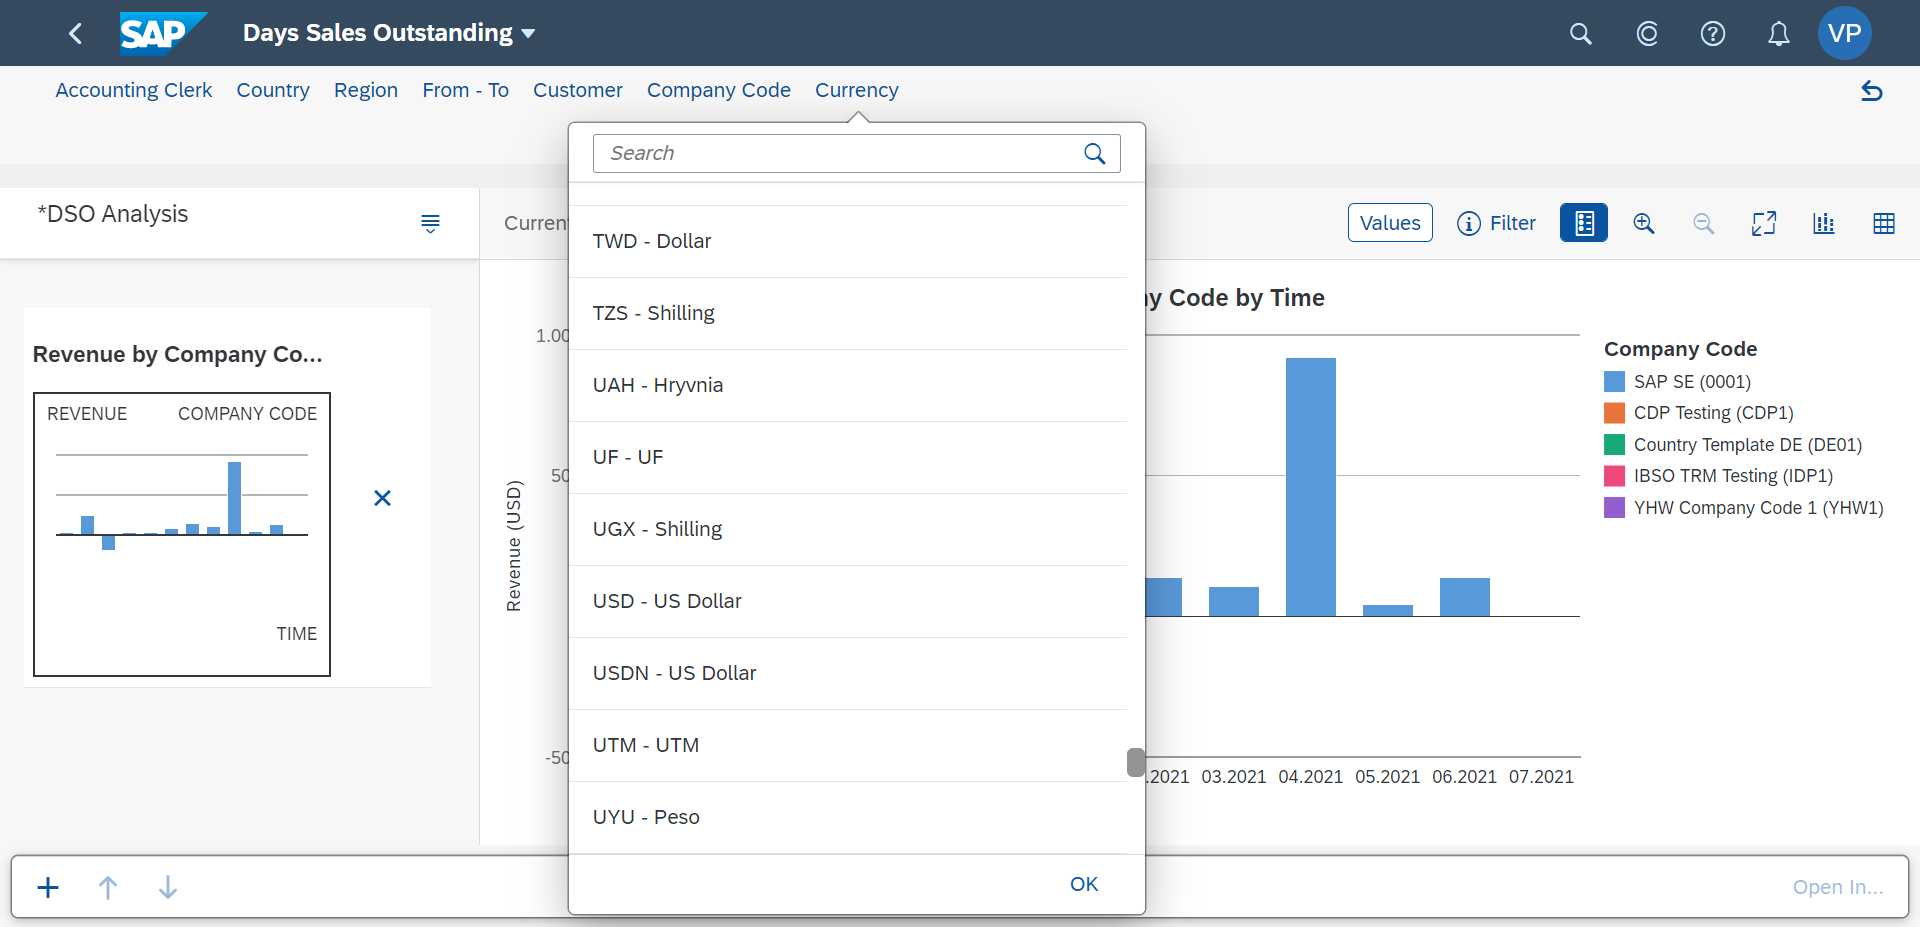
Header area with global filters
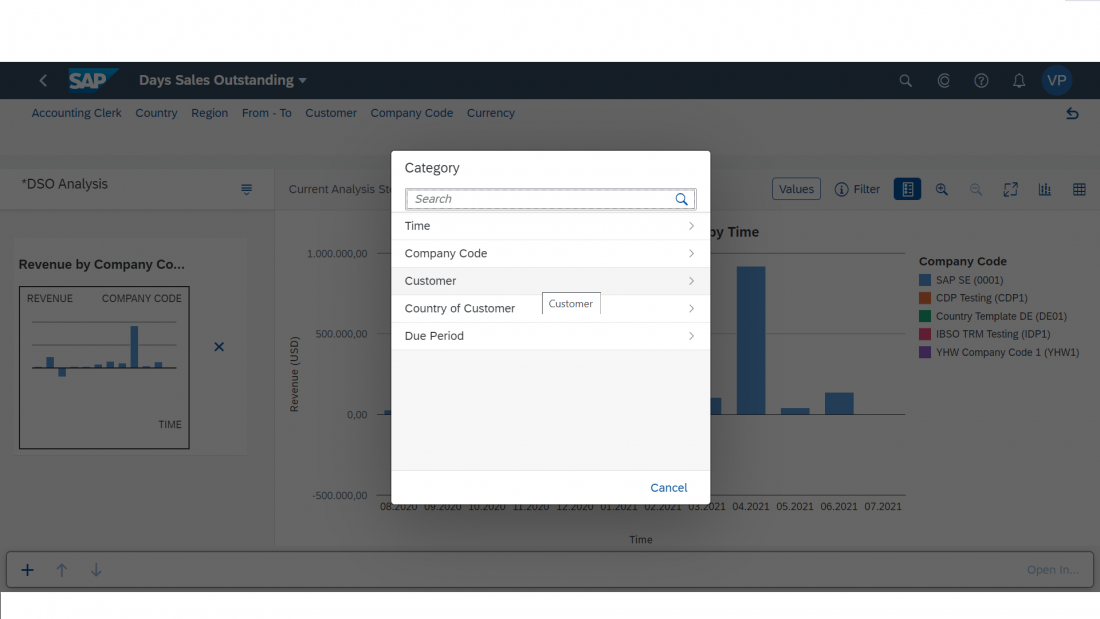
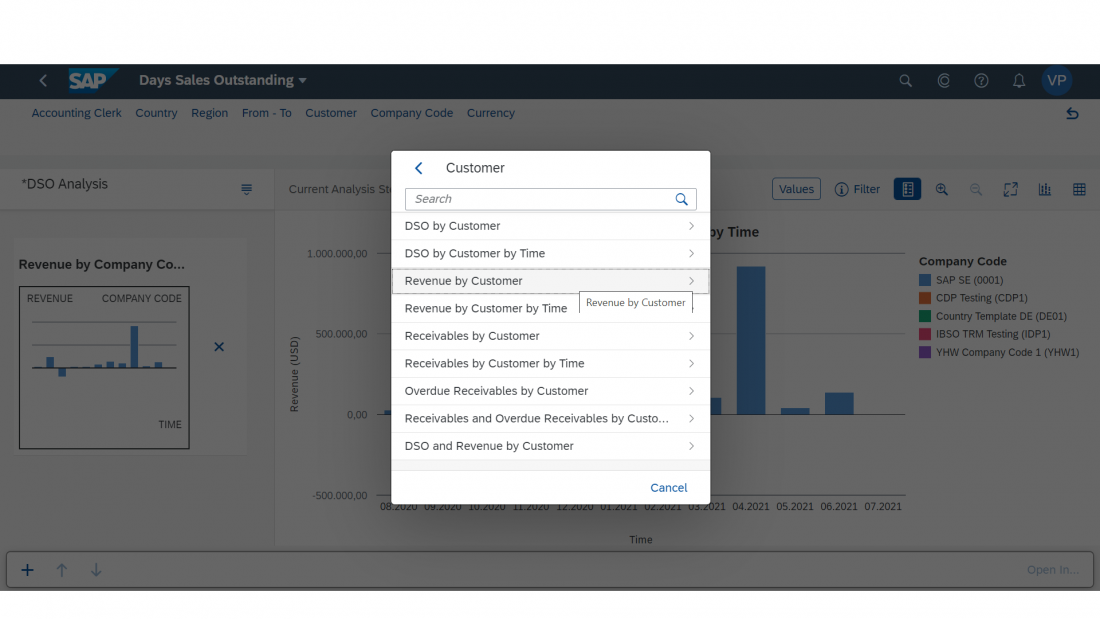
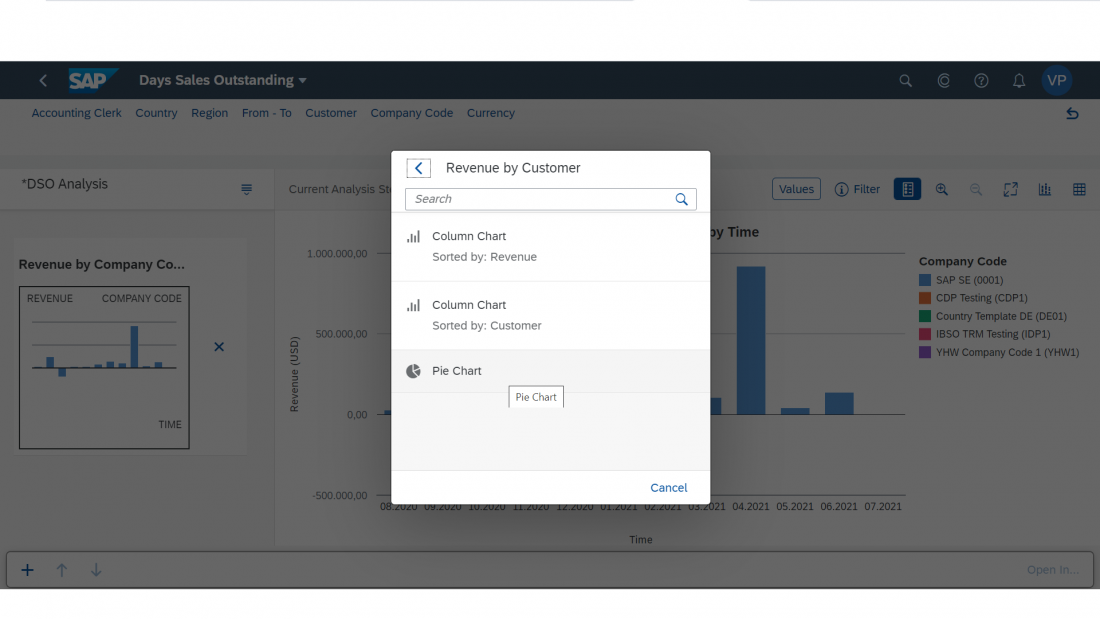
The analysis path display is the UI area where thumbnails of all analysis steps of the current analysis path are displayed. It allows you to work flexibly with your analysis path. You can add, delete, and rearrange analysis steps. To add analysis steps, click the Add Analysis Step button at the bottom of the analysis path. This opens the “analysis step gallery”, where you can choose the analysis step you want to add to your analysis.
Add New Step/Analysis Step Gallery
You can also capture the analysis findings by saving the analysis path, open saved analysis paths to revisit your findings at a later point in time, and you can print the analysis path. To do so, click the icon next to the analysis path name. This opens the actions menu with the options to Open, Save, and Print analysis paths.

Actions menu
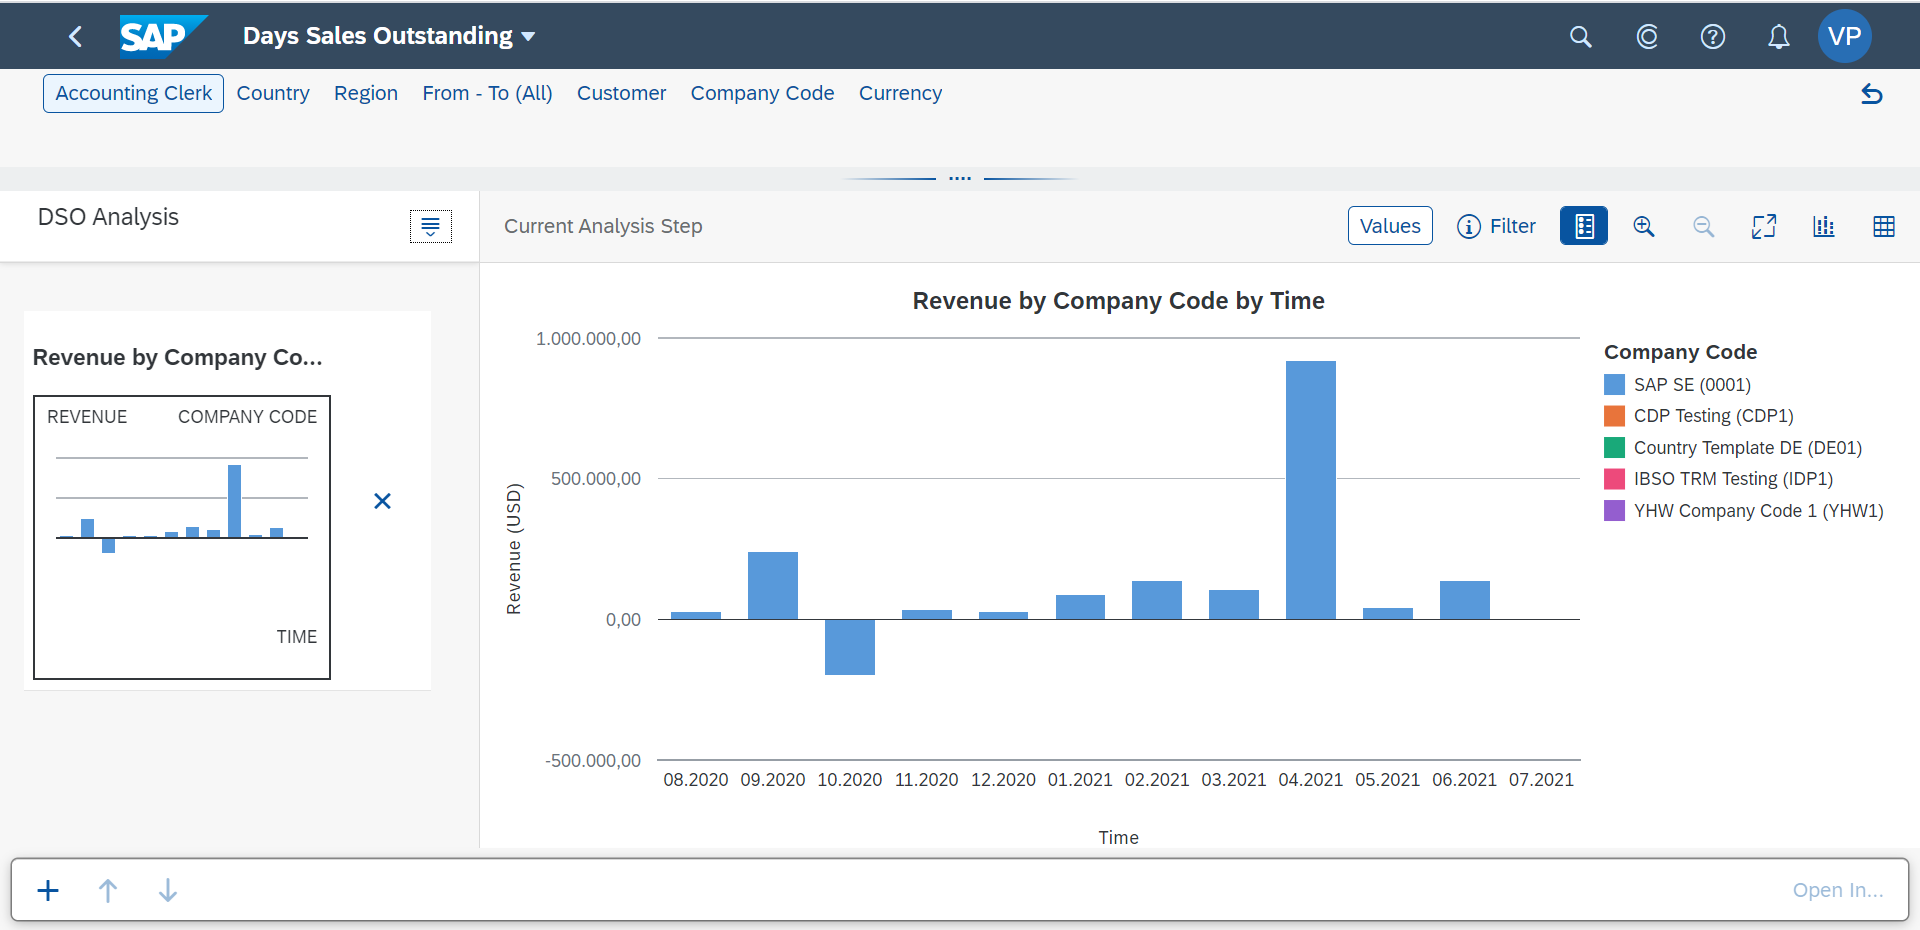
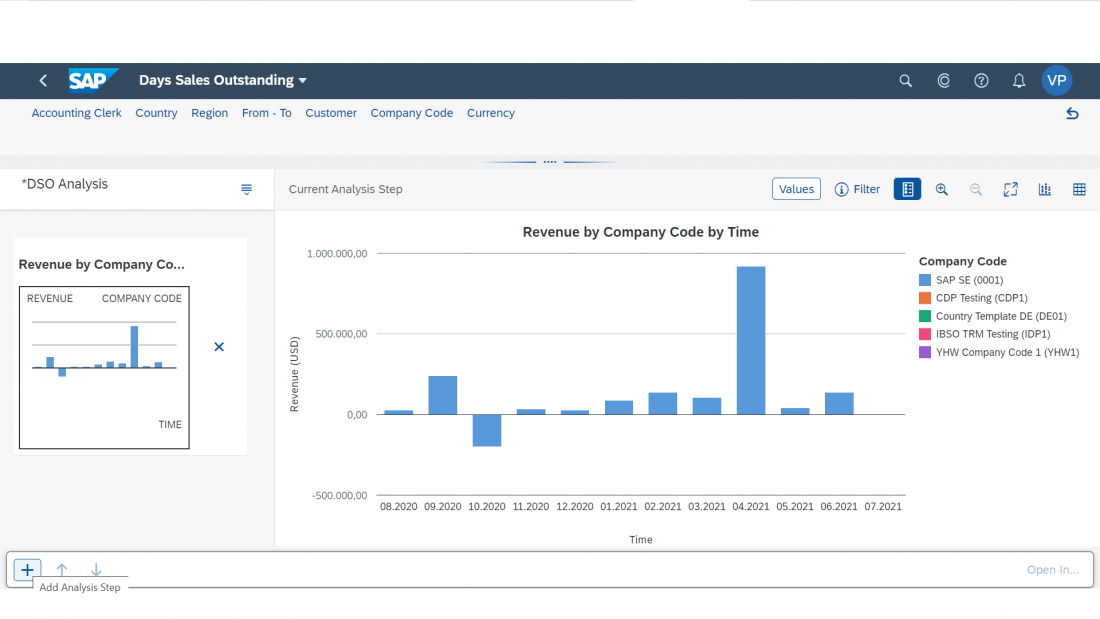
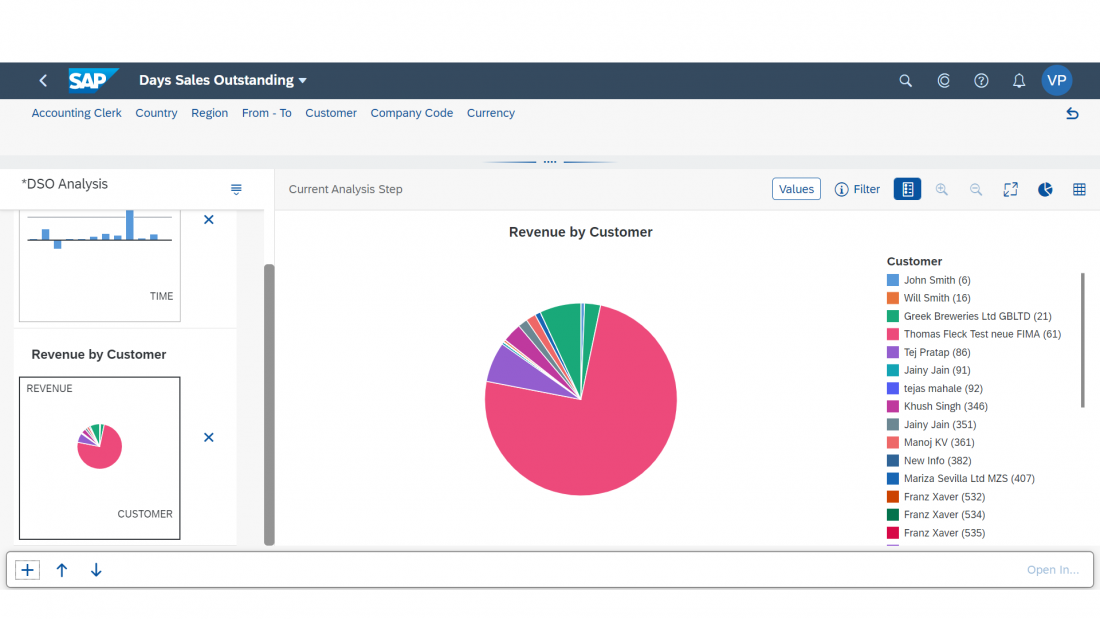
When you choose a thumbnail in the analysis path display, the details of this step are shown in the analysis step display.
For further analysis, you can select and filter relevant data directly in the chart or in the table. You can also view and select hierarchical data in a tree table, where data is structured in rows and columns and grouped into nodes.
Furthermore, the chart toolbar provides standard interactions. For example, you can switch to different chart types and a table view, and you can filter and sort tabular data. You can also enlarge the chart to full-screen size.
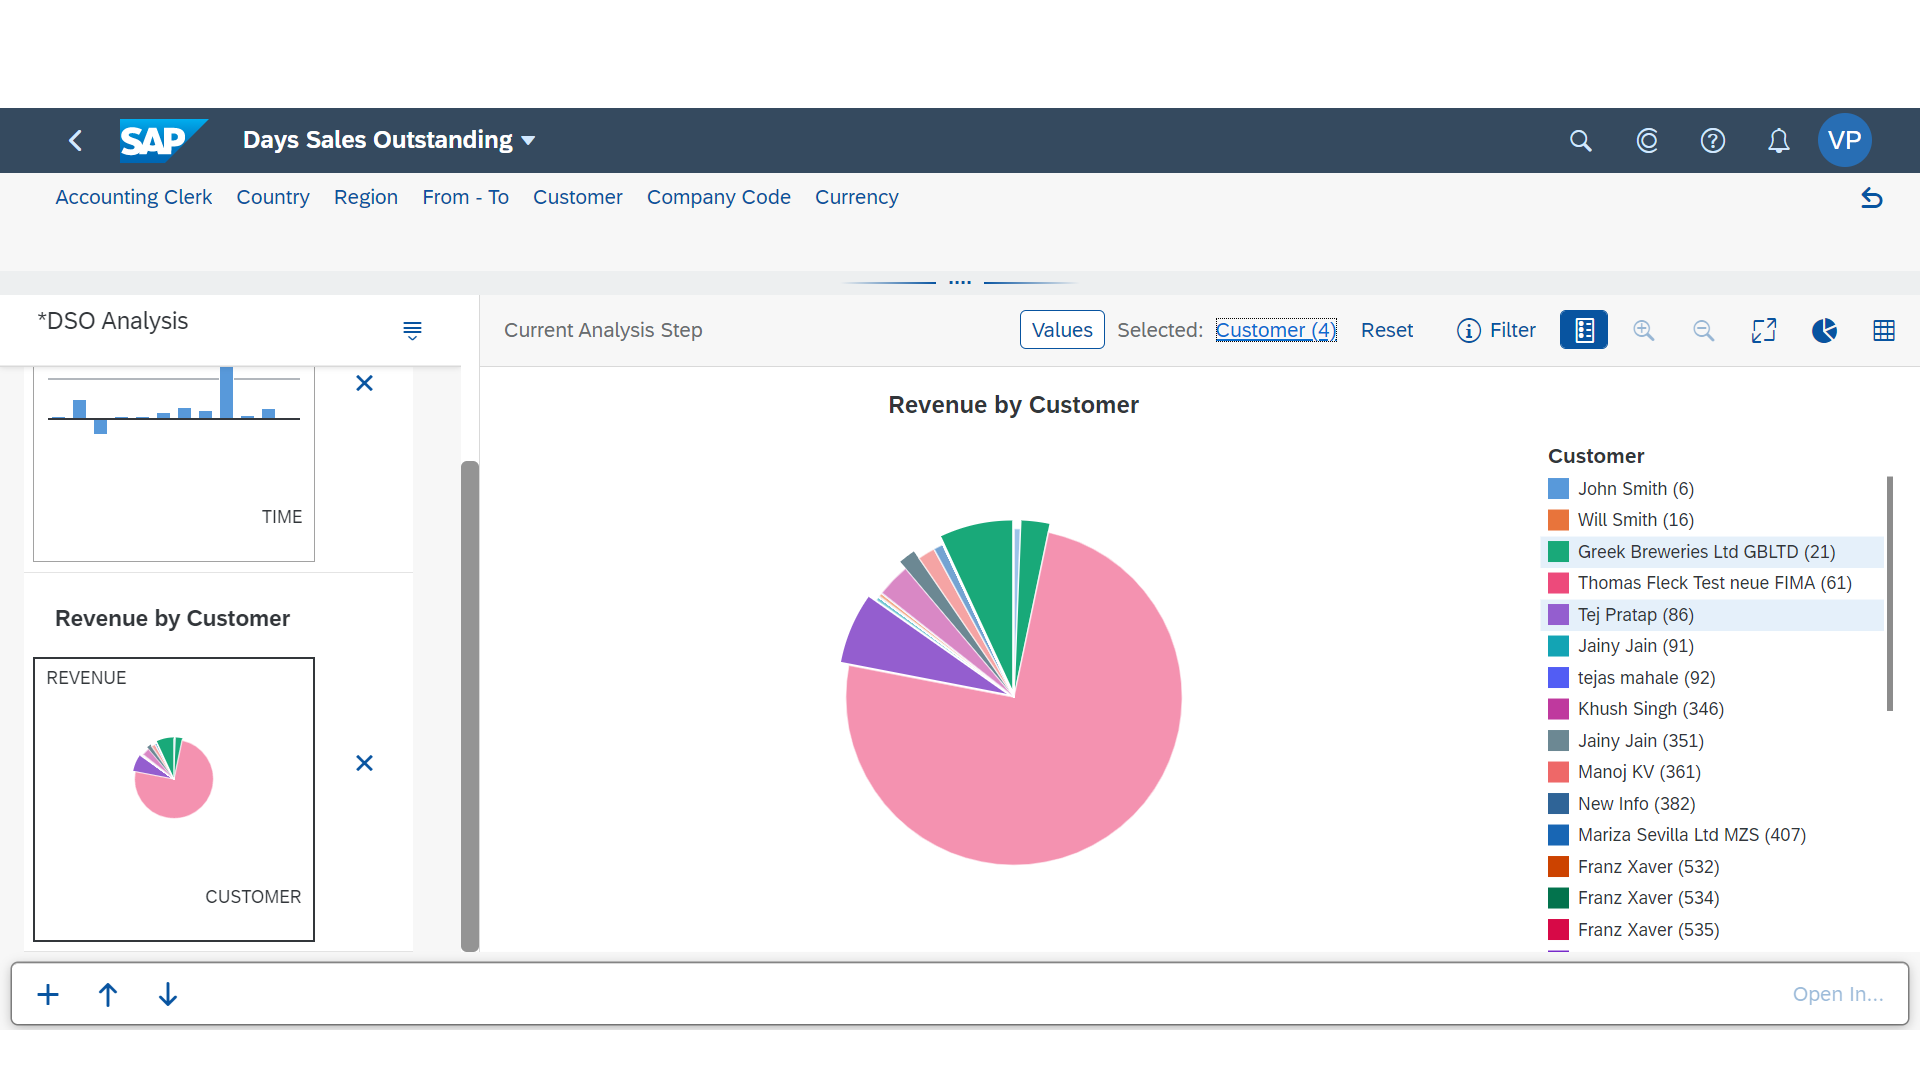
Chart with selected values
You can change the order of the analysis steps in an analysis path by clicking the arrows in the footer toolbar to move up or down a step. To navigate to other apps, click the Open In… button.
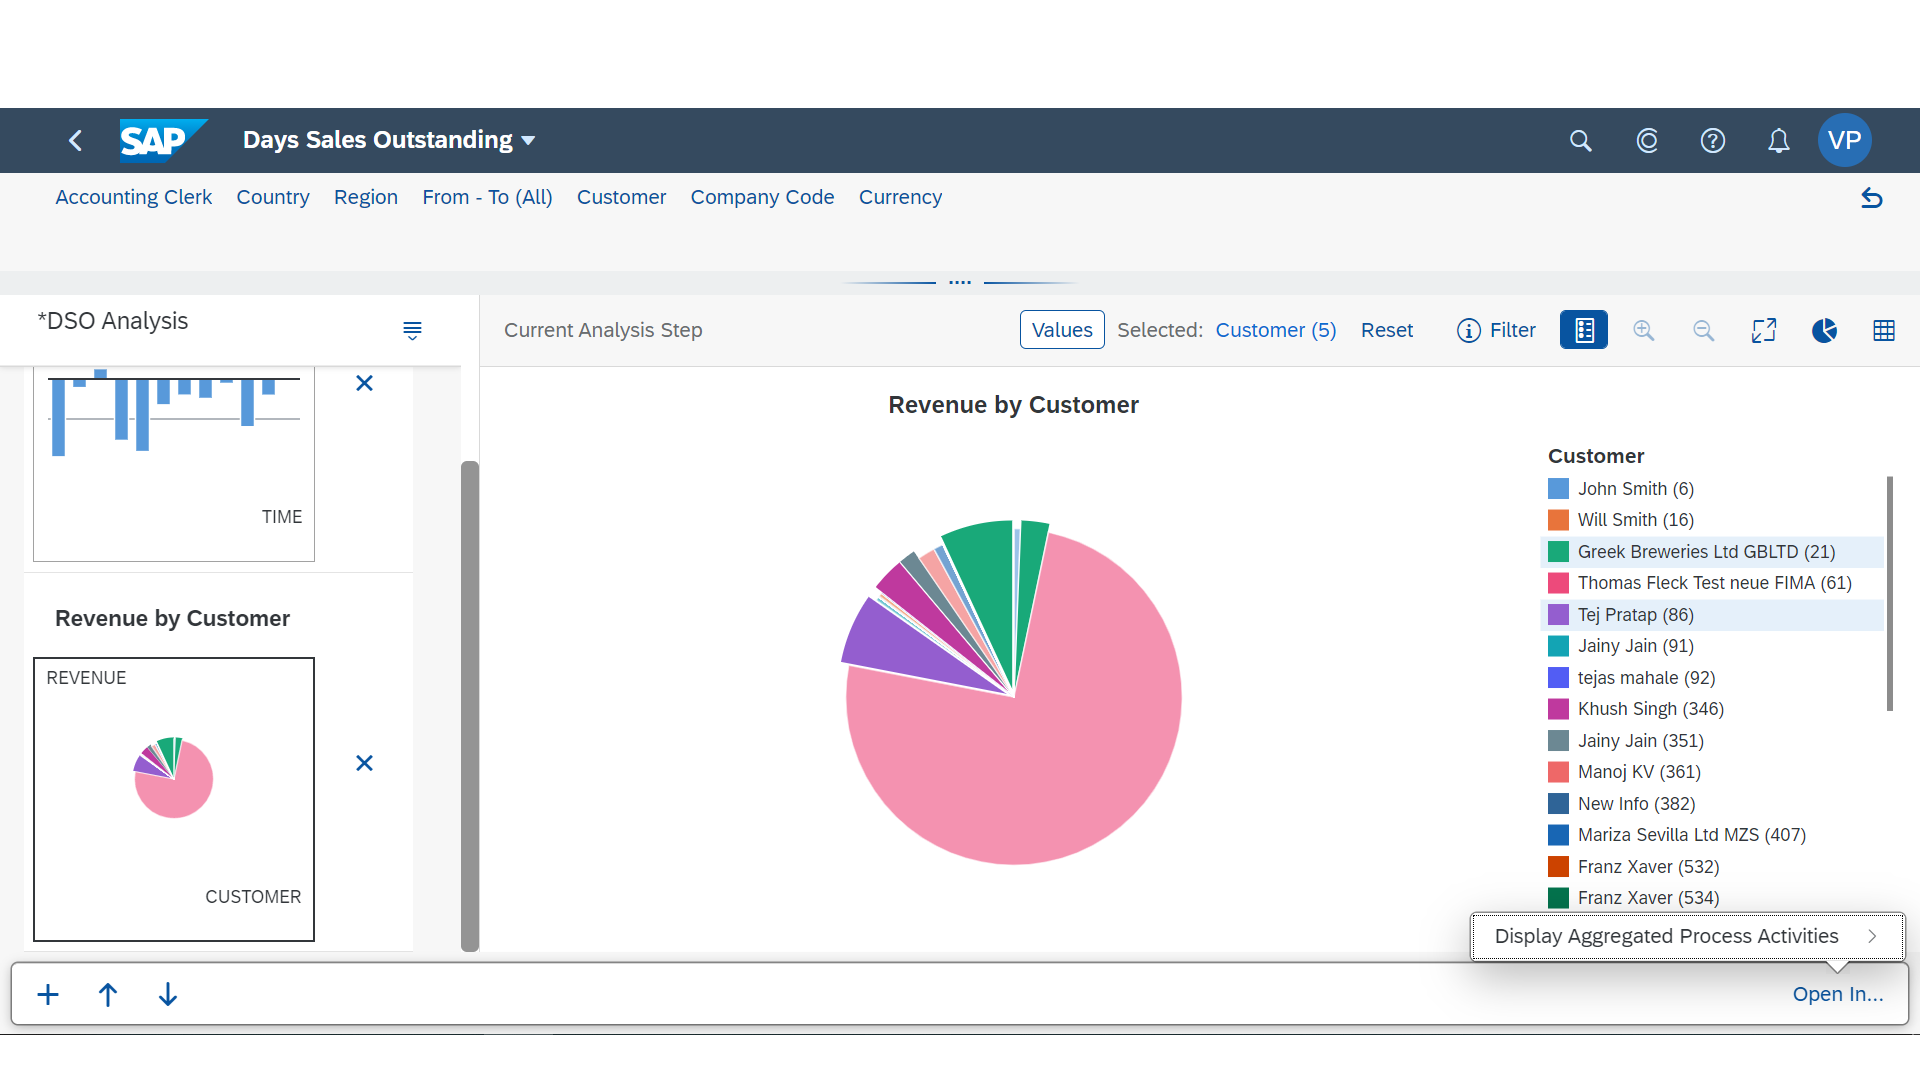
Footer toolbar
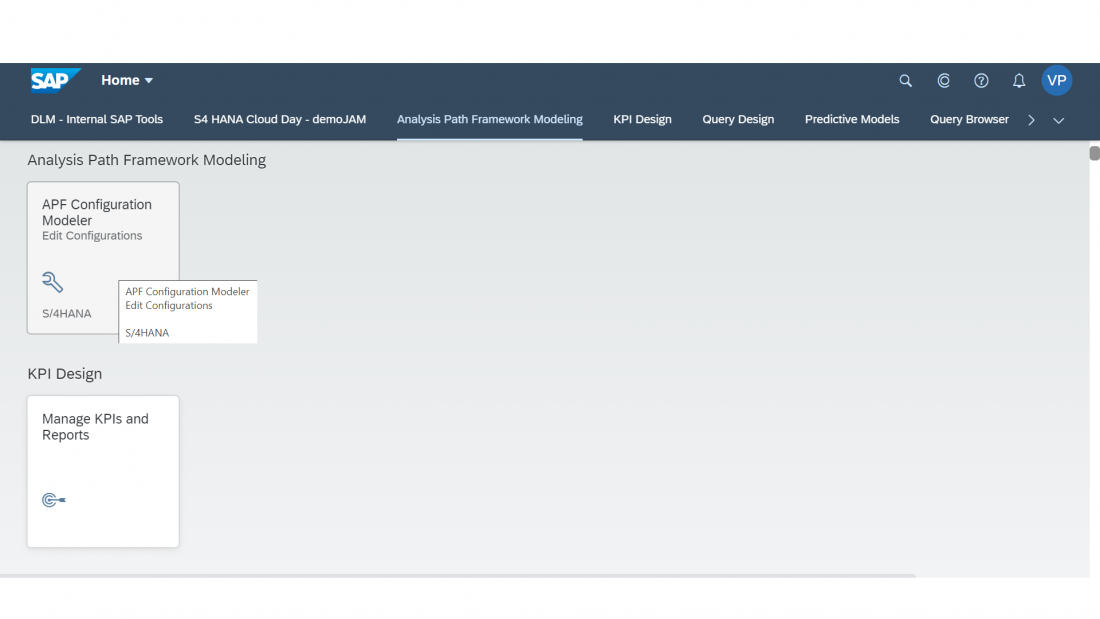
Configuration
Creating APF-based apps is simple. The APF Configuration Modeler app allows you to define and edit APF-based apps without programming.
Configuring APF-based apps
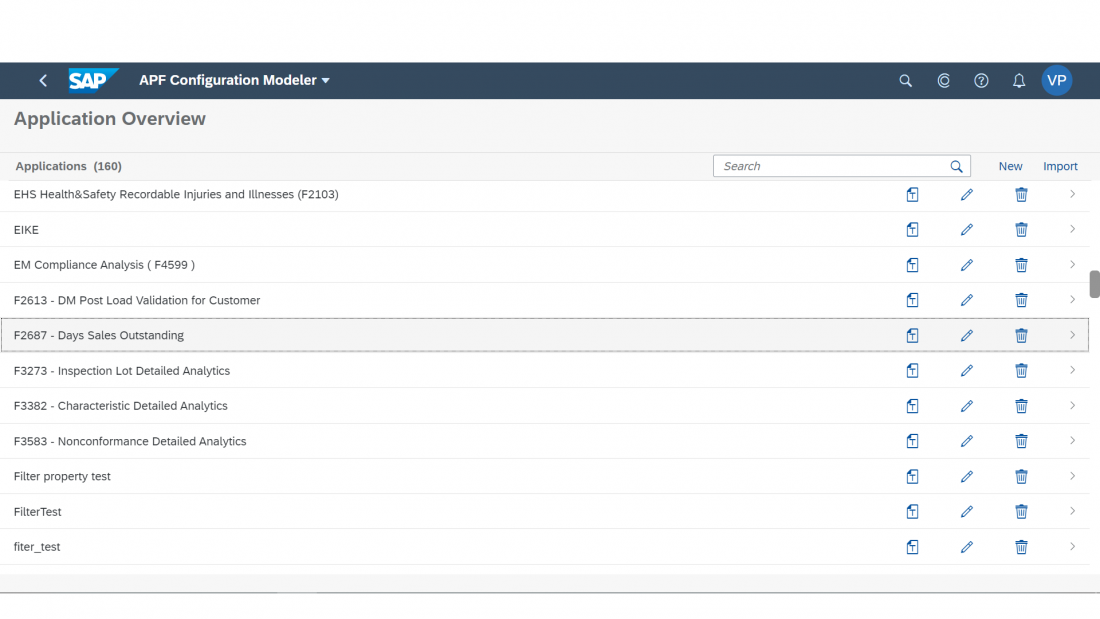
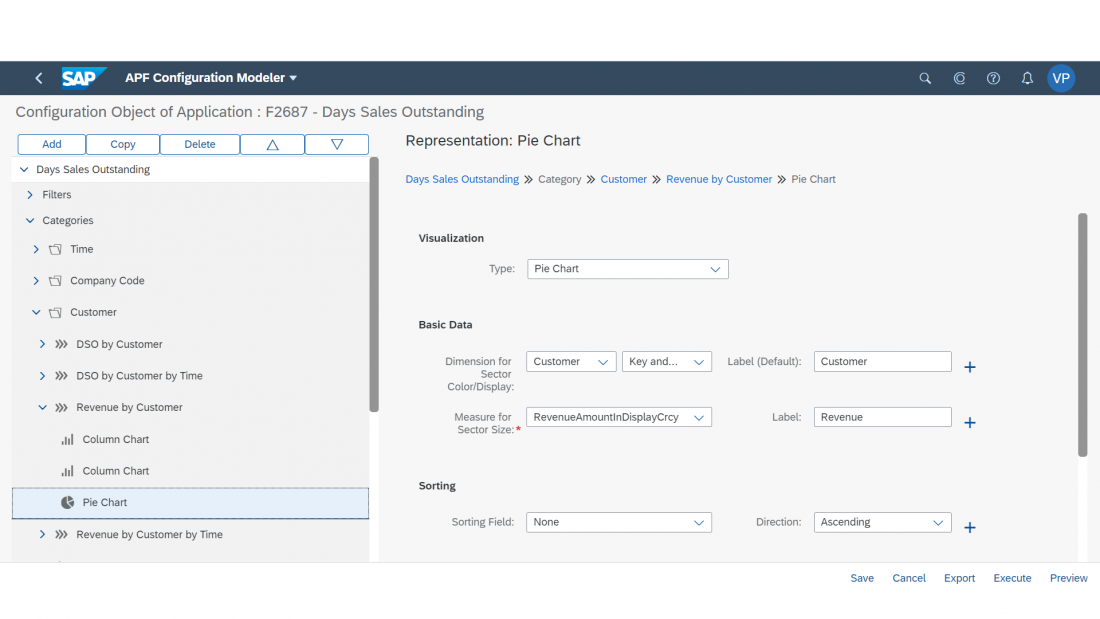
The context-sensitive user assistance enables the user to get help when needed and to find all relevant information easily and directly within the application.
Resources
Want to dive deeper? Follow the links below to find out more about Analysis Path Framework.
Elements and Controls
Implementation
- SAP Community Wiki
- Demo apps in the SAPUI5 Demo Kit:
- APF Demo Application – runtime
- APF Configuration Modeler – design time
 Your feedback has been sent to the SAP Fiori design team.