Notifications

Intro

Notifications are the best way to make users aware of a situation that requires timely action or attention. This could be a situation that has just arisen or a task triggered by a workflow.

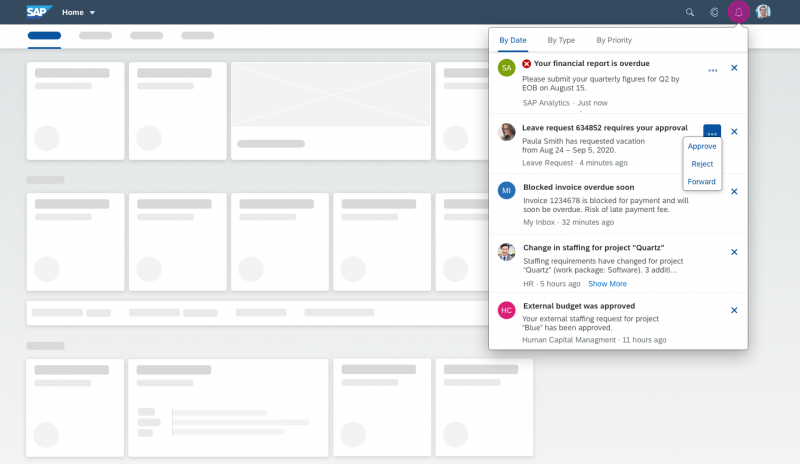
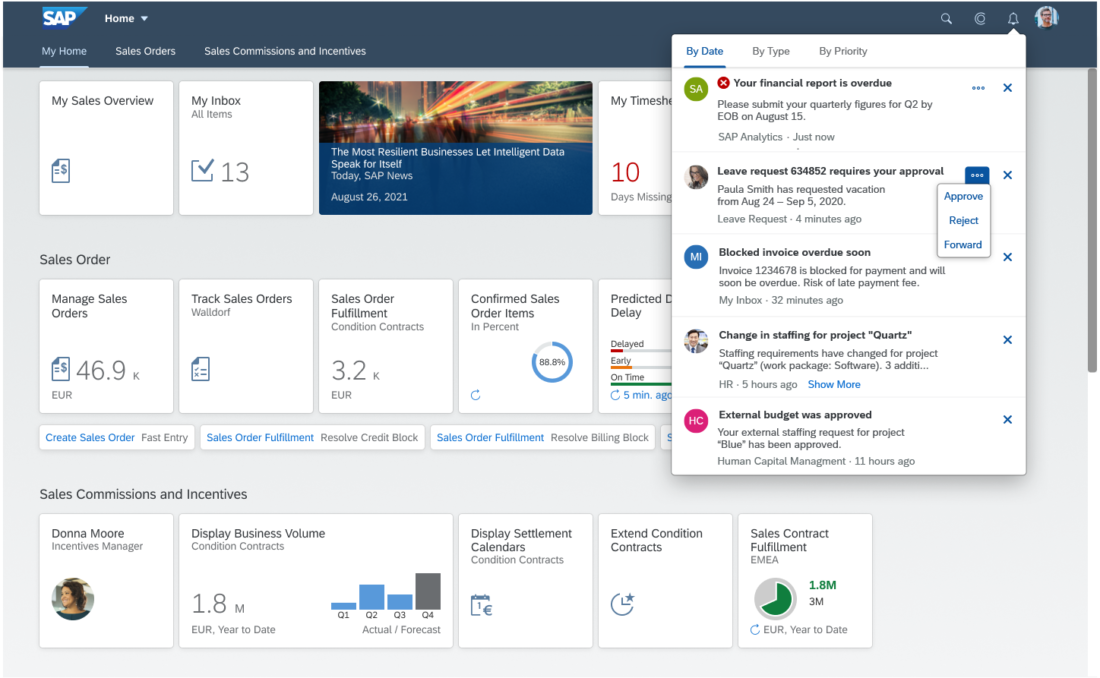
Users access notifications by clicking the bell icon in the shell bar at the top right of the screen.

In the notifications popover, the user can order notifications in various ways, take action, and navigate to the source of a specific notification.

Usage

  • Use notifications to make users aware of situations that require attention.
  • Reduce the amount of information and the number of actions to a minimum, but provide enough information to help users decide if the information is important.
  • Use notification list items and notification list groups only in the SAP Fiori notifications popover.

Responsiveness

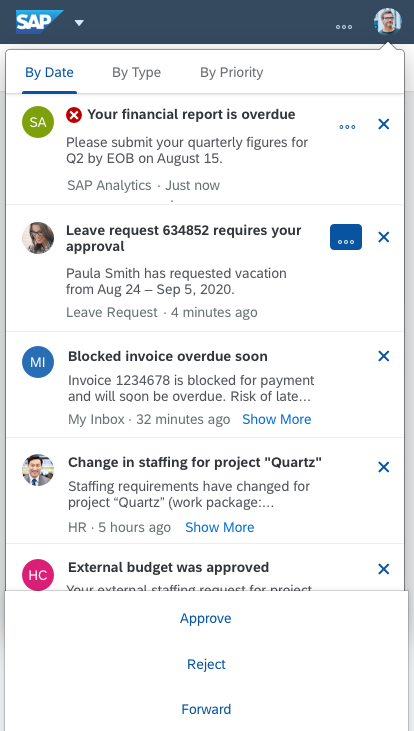
Notifications are fully responsive. For smaller screens, the actions move into the overflow and remain available on mobile devices.

Users can access truncated text by pressing a Show More button that expands the item. Nevertheless, we recommend avoiding truncation when an item is displayed on a desktop device.

Size S
Size S
Size XL
Size XL

Types

Individual notification list items are aggregated into notification list groups, based on sort criteria.
The groups are determined by date (newest to oldest), by type (A-Z), or by priority (high to low).

Properties for notification list items:

  1. Image
  2. Priority
  3. Title*
  4. Action
  5. Operation*
  6. Subtitle
  7. Author/Source
  8. Timestamp*
  9. Show/hide truncated text (Show More, Show Less)
Schematic visualization of a notification item

Properties for notification list groups:

  1. Expand group*
  2. Group priority
  3. Title*
  4. Group item counter*
  5. Bulk actions
  6. Bulk operations*
Schematic visualization of a notification group

* Mandatory properties

Components

Notification List

Items are added to the list based on internal events within apps or systems. The list can display various types of notifications, which can differ in terms of appearance, content, and functionality. The list can be ordered as follows:

By Date

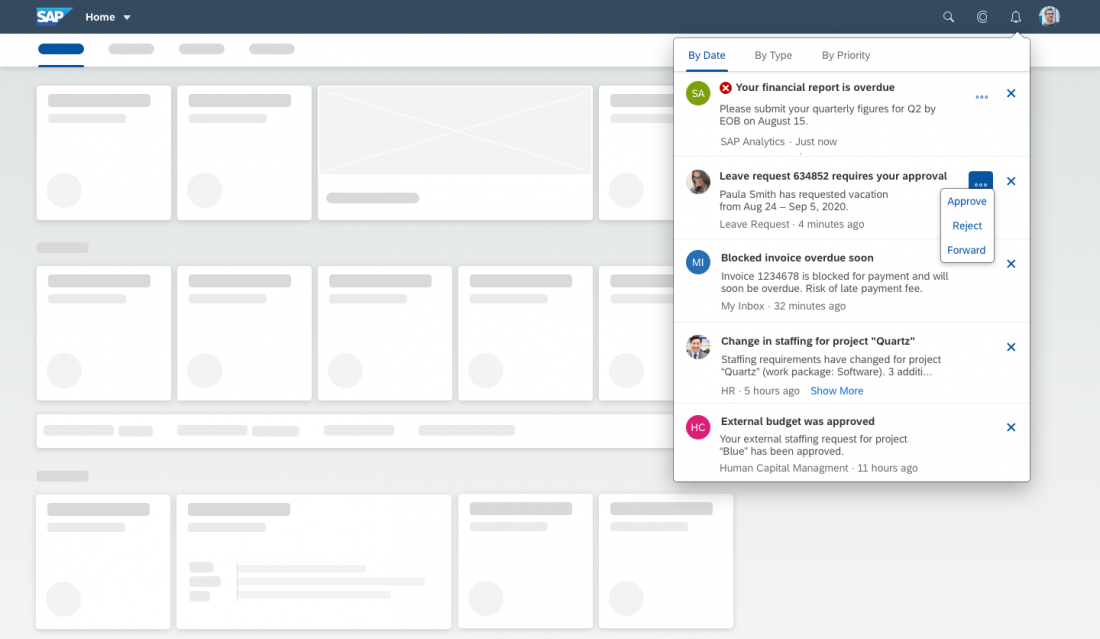
The list is ordered by the timestamp, meaning that the most recent notification appears first. The order resembles a common inbox.

By Type

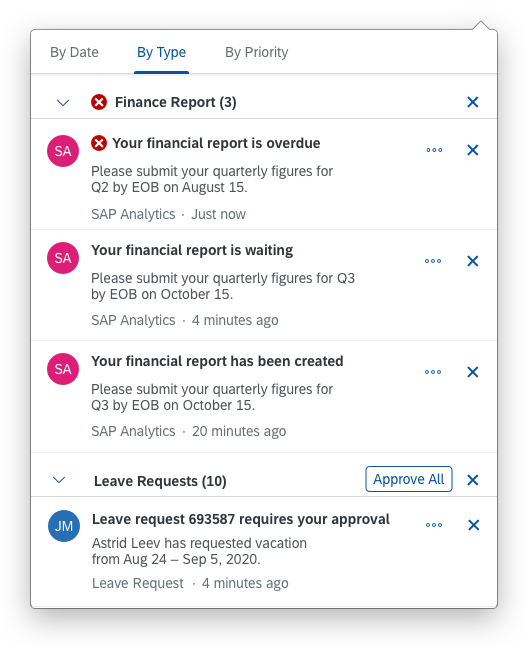
If the user chooses to order the items by type (= by app), they appear as grouped notifications ordered from A-Z. Ordering by the type makes it easier for the user to handle a high volume of notifications, and to act on all notifications for a group at once.

The highest-priority item defines the priority for the group.

Bulk actions are available when the group is open, but users can still execute single actions within the notification group. System administrators can hide bulk actions.

By Priority

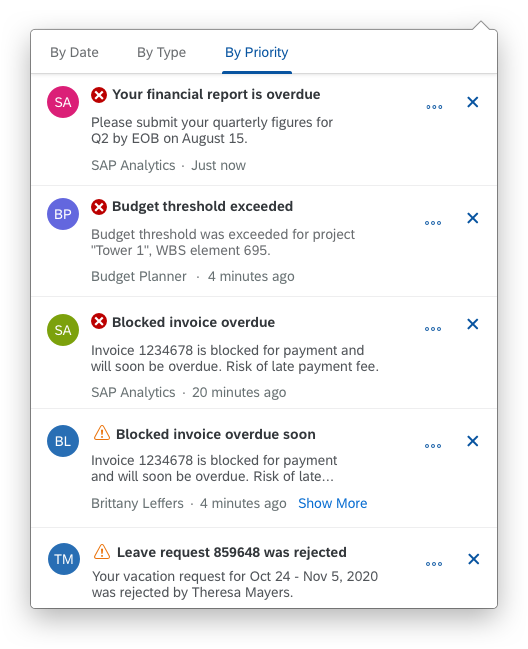
The items are ordered from highest to lowest priority.

Notifications sorted by date
Notifications sorted by type
Notifications sorted by priority

Icon and Badge

The Notifications icon button is embedded in the shell bar and is the central access point for all notifications.

  • A counter and red badge appears over the upper right-hand corner of the notification icon every time a new notification is added to the list. It displays the number of new notifications.
  • Truncation:
    Desktop: If the notification count is 1000 or more, the counter shows +999.
    Mobile: If the notification count is 100 or more, the counter shows +99.
  • The badge is set to zero when the user opens the notification popover.
  • When the notification popover is displayed, the badge continues to function as usual.
Notifications - Icon/badge

Banner

High-priority notifications are shown using the banner. The banner appears on the upper right-hand corner of the screen for a short period of time and then disappears. We recommend setting a notification to high priority if you need to get the user’s immediate attention. The banner is shown on all floorplans.

Notification banner
Notification banner

Groups

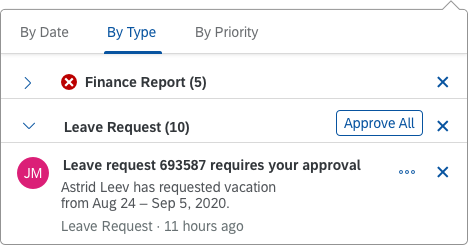
If the notification list is ordered by type/app, single notification items are aggregated in one group. Within a group, single items retain their interaction principles, but the user can also execute bulk actions on an entire group. The icon buttons  (Expand Group) and  (Collapse Group) display and hide the individual items.

  • The highest priority for a single item within a group defines the priority for the entire group.
  • The entire group can be dismissed at once. However, this does not affect processes behind the notifications. An item that was deleted from the notification list might still need to be processed.
  • We strongly recommend including a count in the group headline.

Hint: Bulk actions are only available when a group is expanded and can be hidden by the system administrator. Single actions can still be executed within a group and can also be hidden.

Notification group
Notification group

Items

The notification item contains several properties:

Actions

Actions are associated with notifications to allow users to act on notifications from within the notification popover. If more than one actions is exposed, all actions move into the overflow. We recommend displaying only self-explanatory actions that don’t require additional context. When notifications are sorted “By Type”, you can expose bulk actions at group level. Bulk actions are only displayed when the group is open.

Status

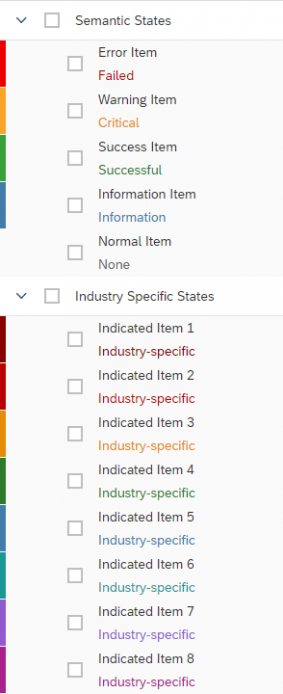
You can indicate the notification status using semantic icons within the notification item. There are four levels: red, orange, green, and grey. For more information about semantic colors, see How to Use Semantic Colors.

All high-priority notifications are also displayed as a banner to catch the user’s attention.

Operations

A notification operation can be dismissed. When dismissed, the notification item disappears from the list, but the task might still need to be processed. Bulk operations are exposed at group level.

Headline, Subtitle, Truncation 

Provide a short, meaningful headline. If necessary, expose additional content using a subtitle. Longer texts are truncated after the second line. However, we recommend avoiding truncation altogether. If a text truncates, users can display the full text using the Show More button.

Image and Author

You can associate images, initials, or icons with a notification.

There is also a property for displaying the author, which is typically combined with an image.

Read/Unread

The “read” or “unread” status of a notification is visualized using medium and bold headlines. Unclicked/unopened notifications are shown as “unread” and in bold. When an item is clicked/opened, it is shown with a medium headline.

Navigation

Navigation is triggered by clicking the item.

Content

As of today, no other content is possible nor allowed.

Notification item with a single action
Notification item with multiple actions
Notification item with
Notification item with "read" status

Settings

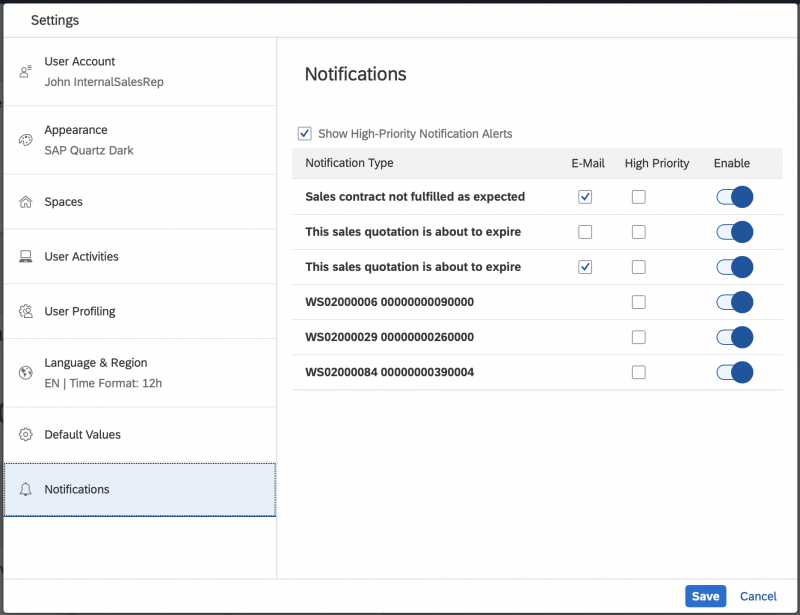
All notification types are displayed in the settings dialog. Users can switch each type on or off without affecting the underlying processes.

Users can activate the banner function for each notification type. This sets the notification status to high priority and corresponding notifications have a red status indicator. Banners are also displayed for all other high priority notifications.

If the Show High-Priority Alerts setting is switched off, banners for high-priority notifications are deactivated, and the user can work without being interrupted.

Users can also receive notifications through other channels:

  • Email: If this option is active, the user gets an email with a link to the underlying app.
  • Mobile: If this option is active, notifications are sent to a mobile device.
    Note: This feature is currently only available for Apple iOS devices and SAP S/4HANA apps. For more information, see Mobile Integration.
Notification settings

Behavior and Interaction

Accessing the Notifications

Users open and close the notification popover by clicking the notification icon in the shell bar.

Accessing notifications

Executing Actions

Actions are executed by clicking the action buttons, such as Approve or Reject.

Action
Action

Close

Clicking the Close icon   in the upper right corner of the item removes the item from the list.

Dismiss notifications

Navigation

Clicking within the notification item triggers navigation to the source.

Banner
Banner

Show More

Clicking the Show More button displays the truncated text.

Mobile Integration (SAP S/4HANA only)

Apple iOS

The app icon badge on the mobile device might have a different count to the badge for notifications in the SAP Fiori shell bar. This can happen if some notifications have been disabled in the SAP Fiori settings dialog.

On a mobile device, only non-sensitive data is exposed. For legal reasons, no business data is shown on a locked screen or passed through third party networks. To see the sensitive data, users can always access the notifications on the SAP Fiori launchpad.

Similarly, business actions cannot be displayed or executed on native notifications.

Clicking a native notification triggers navigation to the corresponding app.

Resources

Want to dive deeper? Follow the links below to find out more about related controls, the SAPUI5 implementation, and the visual design.

Elements and Controls

Implementation

Header Toolbar

The header toolbar always appears in the header of the page. One main advantage of the header bar is that this bar is always visible and will not scroll away. It contains actions that are relevant for the entire page.

Our general guideline is to use only icon buttons or text buttons. Icon and text should not be combined into one button. Buttons are always right-aligned.

Buttons are sorted from frequently-used to seldom-used. This ensures that the most important buttons go into the overflow last.

Usage

Use the header toolbar if:

  • Your page contains several controls, and the actions are valid for the entire page.

Do not use the header toolbar if:

  • You have closing or finalizing actions for the whole page. Place them in the footer toolbar instead.
  • You have actions that belong to a specific UI element. Place them as close as possible to the corresponding object (for example, in a table or chart toolbar).

Responsiveness

To enable responsiveness, use the OverflowToolbar control. For more information, see the corresponding section in the Toolbar Overview article.

The height of the toolbar changes on desktops (compact mode), tablets, and smartphones (cozy mode). For more information about cozy and compact modes, see Content Density.

Header toolbar – Size S
Header toolbar – Size M
Header toolbar – Size XL

Components

The header toolbar can contain the following components:

  • App-specific business actions
  • Generic actions


The following actions count as generic:

  • Flag and Favorite
  • Share menu
  • Overflow
  • Paging

Behavior and Interaction

Business Actions

If needed, the app team can define their own actions for the app. In this case, the text buttons should contain a short, unambiguous text that explains what action the button performs. A button text is usually a single-word verb (for example, Synchronize). Note that translated UIs may increase the length of the text string.

Text vs. Icon Buttons

Use text-only buttons for all business actions (such as Edit and Create).
Use icon buttons only for generic actions (such as  for Share). For icons, always provide a suitable text label as a tooltip.

Business action with icon button in header toolbar
Actions in the header toolbar

Edit and Delete (1)

If you want to perform a global edit action, use the Edit button.

If you want to perform a global delete action, use the Delete button.

Add / Create (2)

Place the Add or Create (item or row) action as close to the content as possible.

If the Add or Create action is a main function, don’t move the action into the overflow.

For more information on when to use add or create, see UI Text Guidelines

Favorite and Flag (Generic) (3)

Users can mark objects as a favorite or flag objects for quick subsequent retrieval. The user does this by clicking the relevant generic Favorite or Flag button in the header toolbar. For more information, see Flag and Favorite.

Share (Generic) (4)

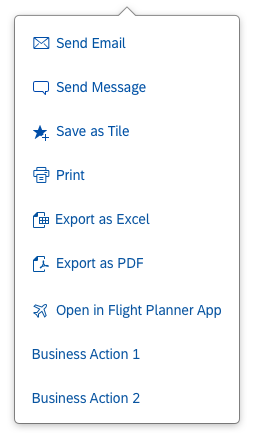
The Share menu allows users to work with content outside the app they are currently using. It can include a variety of actions. All the buttons contain either text only or a combination of an icon and text. The following actions can be used and complemented by each app:

  • Send Email (icon: email  )
  • Discuss in SAP Jam (icon: discussion-2  )
  • Share in SAP Jam (icon: share-2  )
  • Send Message (icon: post  )
  • Save as Tile (icon: add favorite  )
  • Print (icon: print  )
  • Export as Excel (icon: Excel attachment  )
  • Export as PDF (icon: pdf attachment  )
  • Export As…
  • Open In…

If you expect the user to use the Open In… functionality frequently, place it directly in the header toolbar.

The Share action can appear on the full screen or the details screen, and is never moved into the overflow menu. It is always right-aligned. The overflow starts to the right side of the Share icon.

Possible actions in the 'Share' menu
Open share popover in header toolbar

Overflow (Generic) (5)

If apps use the overflow toolbar, the overflow is generated automatically. The overflow is activated if there is not enough space for all the actions on the toolbar, or if some actions are considered less important than others. In this case, the app team decides that only certain actions appear in the overflow.

The app team also decides whether some actions are so important that they should never move into the overflow.

The  “” (overflow) button can be used to toggle the overflow menu on and off.

The user clicks the overflow button to open a popover. In this action sheet, all icon buttons are labeled with text and the user can overflow the following controls:

  • sap.m.SegmentedButton – when in the overflow, the segmented button is in select mode and looks like a select button, although it is technically still a segmented button
  • sap.m.Select – when in the overflow, it is always in default mode to take advantage of the extra space, even if it was set to icon-only mode in the toolbar
  • sap.m.ToggleButton
  • sap.m.Checkbox
  • sap.m.Input
  • sap.m.SearchField
  • sap.m.ComboBox
  • sap.m.DateTimeInput

Split-screen layouts have their own overflow menus.

All buttons go into the overflow from right to left. This ensures that the most important buttons are the last to be moved into the overflow menu.

Header toolbar with open overflow

Paging (Layout)

Use the paging buttons if you want to navigate to the previous or next object.

Use the following tooltip labels:

  • Icon: Up arrow
    Tooltip label: Previous [Object]
    Example: Previous Purchase Order Item
  • Icon: Down arrow
    Tooltip label: Next [Object]
    Example: Next Purchase Order Item

To avoid translation issues, never use “Next” and “Previous” as standalone labels. Always state the object you are navigating to.

If you are using the Share button, place paging buttons to the right of the Share button.

Paging buttons in header toolbar

Styles

  • Use button styles only if they help the user, and not for decoration.
  • Use them for primary actions, such as Edit and Create.
  • Use a positive/negative style (property: type = accept or rejector an emphasized style (property: type emphasized).
  • Use only one emphasized button per toolbar and never mix emphasized and semantic buttons.
    Exception 1: Messaging button appears
    Exception 2: Object has been flagged or marked as a favorite

For more information, see Button.

Guidelines

For more information, see the Guidelines section in the toolbar overview article.

Resources

Want to dive deeper? Follow the links below to find out more about related controls, the SAPUI5 implementation, and the visual design.
Elements and Controls

Implementation

Dynamic Page Layout

The dynamic page is the foundation for all pages in SAP Fiori. It is a generic layout control designed to support various floorplans and use cases. As a result, the content of both the header and the page can vary. Depending on your use case, you can either use one of the predefined floorplans or create your own layout.

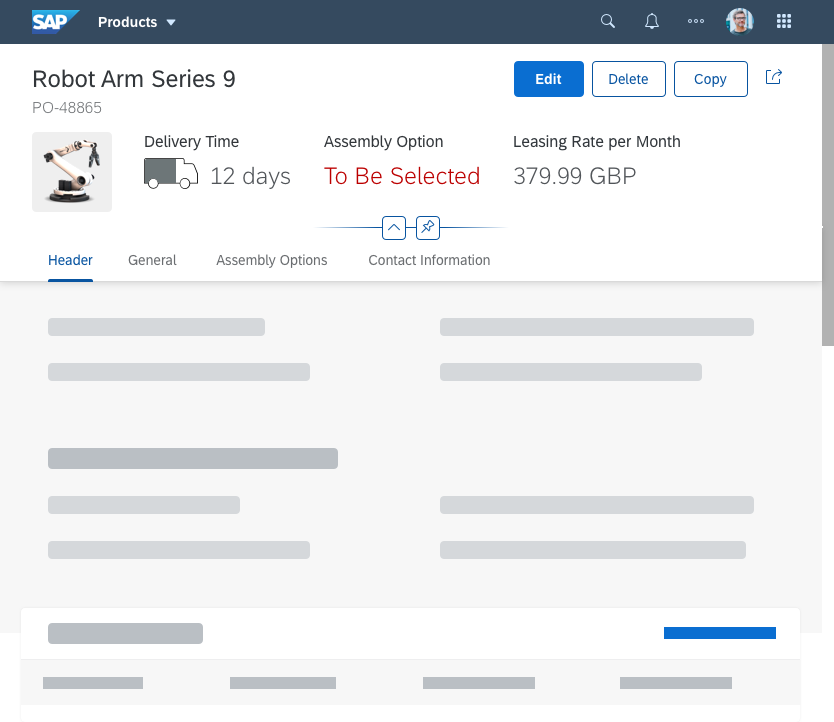
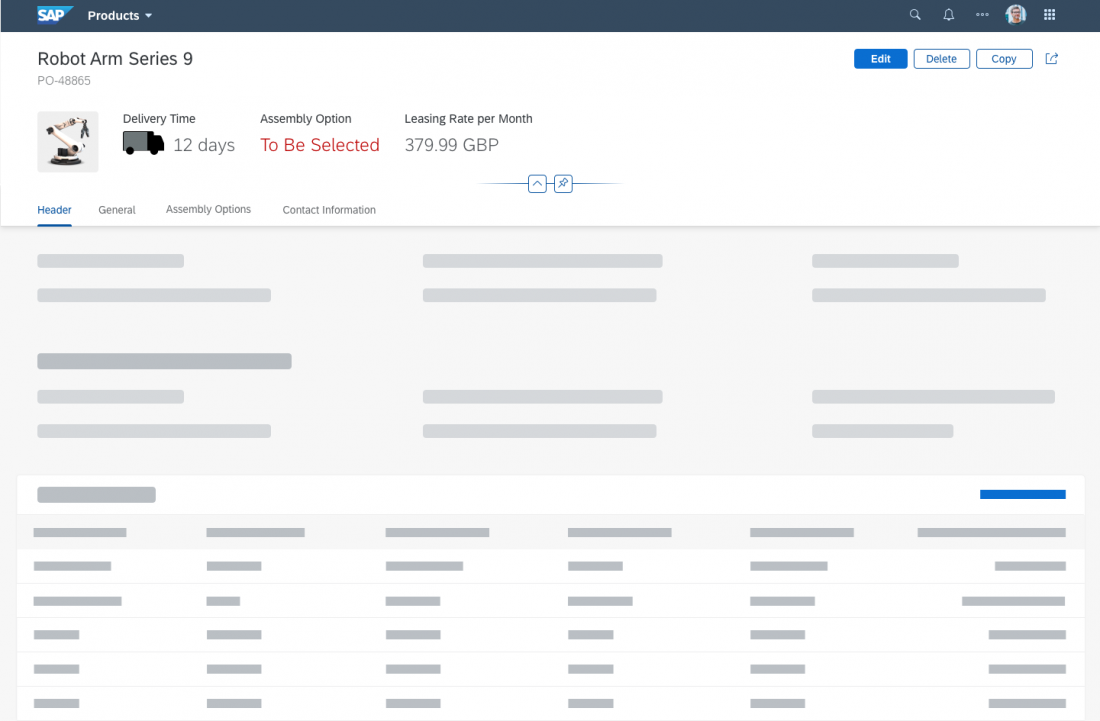
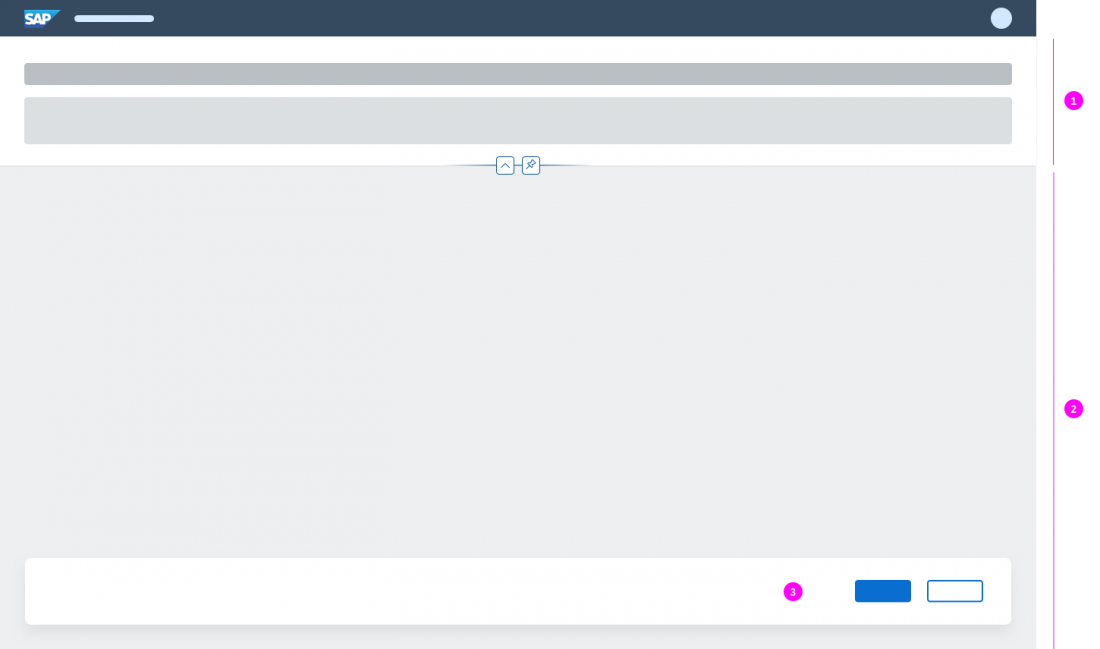
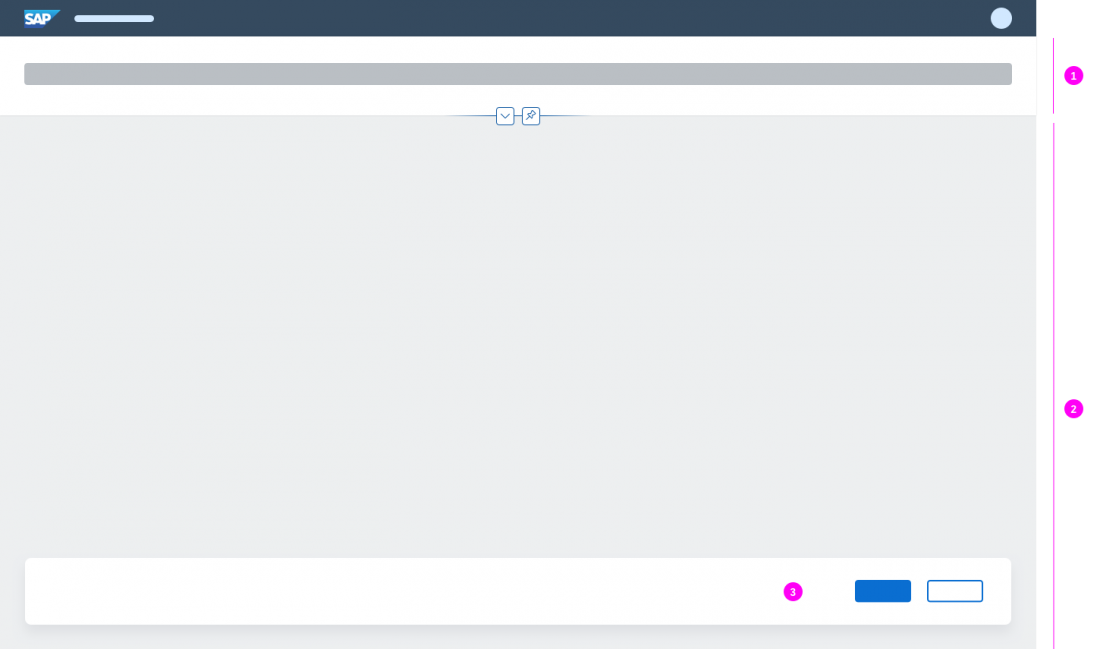
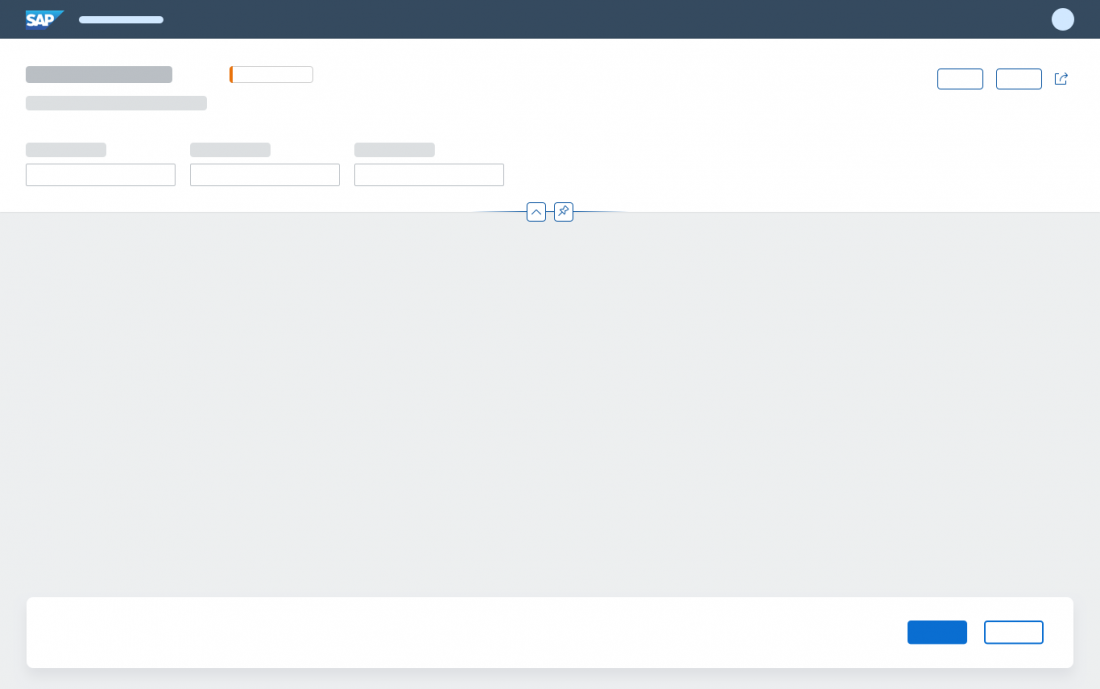
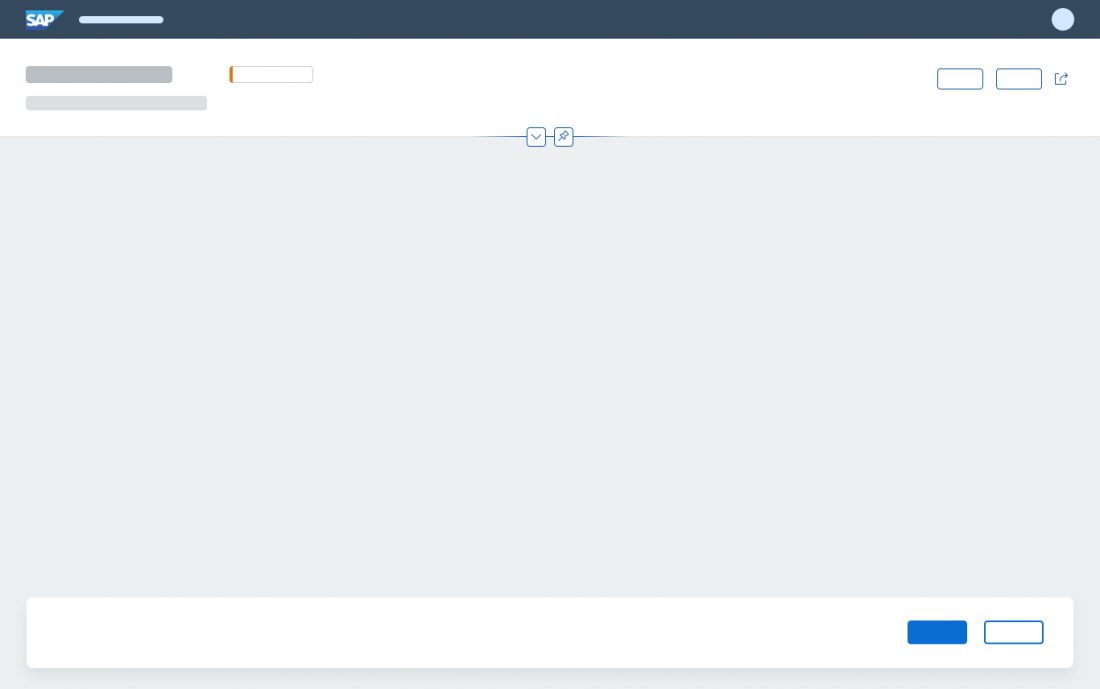
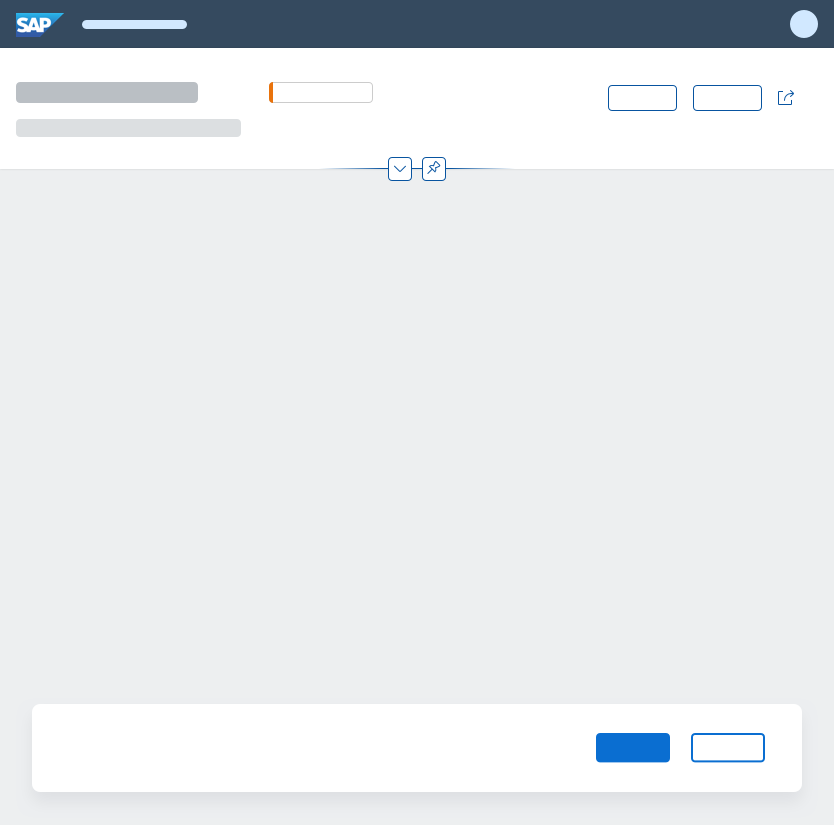
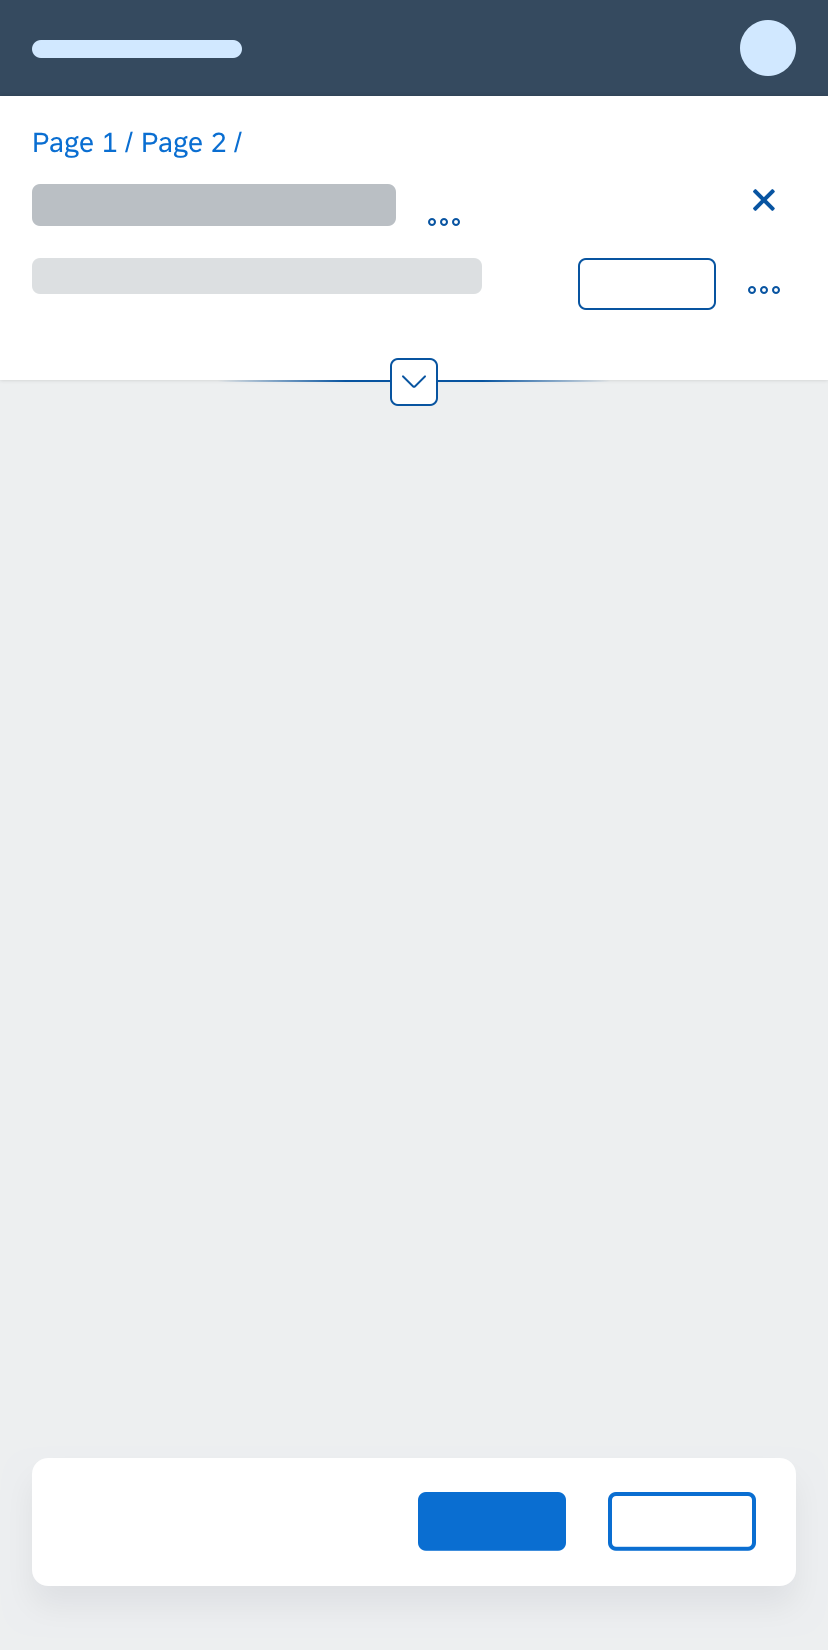
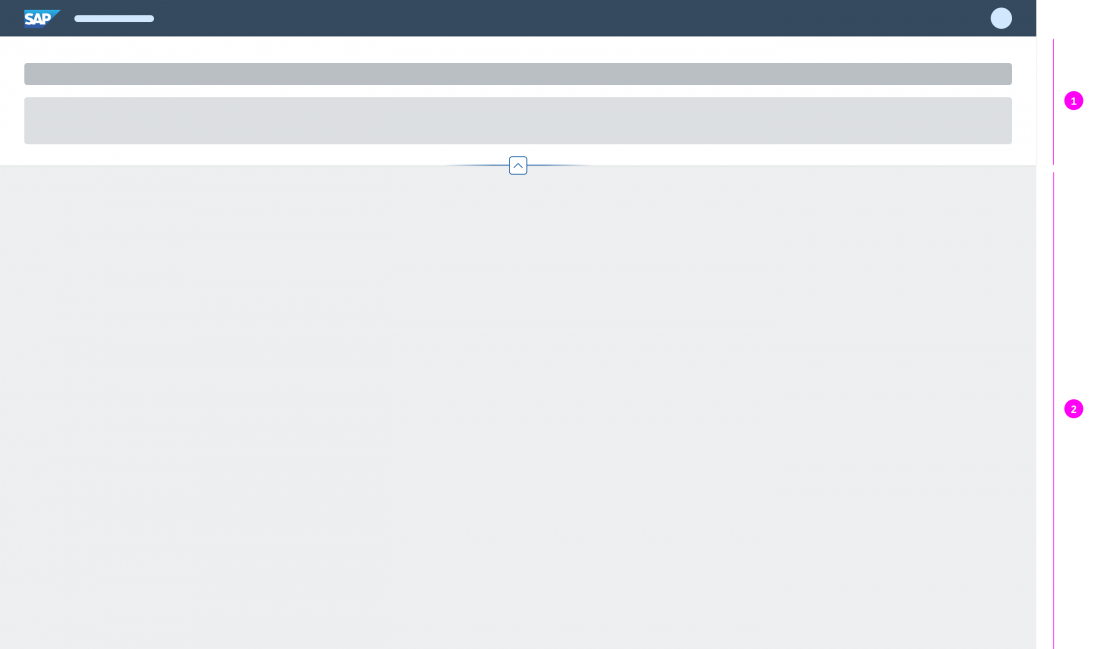
One part of the dynamic page header (1) is collapsible, which helps users to focus on the actual page content (2), while ensuring that important header information and actions are readily available. The dynamic page also includes an optional footer toolbar (3) for closing or finalizing actions that impact the whole page.

All SAP Fiori floorplans use the dynamic page, or are visually aligned to look the same. For detailed guidance, see the corresponding floorplan articles.

The following floorplans use the dynamic page:

The following floorplans are using the dynamic page header:

When to Use

Use the dynamic page if:

Do not use the dynamic page if:

Dynamic Page vs. Semantic Page

The dynamic page is a skeleton structure that comes with empty content containers (page header, page content) and built-in responsive behavior.

This basic structure can be “filled” with content elements in three ways:

  • Automatically: If you are using an SAP Fiori element floorplan, the content of the dynamic page is provided out of the box.
  • Via the semantic page (recommended for freestyle apps): If you are creating a floorplan from scratch, you can use the semantic page (sap.f.semanticPage) to create a freestyle page. The semantic page is a separate control that comes with built-in logic for adding predefined content elements to the page, such as a title, global actions, and a footer toolbar. Using the semantic page significantly reduces the development effort for app teams, and ensures that the header and footer content is structured consistently.
    Note that in this case, the app developer uses only the semantic page control (which already embeds the dynamic page), and not the dynamic page control itself.
  • Manually: Technically, it’s possible to build the dynamic page from scratch. However, implementing the dynamic page manually is a significant development effort! Only consider this option in exceptional cases (for example, if you have special requirements for a freestyle app that cannot be implemented using the preconfigured semantic page control).

Components

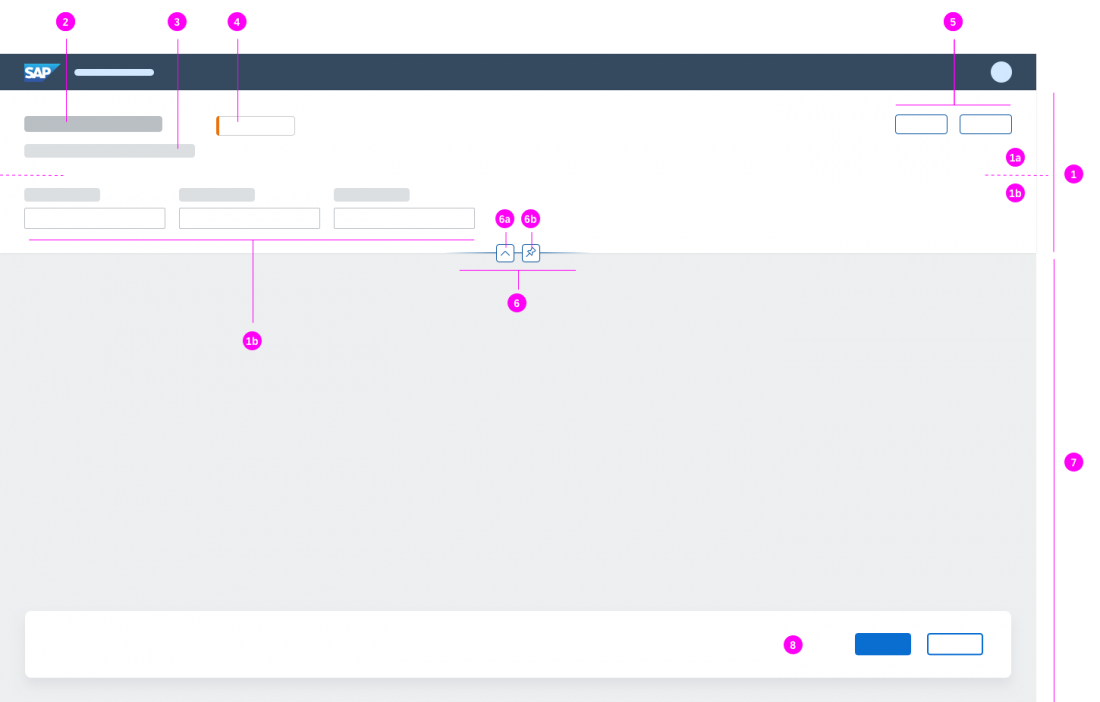
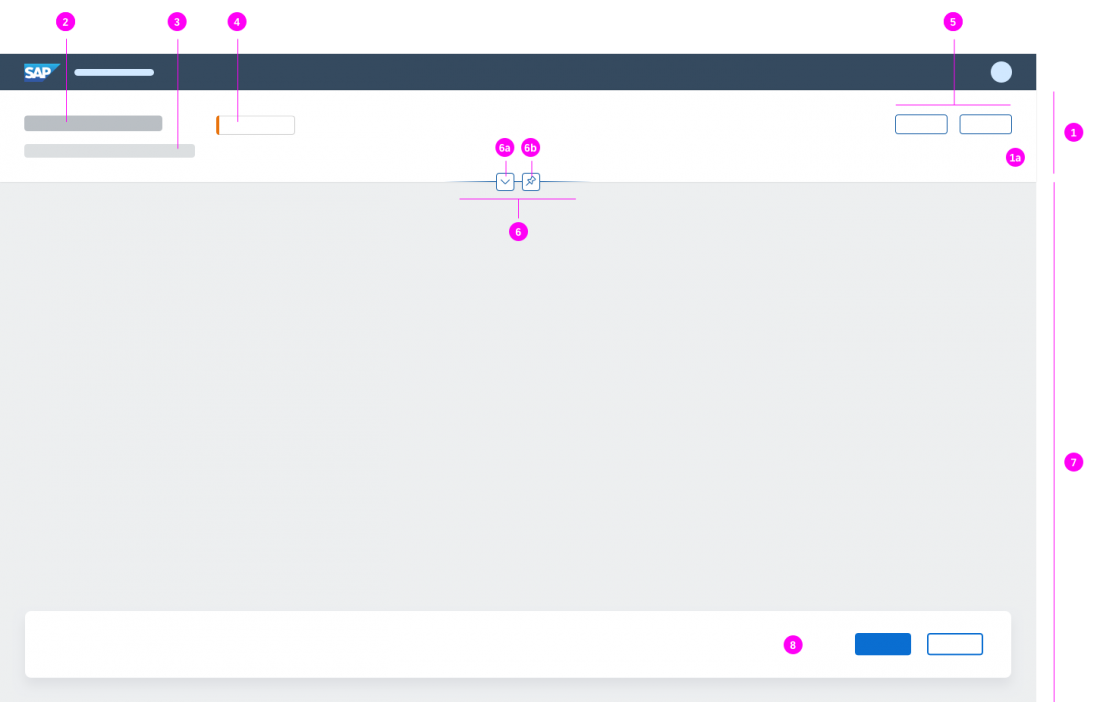
Like all layouts, the dynamic page is below the shell bar of the SAP Fiori launchpad, which is always at the very top. The dynamic page consists of the following areas:

  1. Dynamic page header, comprising the header title (1a) and the expandable/collapsible header content (1b)
  2. Title
  3. Subtitle/summary
  4. Key information / KPI
  5. Global actions
  6. Header features to expand/collapse (6a) and pin/unpin (6b) the header
  7. Page content (differs depending on the use case and floorplan)
  8. Footer toolbar with finalizing actions

Dynamic Page Header

The dynamic page header contains the header title (mandatory) and the header content (optional).

Header Title

Dynamic page - Header title example

The header title bar (sap.f.DynamicPageTitle) always contains one of the following elements:

Mandatory Elements

  • Title (1): The title is located on the left of the header title bar, and is always visible. The title can contain one of the following components:

Optional Elements

  • Subtitle/summary (2)
    Placement: Always below the title. The subtitle is often used to summarize the most important information in the collapsed header content. For example, if the header area contains a filter (as in a list reportanalytical list page, or overview page), the subtitle can be used to display the “Filtered By” information.
  • Breadcrumb (3)
    Placement: Above the title. Depending on the floorplan and use case, you can add breadcrumb navigation. The breadcrumb is located above the header title, and is primarily used to display the hierarchy of subpages within an object page.
    Note that in the flexible column layout, the breadcrumb is only available in full screen mode, and only if just one column is visible.
  • Key information (4)
    Placement: In the middle area, but left-aligned. Floorplans can also contain key information, such as text, mini facets, and KPI tags.
    Note that currently, KPI tags are only used within the analytical list page and worklist floorplans.
  • Global actions (5)
    Placement: Global actions for the entire floorplan appear on the right-hand side of the header title bar. Always offer the actions as buttons, visualized either as text or icons. For more information, see Header Toolbar. In the collapsed mode, the header title offers the same actions as in the expanded mode and keeps them actionable.
  • Layout actions (6)
    Placement: Typical layout actions are the CloseFull Screen, or Exit Full Screen icons, which are mainly offered by the flexible column layout. Depending on the screen size, the layout actions are placed either on the very right of the global actions toolbar, separated by a divider line, or above the global actions (see more in the Responsiveness section). Note that the dynamic page only provides the area for the layout actions. The navigation actions themselves are defined separately (for example, using the semantic page).
Guidelines

  • Do not remove or disable the actions within the global action toolbar when the header content is collapsed.
  • In the flexible column layout, ensure that the icons for the Close or Full Screen / Exit Full Screen actions always stay on the very right. Their position then remains stable, even if other actions are added (such as the paging buttons  and  ). The Close and Full Screen / Exit Full Screen actions must never move into the overflow.

Header Content

Dynamic page - Header content example

The optional header content (sap.f.DynamicPageHeader) is located below the header title. You can place any components in the header content area (1) as long as they follow the guidelines for the respective floorplan.

When the dynamic page header collapses, the header content area is hidden. If there is no header content, the header content area is hidden automatically. In the latter case, the header title is not interactive (snap on scroll or snap on click) and there is no expand/collapse header feature.

Header Features

Dynamic page - Header features

The header features (3) allow users to control the visibility of header content using two icon buttons at bottom of the header content area:

  1. Expand/collapse header or   
  2. Pin/unpin header content 

Footer Toolbar

Dynamic page - Footer toolbar

The footer toolbar (sap.m.Toolbar) is an optional part of the dynamic page. You can use it to offer closing or finalizing actions.

Combining the Dynamic Page with the Flexible Column Layout

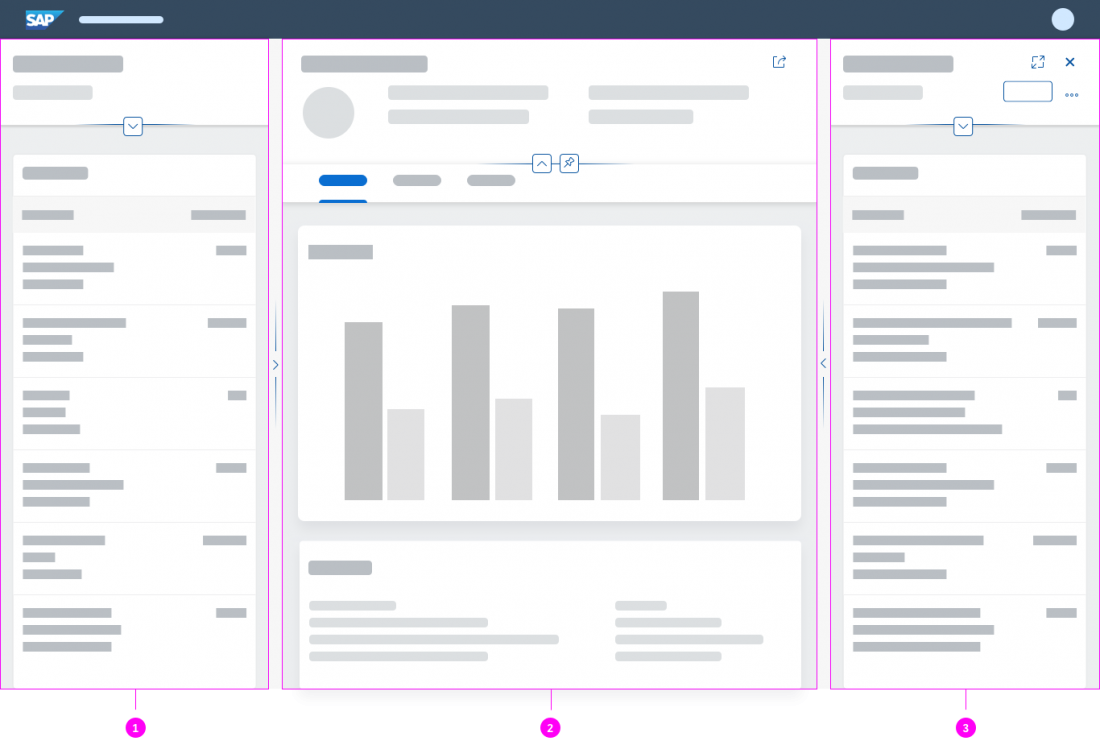
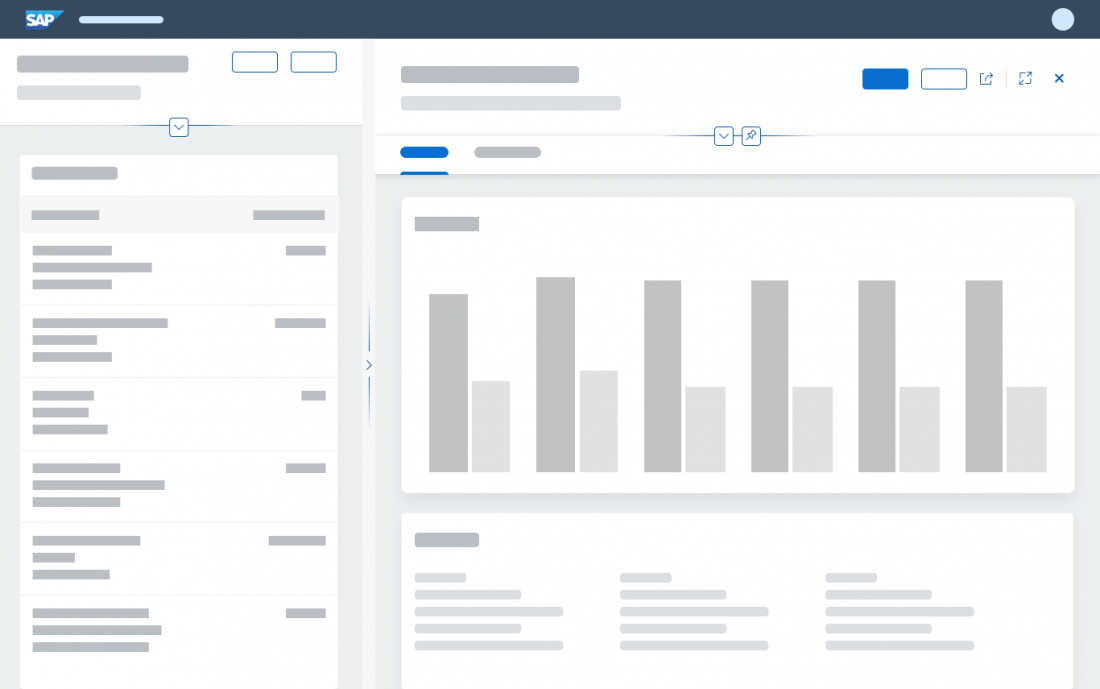
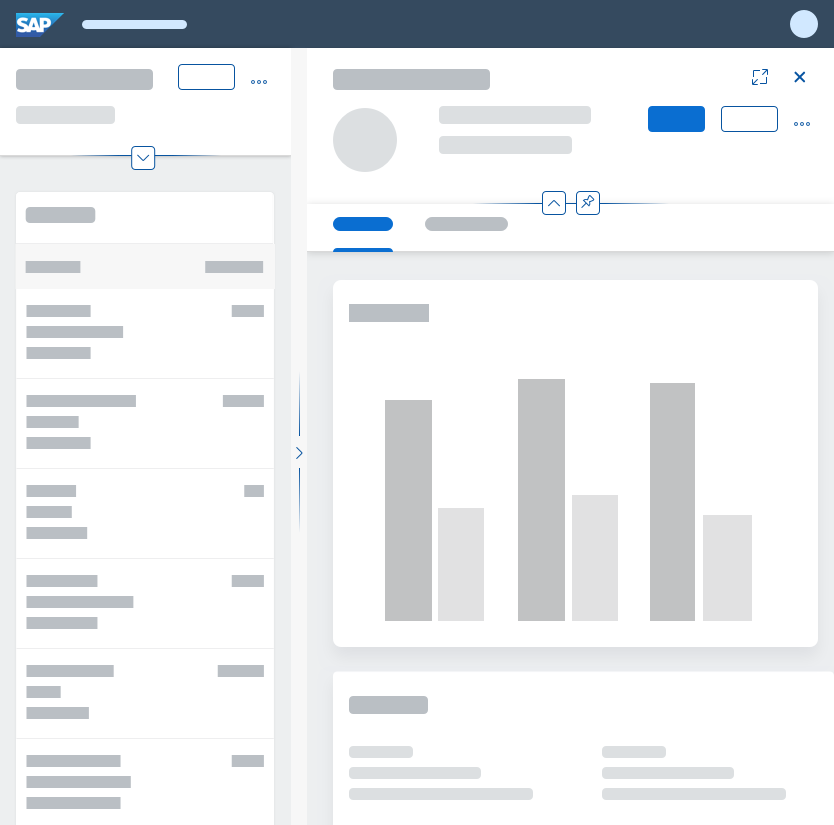
The layout of the dynamic page is responsive and optimized for use within a flexible column layout. Each column (1, 2, 3) can contain its own dynamic page with a different floorplan, depending on the use case.

Dynamic page inside the flexible column layout

Behavior and Interaction

Initial Focus

The dynamic page itself doesn’t set an initial focus. The initial focus depends on the floorplan that is using the dynamic page and the specific app use case.

Dynamic Page Header

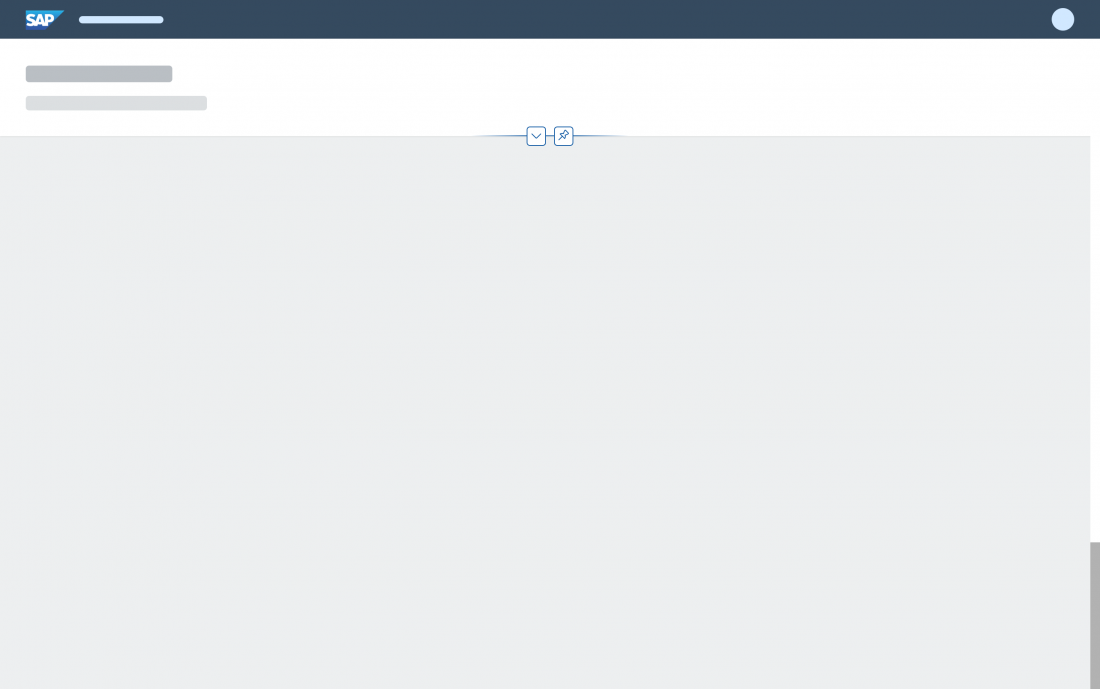
The dynamic page header supports three optional interaction patterns that can be combined. To show more of the actual page content, the header content can collapse or expand using defined triggers (snap on scroll and snap on click). In addition, users can fix the header content while scrolling through the page content with the pin feature. The combined usage of all three patterns is recommended and activated by default.

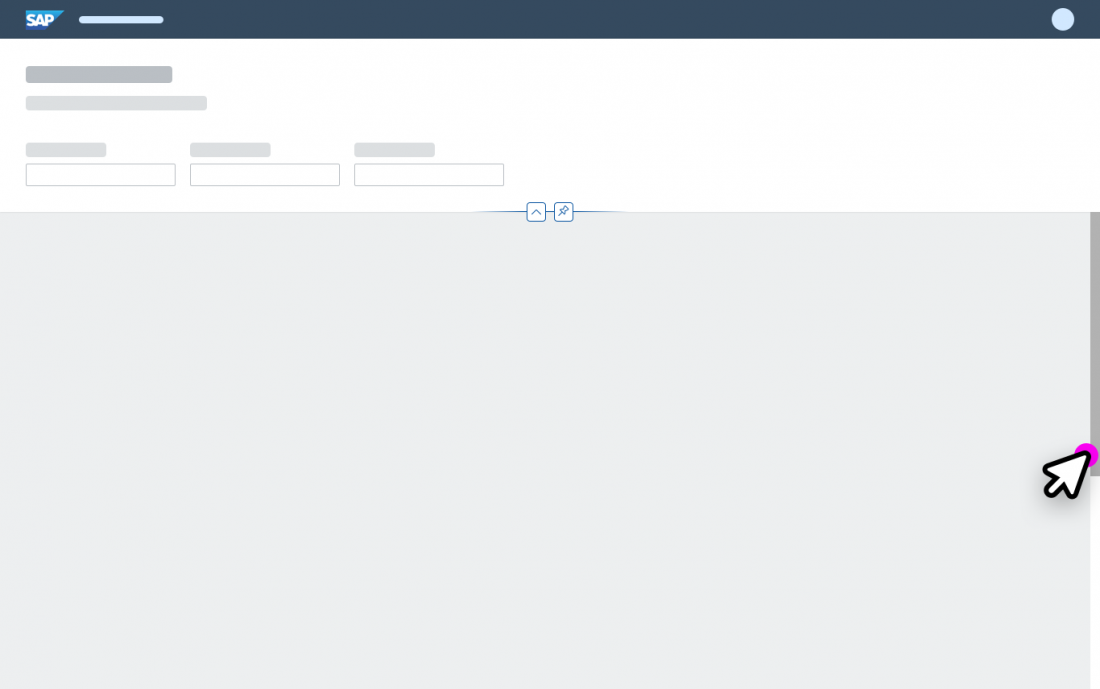
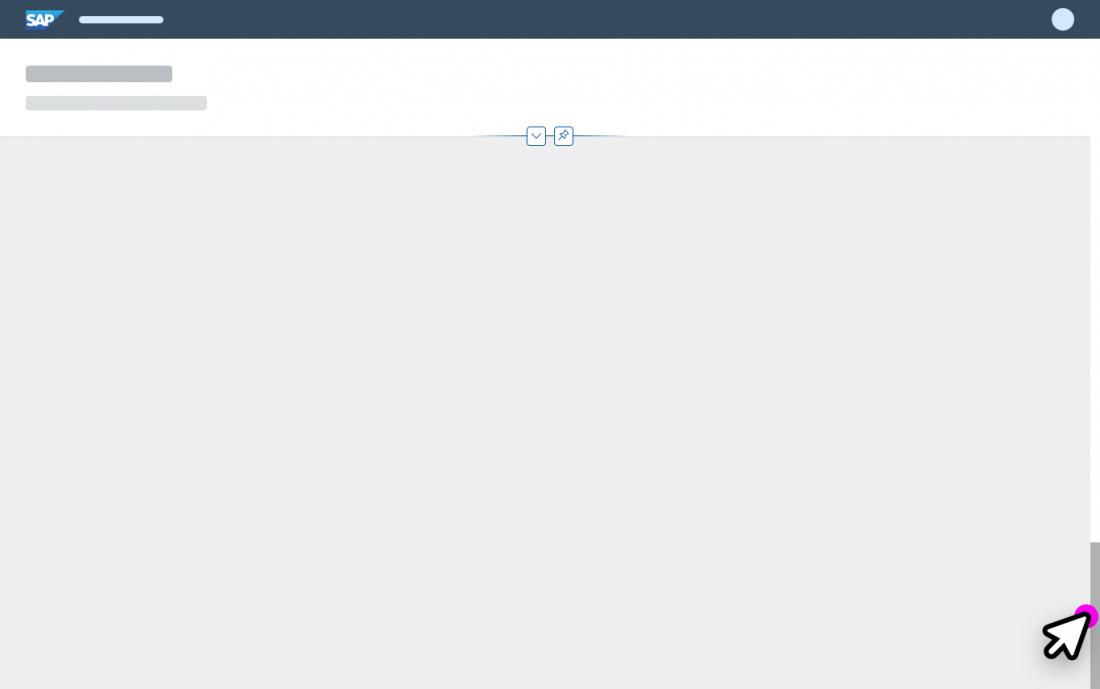
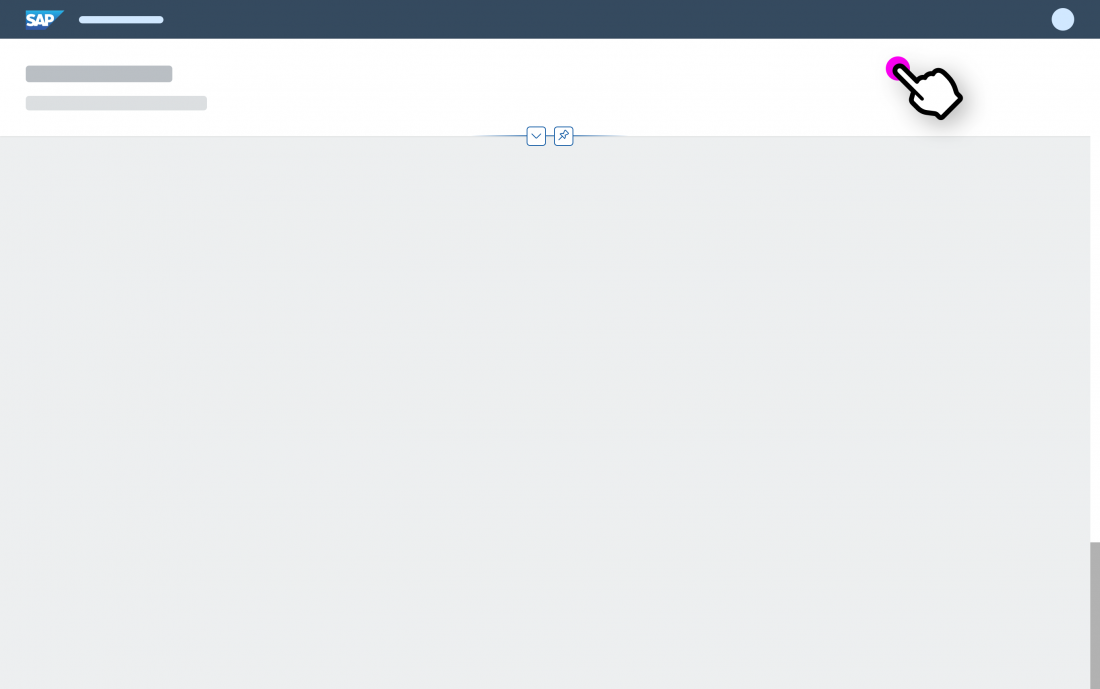
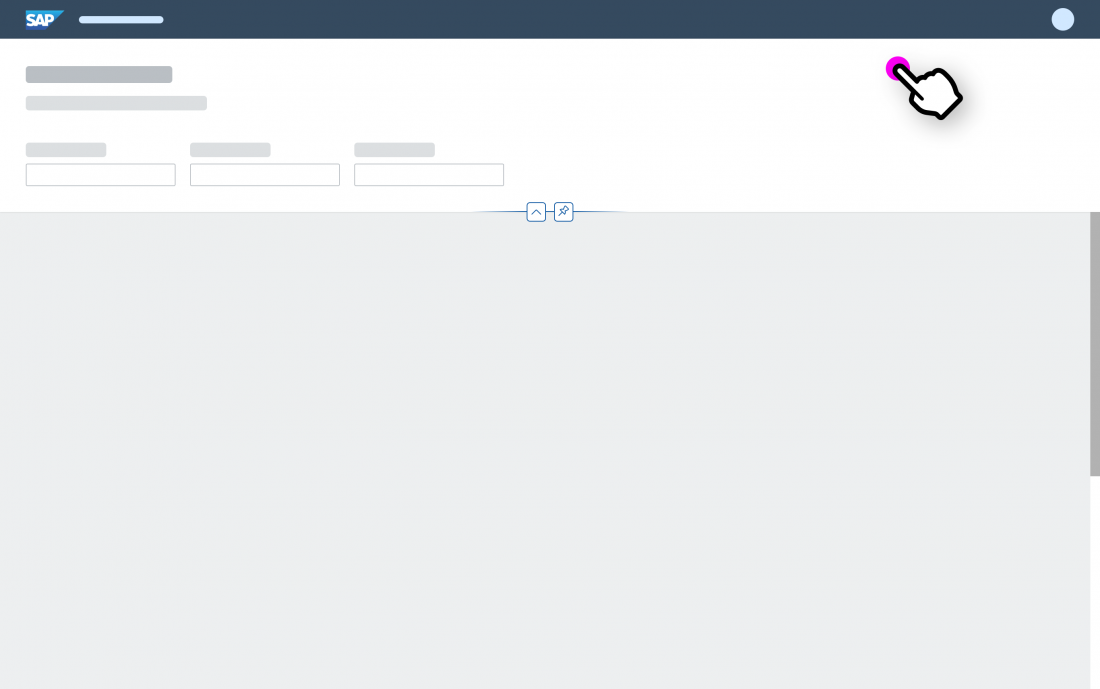
Dynamic page - Snap on scroll
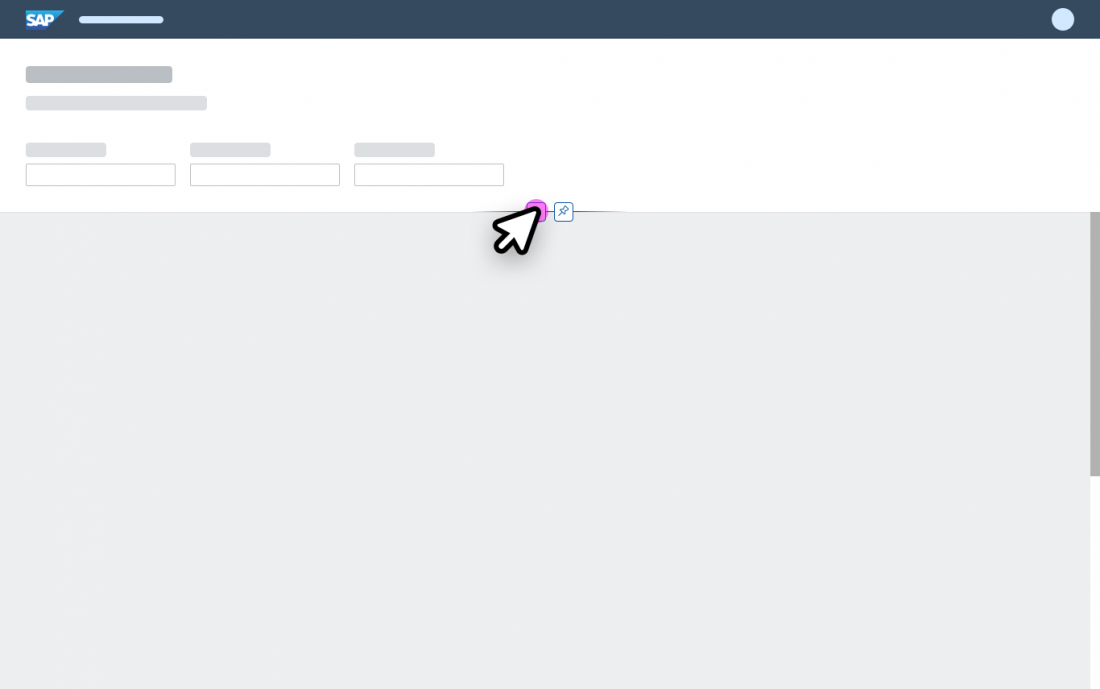
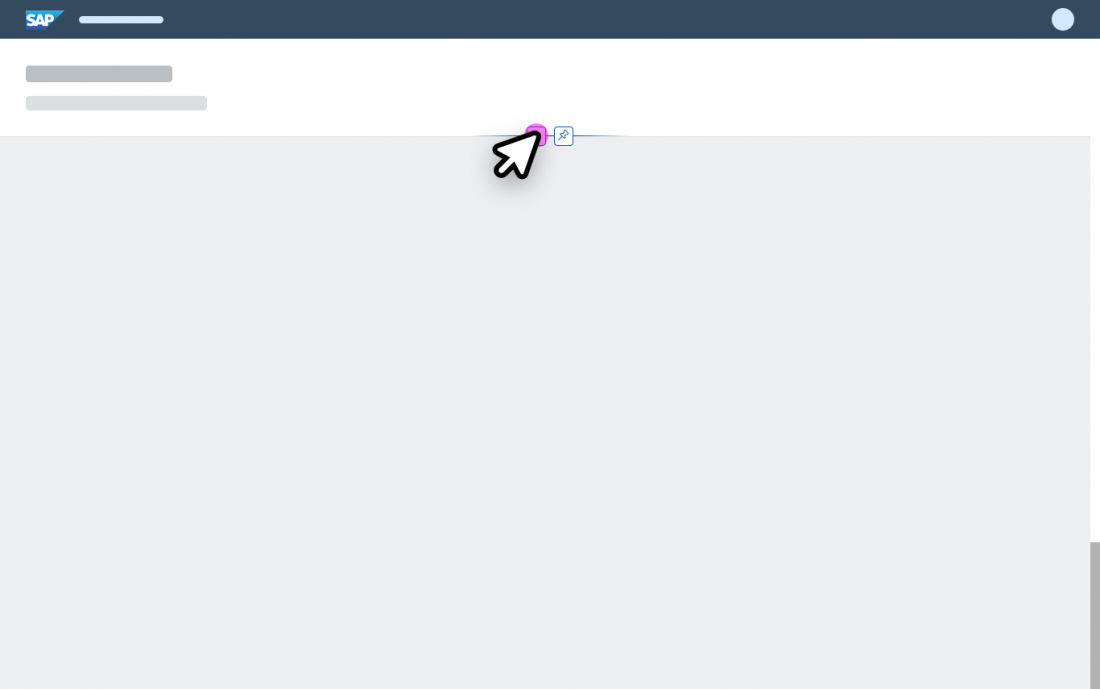
Dynamic page - Snap on click
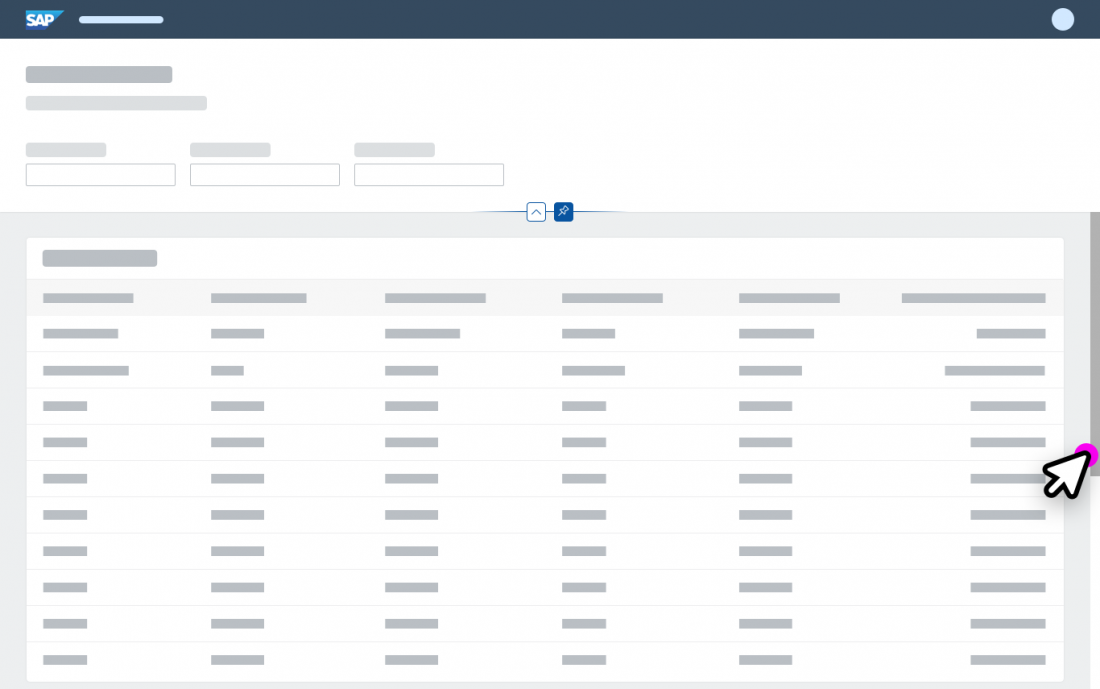
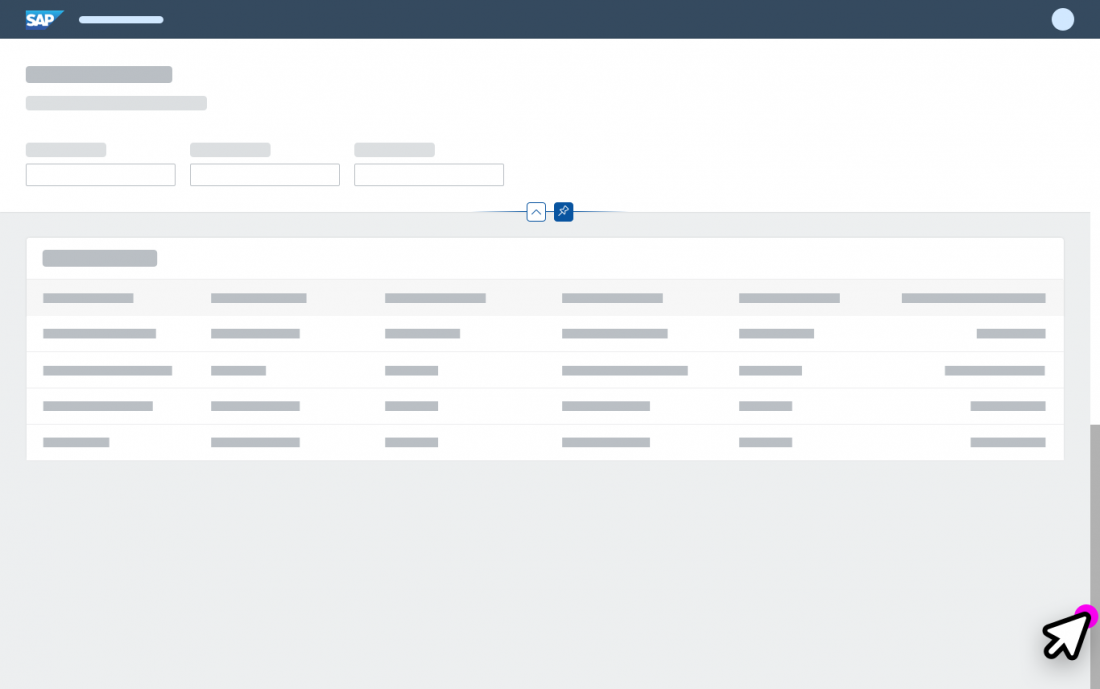
Dynamic page - Pin/unpin

Starting in Expanded or Collapsed Mode

By default, the header content is initially expanded. In certain cases, it can also make sense to deviate from the default and allow the header to appear in collapsed mode when initiating the app. However, the idea is to always expand the header content when the application starts without a query (and the content area is therefore empty).

Snap on Scroll

Scrolling is the typical trigger for collapsing the header content. When the user scrolls down the page, the header content scrolls away. The header title switches to collapsed mode and stays fixed. When the user scrolls up the page, the header content expands again.

Note that this interaction pattern works only in combination with an expandable/collapsible header content. It can be combined with snap on click, but does not have to be.

Snap on Click

The snap on click pattern is another way of expanding and collapsing the header content. The user can collapse the header without scrolling, and expand it again even when it has been collapsed by scrolling down. Two interaction variants are offered, which always appear in combination: clicking the header title and clicking the Expand Header / Collapse Header icon button in the header features area.

Again, the interaction pattern works only in combination with expandable/collapsible header content. It can be combined with snap on scroll, but does not have to be.

Clicking the Header Title

The user can expand and collapse the header content by clicking anywhere on the header title bar that has no active elements (such as links or active buttons). When using a mouse, the cursor changes from an arrow to a hand to support the user’s interaction. In addition, a hover effect is visible on the header title and on the Expand Header / Collapse Header icon button in the header area. If the header is expanded and the user clicks the title bar, the header content collapses, and vice versa.

Clicking the Expand/Collapse Header Button

The expand/collapse header feature is a small icon button directly below the header, which is also used to expand or collapse the header content. When the pin is active, the expand/collapse header button is still available and overrules the pin. The icon buttons for expanding and collapsing the header are an alternative to clicking on the header title bar, which might not have much clickable space. They also support keyboard actions.

Pinning the Header Content

Activating the pin feature keeps the header expanded while the user scrolls through the page content. This mode remains fixed until the user clicks the pin icon again or triggers snap on click. This feature is optional and can be switched off if it is not useful for your application.

The expand/collapse header button remains visible when the pin is activated. Clicking the Collapse Header  icon overrules the pin, collapses the header, and switches the pin button off. Do not offer the pin feature for floorplans without scrollbars (see special case below), or if there is no header content.

In the smartphone version, the pin action is not provided, as the pinned header would take up too much screen real estate. The same applies whenever the dynamic page header would occupy more than 60% of the screen, regardless of the device type. Overruling the pin feature keeps the focus on the content.

Note that this interaction works only in combination with expandable/collapsible header content. The pin button is available as soon as snap on scroll (or snap on click) is activated.

Special Case: No Page Scrolling Possible

The following special case applies for pages containing desktop-centric tables, such as the analytical tablegrid table, or tree table.

Because these tables use up all of the available screen space, there should not be a vertical scroll function, and hence no snap on scroll. In this special case, an explicit interaction via the expand/collapse header button is required to expand or collapse the content area. The pin feature is obsolete and is not provided.

This exceptional case also applies to chart containers that use up all the available screen space in a similar way to desktop-centric tables.

Keyboard Interaction

The dynamic page header expands automatically as soon as keyboard actions like tabbing or group jumps (F6) bring the content of the dynamic page header into focus.

The dynamic page header collapses as soon as the keyboard focus leaves the dynamic page header content area.

Key(s) Behavior
Tab Move the focus to the dynamic page header / header title bar. The dynamic page header expands automatically. If the focus is inside the header content area, move the focus to the next UI element within the header.

If the focus is on the last UI element within the header content area (expand/collapse header feature), leave the header. Collapse the header content.

Shift+Tab See Tab, in reverse order.
F6 If the focus is before the header title bar, set the focus to the header title bar. Expand the header content. If the focus is within the header content, move the focus out of the header and collapse the header content.
Shift+F6 See F6, in reverse order.

Responsiveness

The dynamic page offers considerable freedom and flexibility. In addition, the dynamic page header and the footer toolbar are designed to adapt automatically to small, medium, and large screen sizes.

The title (sap.m.Title) and subtitle (sap.m.Text) on the left truncate in collapsed mode to save vertical space, and wrap in expanded mode to offer the full text. This behavior needs to come from the respective controls for the title and subtitle. Overall, we recommend showing a maximum of 2 lines of text in collapsed mode. This prevents a disproportionate header height, especially on mobile devices if no summary line is used. The 2 lines can either be a combined title and subtitle, or a longer wrapping title. For more information, see wrapping and truncating text.

Key information, such as a KPI (middle area, left aligned), stays as long as possible before it moves into the overflow.

Global actions stay as long as possible. If there is no key information, the title and the global actions automatically get more space. The toolbar follows the standard toolbar overflow guidelines, and adds the available buttons to the overflow menu from right to left.

Layout actions: The dynamic page offers a specific area for layout actions, which reacts to the predefined breakpoint of 1280 px:

  • Less than 1280 px: Navigation actions are placed in a separate row above the global actions.
  • 1280 px or more: Navigation actions are placed to the right of the global actions on the same line.

This breakpoint corresponds to the page width and not to the window width. Therefore it doesn’t matter whether the page is used in the flexible column layout, on a desktop device, or on a mobile device.

Letterboxing limits the width of the content area to 1280 px. This prevents the app content from becoming too “stretched” on wide screens, and optimizes readability. Letterboxing can be used together with the dynamic page if the use case requires it. However, most business apps offer so much content that the page is typically shown across the entire screen, without letterboxing.

Summary Line

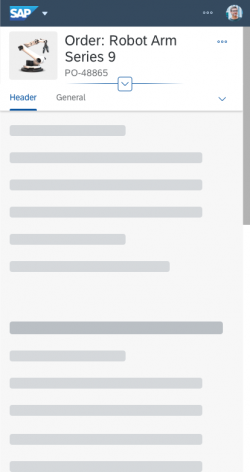
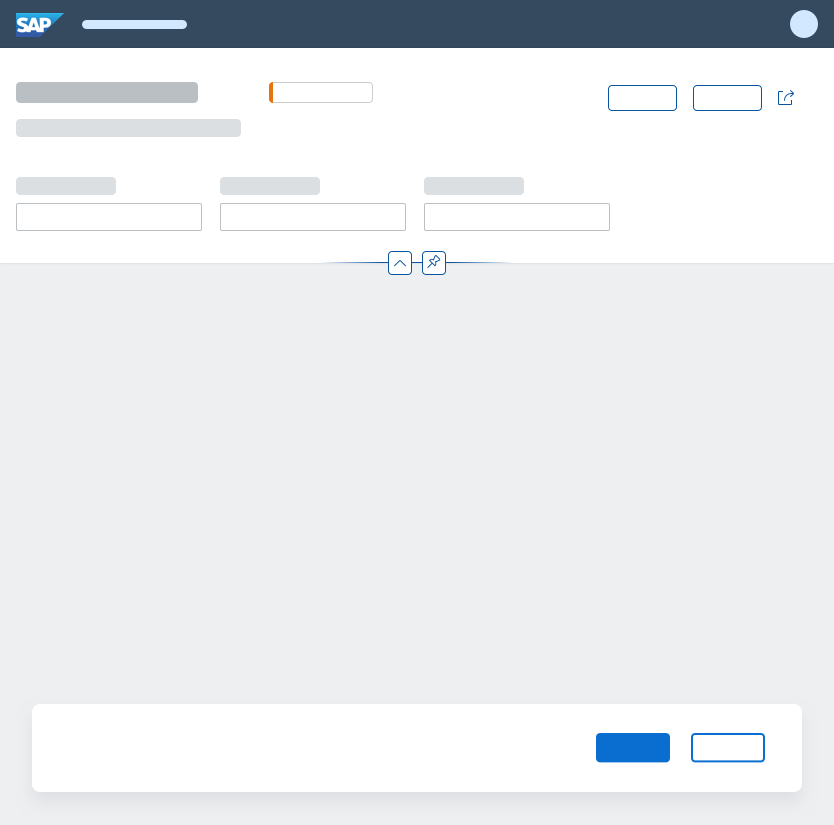
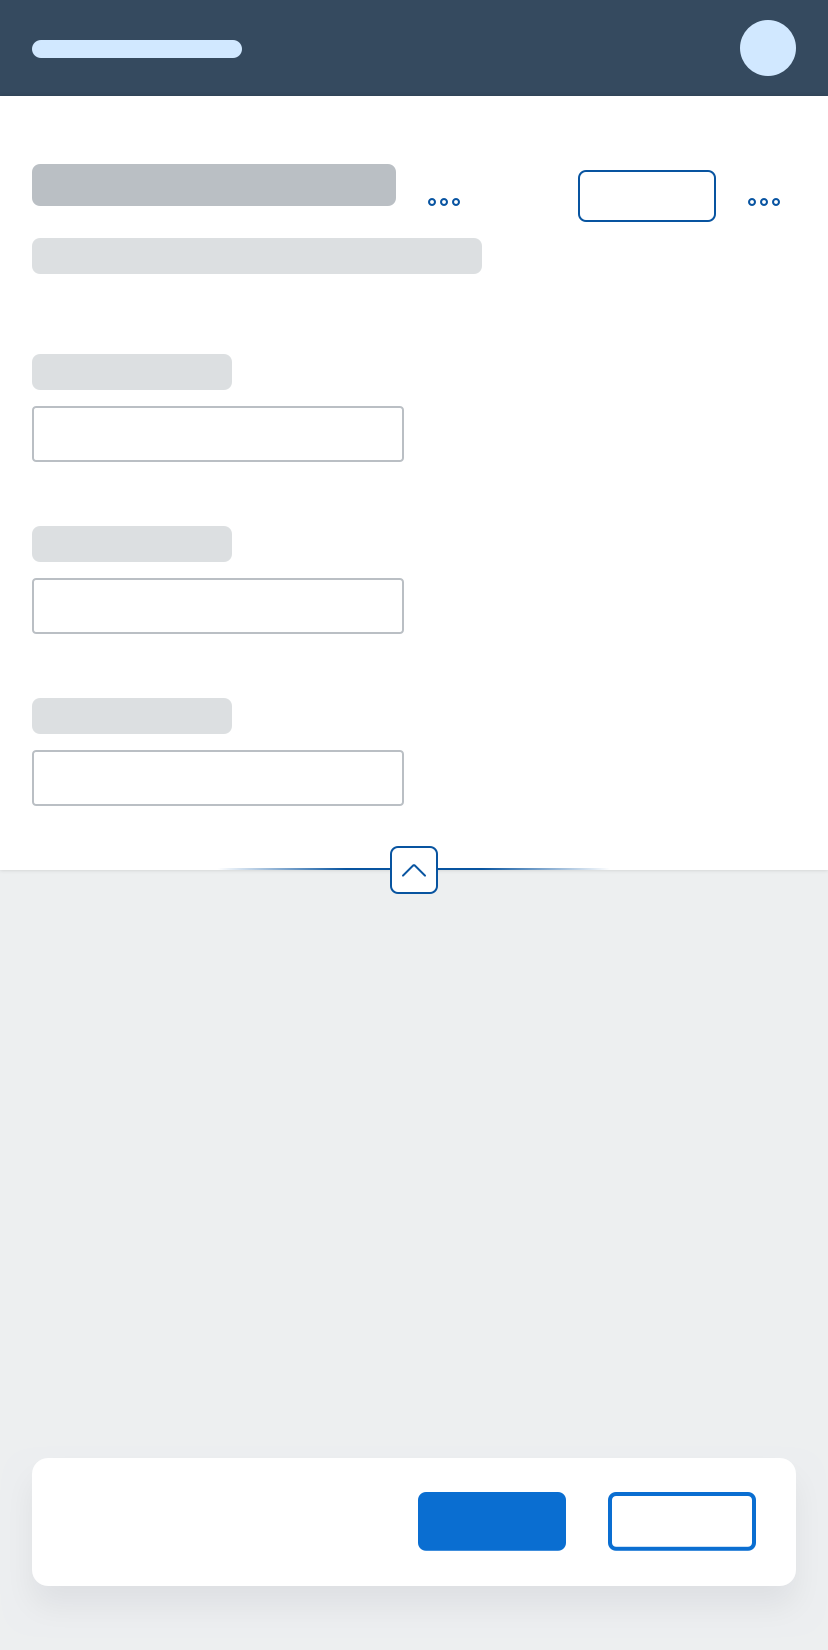
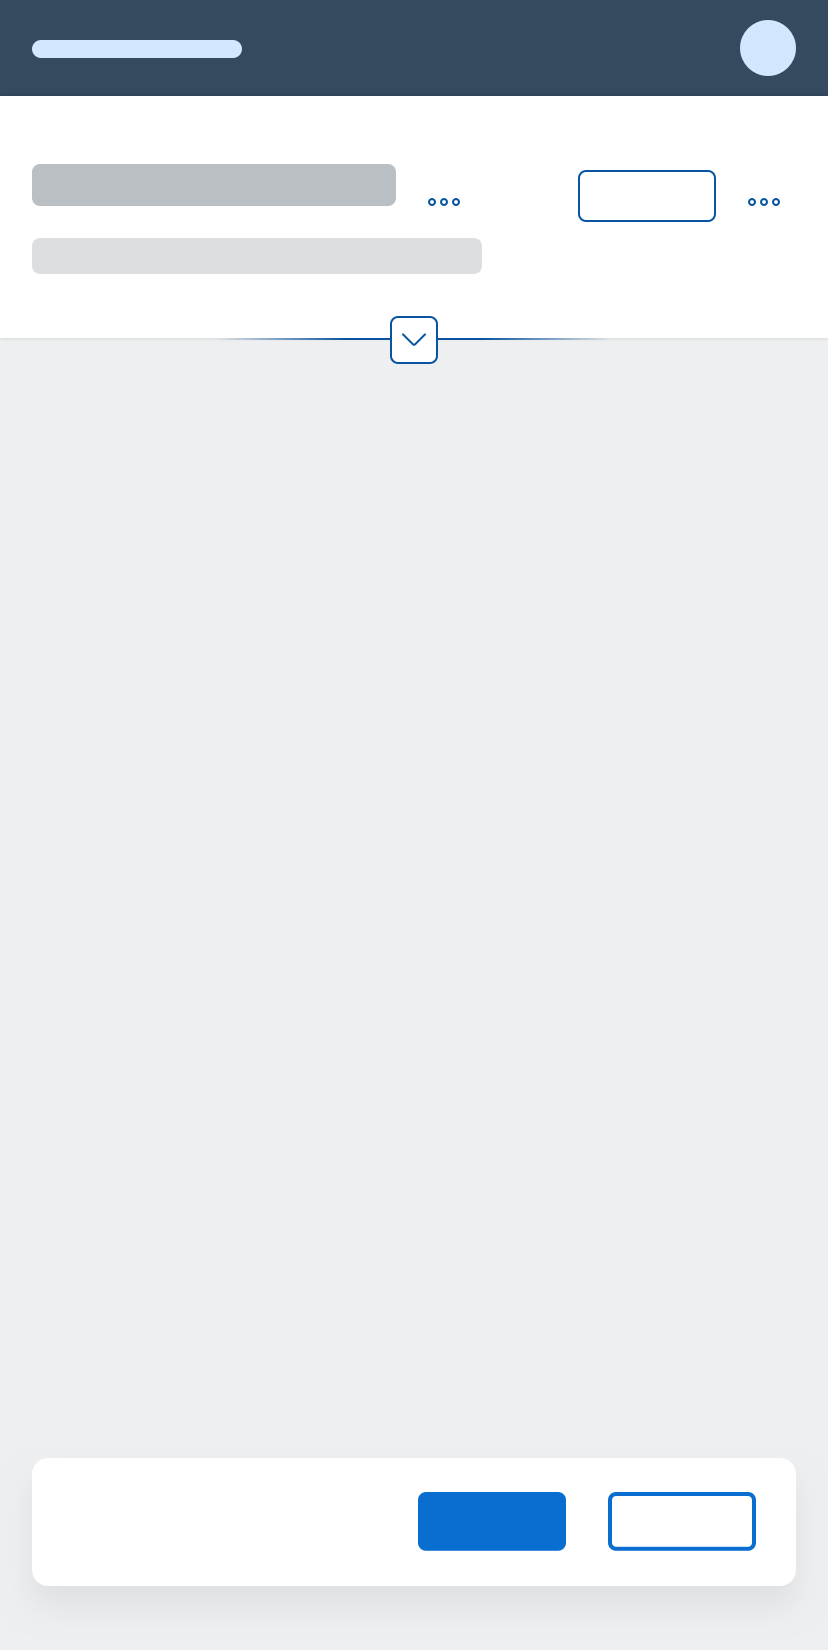
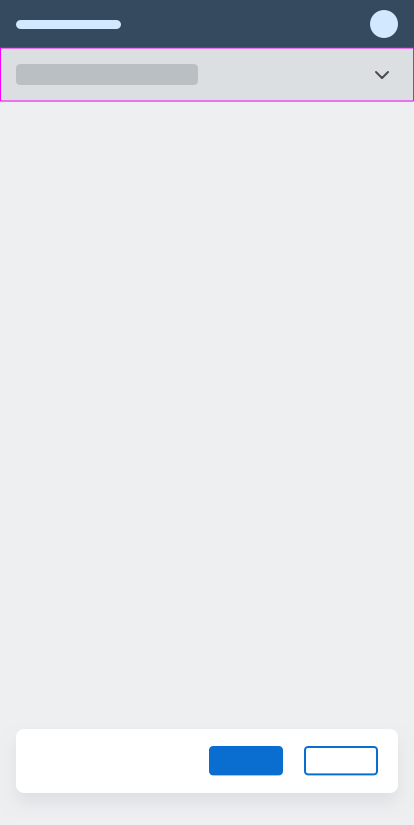
To save vertical space on smartphones, you can opt to display a smaller summary line instead of the collapsed header. The header content scrolls away as soon as the user scrolls up the page. The header converts to a summary line, which shows only the title and an arrow icon button on the very right of the screen. Tapping the summary line also expands and collapses the whole header. The rest of the page stays in the same position.

Guidelines
Use the summary line to help users to focus on the page content.

Size S with summary line

Examples

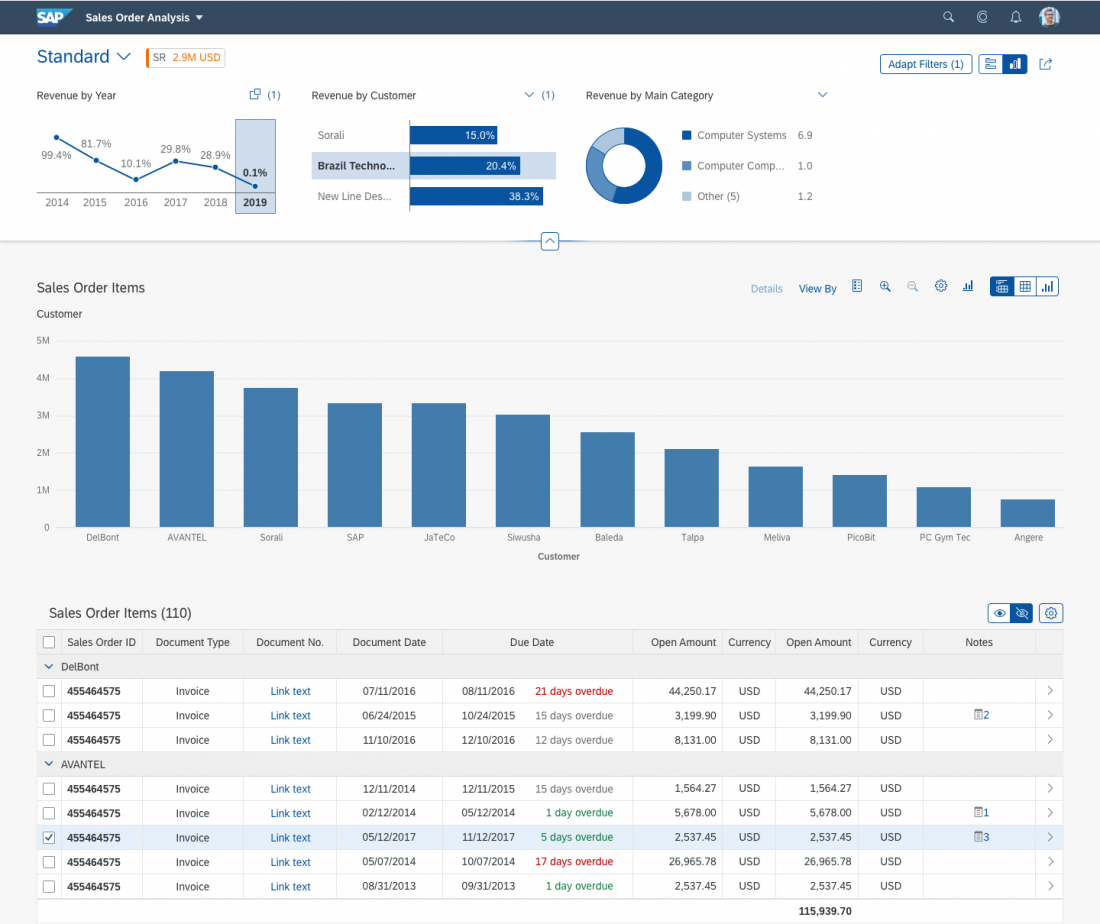
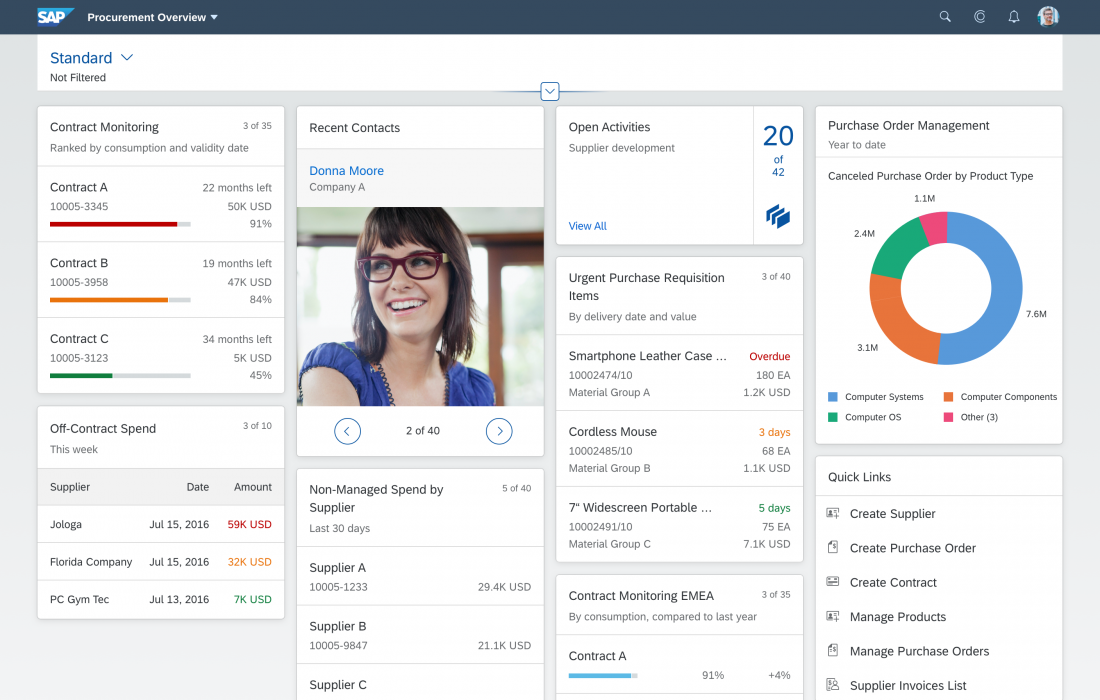
The dynamic page is a generic control. The content of both the header and the page differs from floorplan to floorplan. Here are some examples showing the most frequently-used variants for each type of floorplan. For detailed guidance, see the corresponding floorplan guidelines (analytical list pageoverview pagelist reportworklist, initial pageobject page, wizard).

Top Tips

  • Always use a header title – either as a text or link, or by including variant management. For the initial page floorplan, use an input field.
  • Use the header title and header content to provide the most relevant information and actions for your use case.
  • Only use KPI tags within the analytical list page and worklist floorplans.
  • Do not remove or disable the actions within the global action toolbar when the header content is collapsed.
  • Make sure that the layout actions in the flexible column layout are displayed correctly and never get hidden in the overflow.
  • Start your application in expanded mode if users need further content or adjustment options to get started.
  • Offer the pin feature whenever users may need to fix the header content while scrolling through the page content.
  • Activate the summary line on smartphones to help users focus on the page content.

Related Links

Elements and Controls

Implementation

Analytical List Page Floorplan

Information
This floorplan is implemented as an SAP Fiori Element.

Intro

Analytical list page

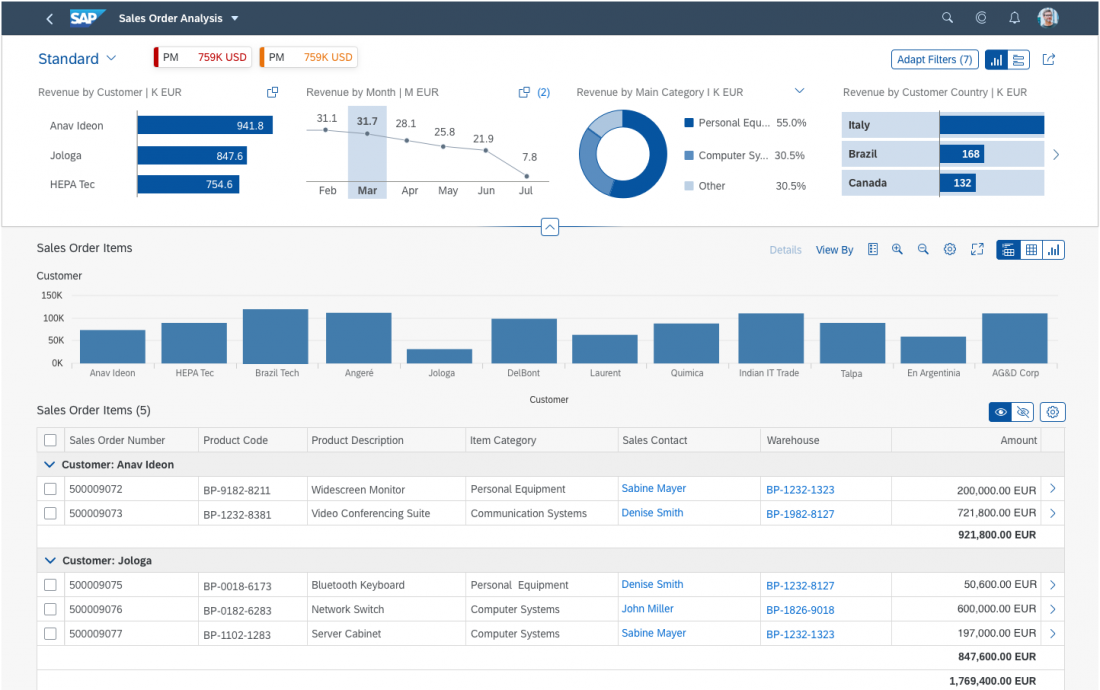
The analytical list page (ALP) offers a unique way to analyze data step by step from different perspectives, to investigate a root cause through drilldown, and to act on transactional content. All this can be done seamlessly within one page. The purpose of the analytical list page is to identify interesting areas within datasets or significant single instances using data visualization and business intelligence.

Visualizations help users to recognize facts and situations, and reduce the number of interaction steps needed to gain insights or to identify significant single instances. Chart visualization increases the joy of use, and enables users to spot relevant data more quickly.

The main target group are users who work on transactional content. They benefit from fully transparent business object data and direct access to business actions. In addition, they have access to analytical views and functions without having to switch between systems. These include KPIs, a visual filter where filter values are enriched by measures and visualizations, and a combined table/chart view with drill-in capabilities (hybrid view). Users can interact with the chart to dig deep into the data. The visualization enables them to identify spikes, deviations and abnormalities more quickly, and to take appropriate action right away.

Usage

Use the analytical list page if:

  • Users need to extract key information to understand the current situation or identify a root cause. The way the data is presented is crucial for giving them the insights they need to take the right action.
  • Users need a way to analyze data step by step from different perspectives, investigate a root cause through drilldown, and act on transactional content within one page.
  • In addition to the filtered dataset, users need to see the impact of their filter settings in a chart (visual filter).
  • Users need to switch between integrated chart and table views (hybrid view).
  • Users need to see the impact of their action on a global key performance indicator (KPI).
  • Users need to find and act on relevant items out of a large set of items by searching, filtering, sorting, grouping, drilling down, and slicing and dicing.

Do not use the analytical list page if:

  • Drilldown is rarely used, not used at all, or is only needed after navigating to another page, rather than as free or flexible drilldown within the page itself. In this case, a list report might be sufficient for your use case.
  • Users need different visualizations for the entire dataset (for example, as a table or chart), but don’t need to work with both visualizations on the same page (for example, in a reporting scenario). In this case, a list report might be sufficient.
  • Users need to find and act on relevant items from within a large set of items by searching, filtering, sorting, and grouping, without using drilldown or “slice and dice”. In this case, consider using a list report.
  • Users need to work with multiple views of the same content, for example on items that are “Open”, “In Process”, or “Completed”. They want to be able to switch views using tabs, segmented buttons, or a select control. In this case, consider using a list report.
  • Users need to see or edit a single item with all its details. Use the object page floorplan instead.
  • Users need to find a specific item, and the item or an identifying data point is known to the user (such as a code). In this case, use the initial page floorplan.
  • Users need to work through a comparably small set of items, one by one. In this case, use the worklist floorplan.
  • Users have a trivial use case that does require the use of a chart, but that do not involve identifying a root cause, analyzing data, or drilldown. Instead, use a list report with a table/chart switch.

Structure

This section describes the basic layout of the analytical list page, as well as the different layout variants.

Basic Layout

The shell bar is above the analytical list page. The page itself uses the dynamic page layout and has two main areas:

  1. Analytical list page header:
    The page header is the filter area. Users can expand and collapse the header using the expand/collapse header icon.
  2. Analytical list page content area:
    The content area shows the content for the chosen filters.

All elements are described in more detail in the Components section below.

Analytical list page - Basic layout

Layout Variants

The layout of the analytical list page is quite flexible. The display is determined by the header and content views chosen by the user.

The analytical list page always offers all of the above layout options. You cannot restrict the available views at app level. For example, you can’t offer only a visual filter (with no option to show the standard filter bar). Likewise, you can’t show only a table view (with no option to display the hybrid or chart views).

Information
SAP Fiori elements for OData V4 uses the filter bar and SAP Fiori elements for OData V2 uses the smart filter bar.

Responsiveness

The analytical list page is responsive, except for the global KPIs. Apps with one or more global KPIs are not supported on screen sizes smaller than size L (desktop).

Likewise, the analytical list page is only fully supported in the flexible column layout if no global KPIs are used. If you use the analytical list page with global KPIs within the flexible column layout, the column should have at least size M.

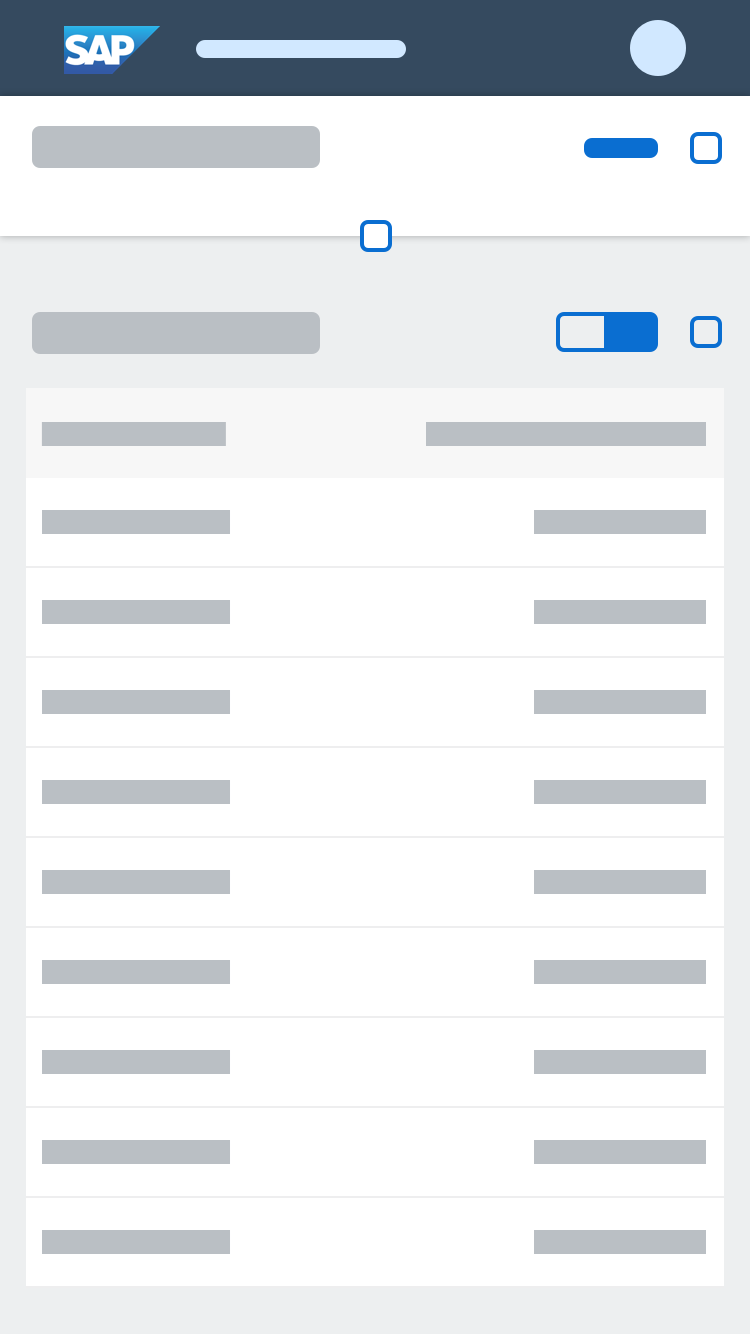
Size S

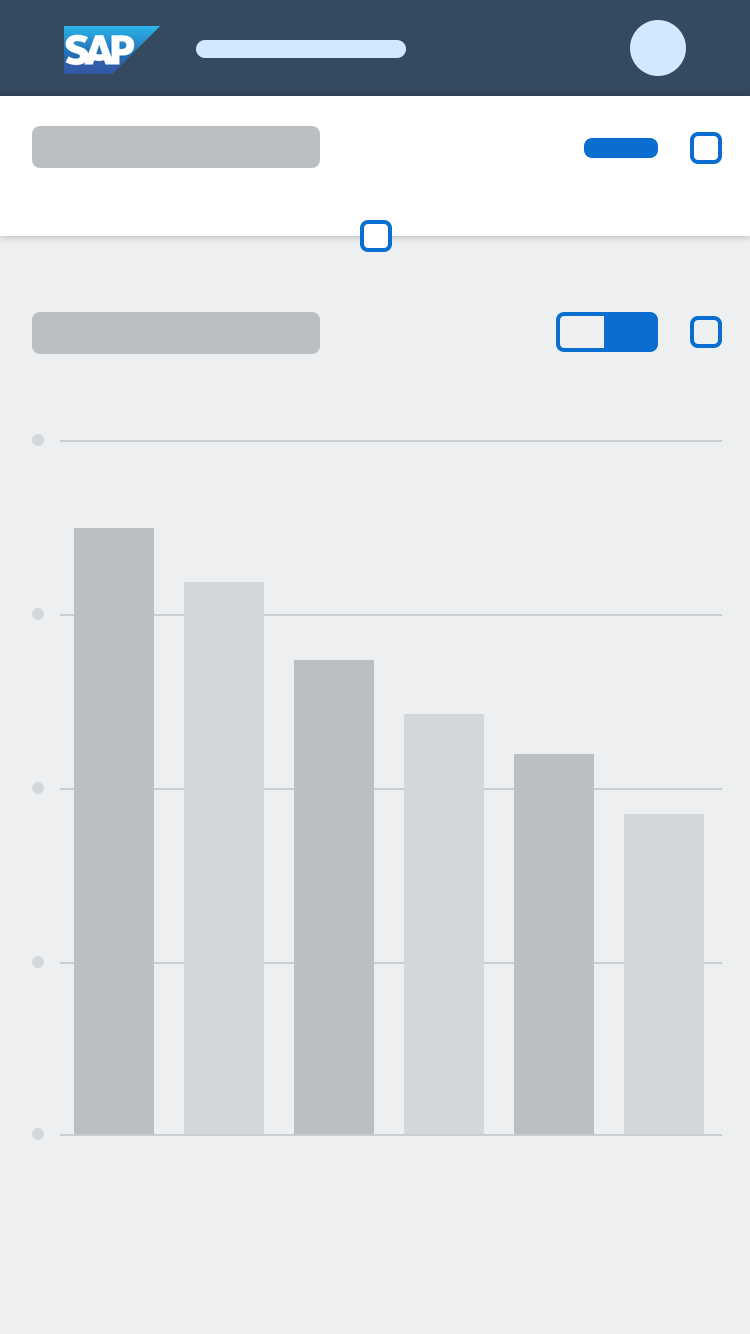
On size S, the analytical list page supports both the chart-only and table-only views. The table-only view supports only the responsive table. If no responsive table is available, the chart-only view is displayed without a view switch toggle.

Global KPIs are not supported on size S.

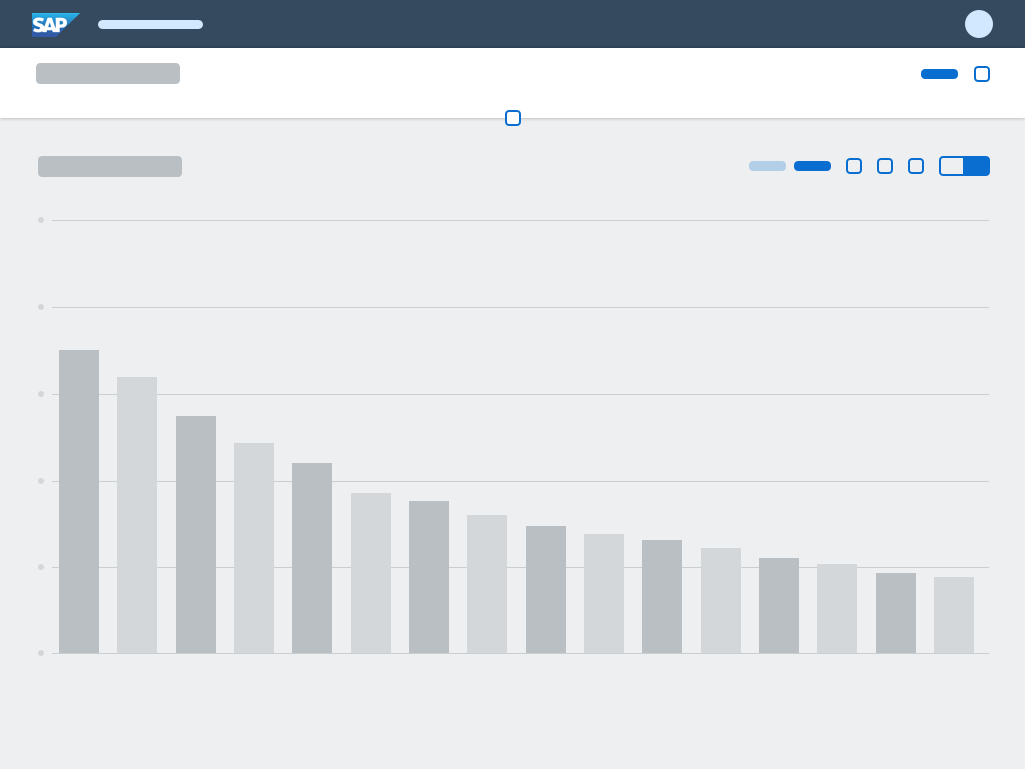
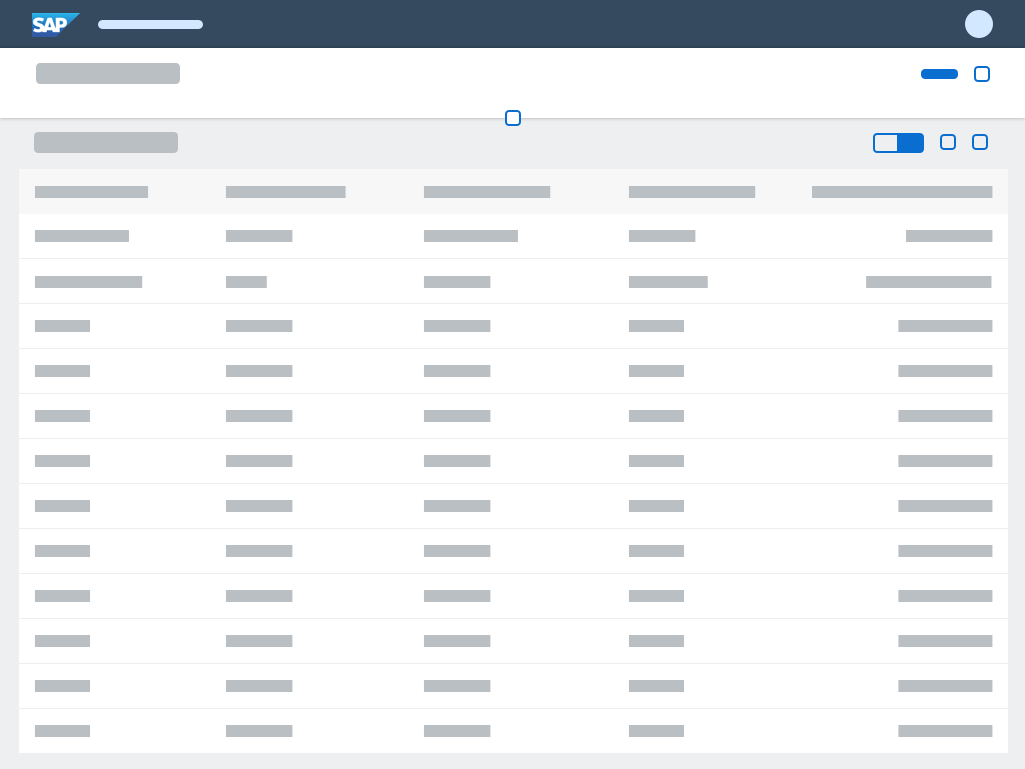
Size M

On size M, the analytical list page supports both the chart-only and table-only views. You can use a responsive table or analytical table in the table-only view.

Chart-only view - Size S
Table-only view - Size S
Chart-only view - Size M
Table-only view - Size M

Components

Analytical List Page Header

The page header can be expanded and collapsed on click. Different content is shown in the expanded and collapsed states. For more information about the basic behavior of the header, see Dynamic Page Header.

Collapsed Header

The collapsed page header contains the following elements:

Collapsed analytical list page header

Expanded Header

Initially when the app is launched the header is expanded by default. The expanded page header contains the following elements:

Expanded analytical list page header showing the visual filter bar
Expanded analytical page header showing compact filters in the filter bar

Analytical List Page Content Area

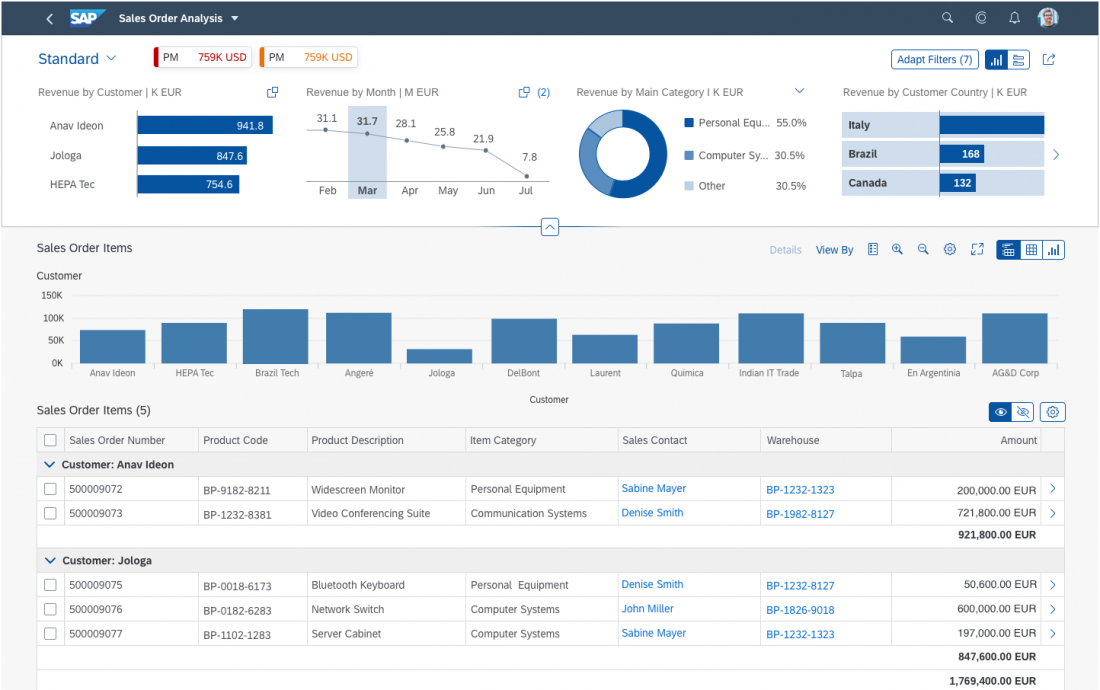
The analytical list page content area contains the following elements:

  • View switch (   |    |    )
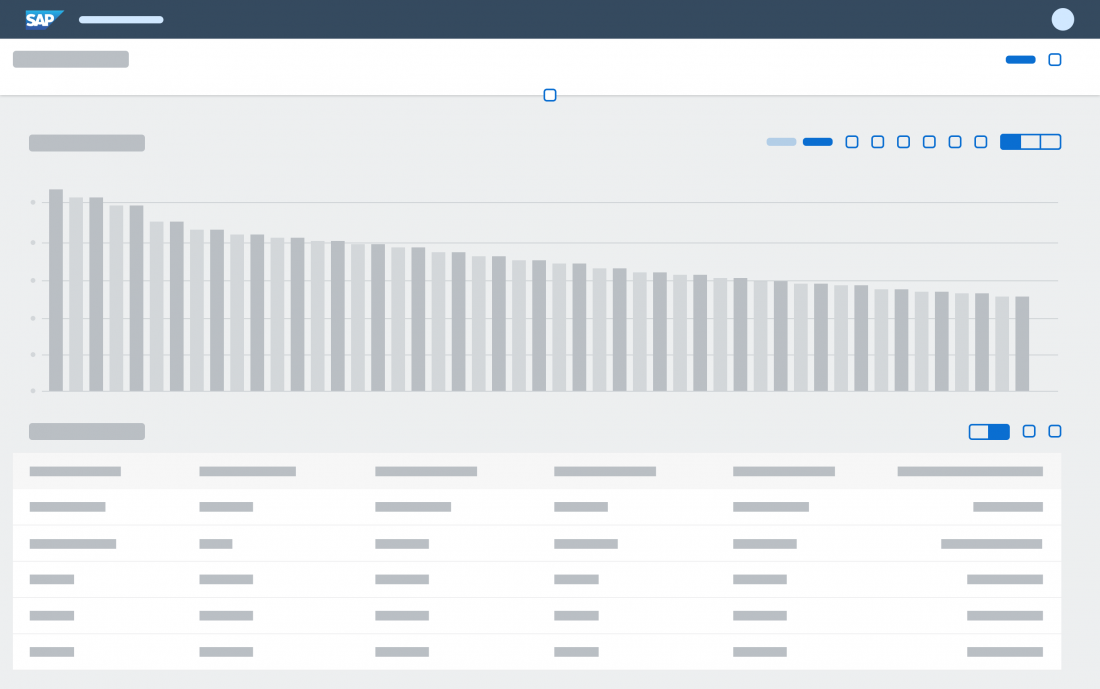
  • Hybrid view: View with one chart, chart toolbar, one table, and a table toolbar
Hybrid view
Hybrid view
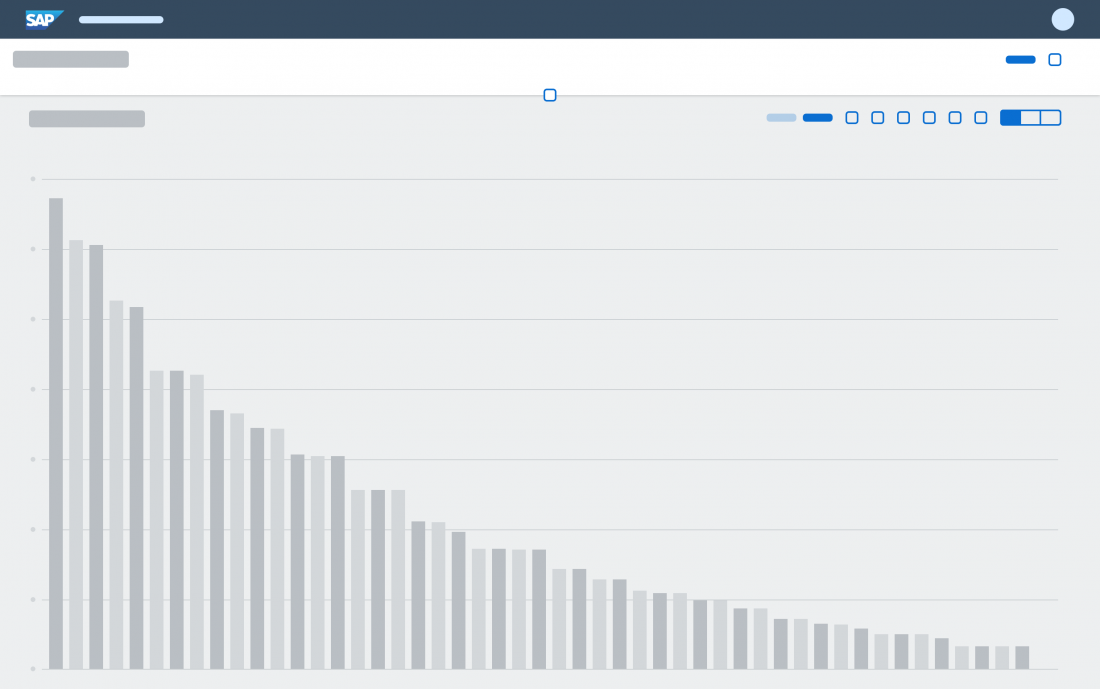
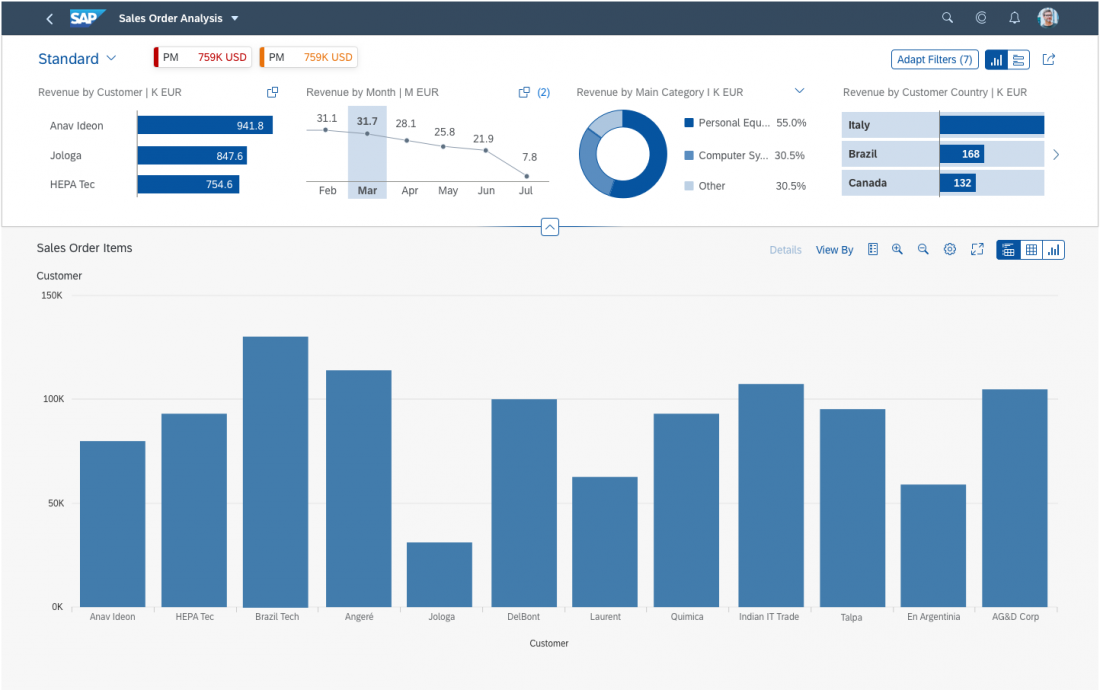
Chart-only view
Chart-only view
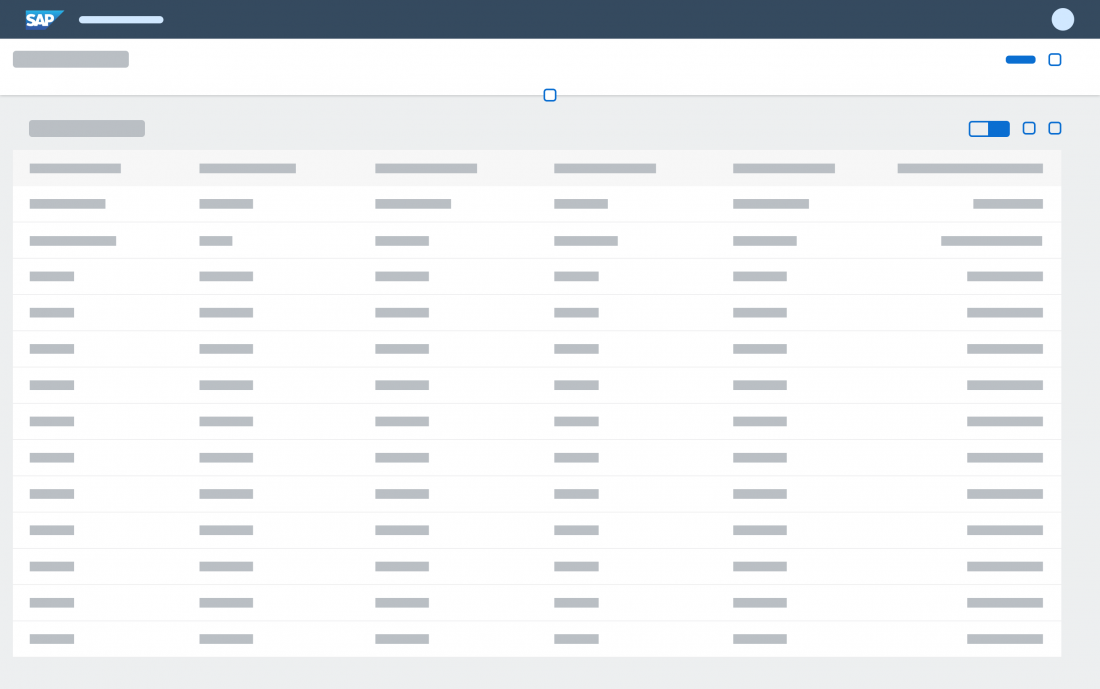
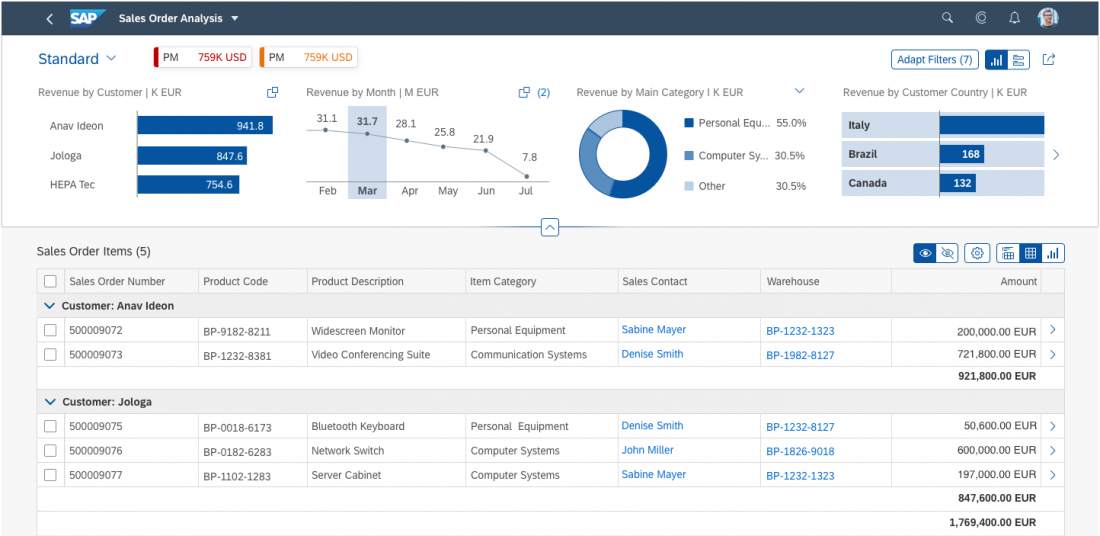
Table-only view
Table-only view

Analytical List Page Header

Variant Management

Variant management in the analytical list page allows users to save a page variant whenever there are changes in the underlying structures of the filter/content area. Variant management for the page is handled by the standard SAPUI5 page variant management.

Currently, the page variant captures the following states across the page:

  • Filter view switch state: Visual filter bar or filter bar
  • Filter set: The filters set in the visual filter bar and filter bar
  • Filter selections: Selected values in the visual filter bar and filter bar
  • Content view switch state: hybrid view  , chart-only view  , or table-only view  
  • Chart and table configurations, such as measures and dimensions used, sort order, or grouping
  • Chart drill-down state, based on the current selections (slice & dice)
  • Table entry switch state: Hide (  ) or Show  (  ) selected table records

Global KPI Tags and Cards

Use a global KPI tag (= global key performance indicator tag) if you would like to show a global KPI related to the task in hand. The global KPI value changes only if an action is executed on the transactional content. For example, the user needs to know the effect of releasing sales orders on a related global KPI, or the effect of posting an accounting document on certain financial global KPIs.

You can display a maximum of three global KPIs. Clicking a global KPI tag opens a global KPI card that displays more details on the KPI.

The global KPI tags and corresponding KPI cards are independent of the filter area. This means that global KPI tags do not react to filters set in the visual filter bar and filter bar.

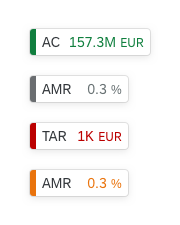
A global KPI tag has four components:

  • Global KPI label
  • Global KPI value
  • Global KPI color and criticality indicator
4 KPI tags including KPI labels, KPI values, KPI color, and criticality indicator

Global KPI Label

The global KPI label is an abbreviation of the complete global KPI title. It is formed using the first three letters of the first three words of the global KPI title.
Examples: AMR for Actual Monthly Revenue, TAR for Total Advertising Revenue, or LPC for Landing Page Conversation Rates

If there is only one word in the global KPI title, the first three letters of the word are displayed. Example: CON for Contracts

If the global KPI title has only two words, only the first letters of these two words are displayed. Examples: AC for Actual Costs, SG for Sales Growth

KPI label abbreviation: AC

Global KPI Value

The global KPI value is displayed using a semantic color and a scaling factor. Relative values are shown with a percentage sign and one decimal place.
Examples: 0.3%, 82.9%
Absolute values are shown without decimal places, a currency, or a unit of measure.
Examples: 2K, 75K, 30M, 14B

KPI values: 157.3M and 0.3%

Global KPI Color and Criticality Indicator

The color of the global KPI value is based on the thresholds defined for the particular KPI in the annotation. The global KPI tag also uses a line to indicate the criticality. The color of the line is the same as that of the global KPI value.

KPI color and criticality indicator

Global KPI Card

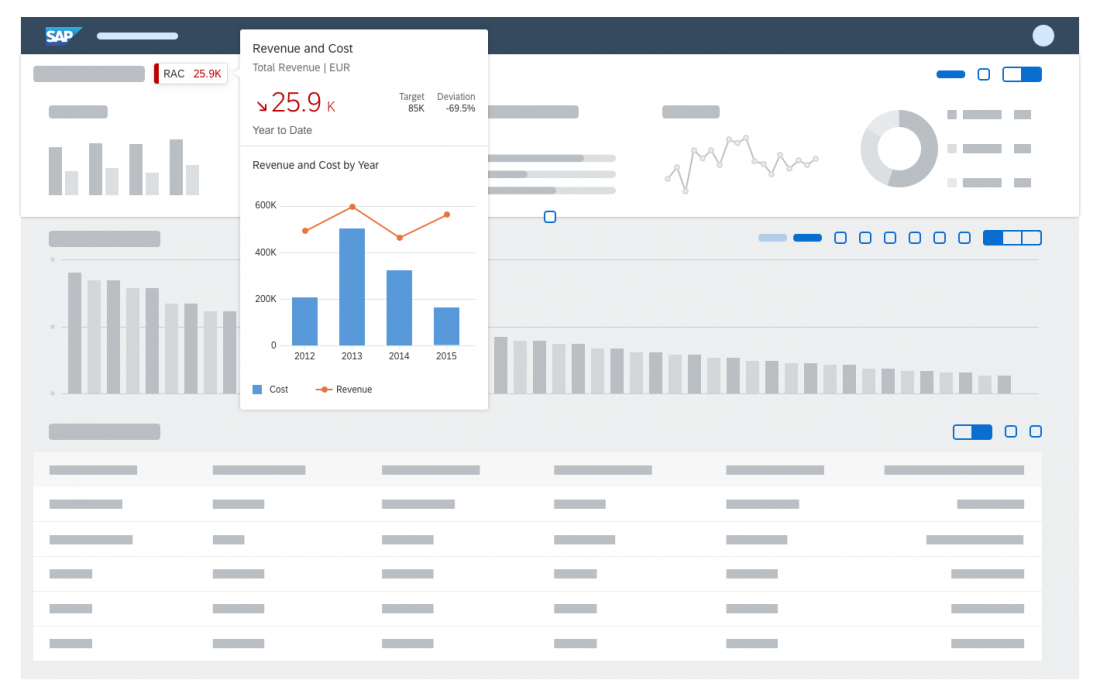
Clicking the KPI tag opens the analytical card, which displays more information about the current value of the global KPI, the global KPI target, the deviation from the target, and how the global KPI has evolved over time.

Global KPI card
Global KPI card

Filter Area: Visual Filter Bar and Filter Bar

The filter area allows users to filter the result set, which feeds the main content area. The analytical list page comes with two filter types: compact filters in the filter bar, and the visual filter bar. Always design both visual filters and compact filters (filter bar) for your app. We recommend setting the visual filter bar as the default, but this is no longer mandatory. You can opt to use the (compact) filter bar as the default if your app has the required parameter values, if your main use case involves date ranges, or if your users often need to combine multiple filters in different ways.

Currently, any visual filter configured in the visual filter bar must always be displayed as a compact filter in the filter bar as well. By contrast, a filter configured as a compact filter in the filter bar may or may not be configured for display as a visual filter. This means that it’s possible to have a smaller set of visual filters and a larger set of compact filters.

Both filter types supports two different modes: live update and manual update. Use the live update mode for both filter types as the default whenever possible. Apply the same mode to both filter types: the visual filter bar and the filter bar. For example, if you use the live update mode in the visual filter bar, you should also use the live update mode for the filter bar.

Information
SAP Fiori elements for OData V4 uses the filter bar and SAP Fiori elements for OData V2 uses the smart filter bar.
Visual filter bar
Visual filter bar
Filter bar
Filter bar

Filter Type Switch

Users can toggle between the compact filters    (filter bar) and    (visual filter bar) in the upper-right area of the page header. The filter type switch is a core feature of the analytical list page and is mandatory. The switch is only displayed when the page header is expanded. Once the header collapses, it disappears.

Filter type switch
Filter type switch

Carrying Forward Filter Selections

Visual Filter to Compact Filter

Any values selected in the visual filters are always carried forward to the corresponding compact filters.

Compact Filter to Visual Filter

Filter dimensions that are part of a visual filter are synced to the visual filter. If the dimension value(s) chosen in the compact filter are part of a visual filter, they are shown as selected chart dimensions in the visual filter (single or multiple selections).

Filter dimensions that are not part of the visual filter, parameter values, and interval-based dimensions are applied to the filter query and the content is refreshed.

To show complex conditions, click the link for the number of selected items at the top of the visual filter.

Visual Filter Bar

The visual filter bar combines measures or item counts with filter values. The visual filter bar becomes more powerful if you match measures to the filter dimension instead of just item counts. Use the visual filter bar if you would like to give the user a condensed overview of the data in the dataset. Chart visualization increases the joy of use, and enables users to spot relevant data more quickly.

Chart Types in the Visual Filter Bar

Currently, the visual filter bar supports three interactive chart types:

These interactive charts are also referred to as visual filters.

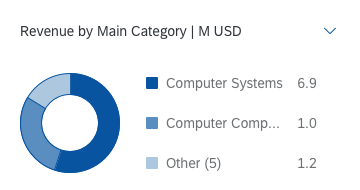
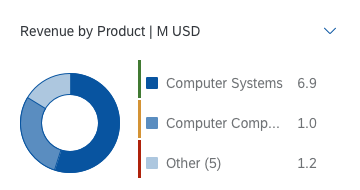
Interactive Donut Chart

The interactive donut chart in the visual filter bar is used for non-time-related data (for example, categories) and displays only the top or bottom two values. The rest are aggregated into the “Other” section.

Interactive donut chart
Interactive donut chart with semantic colors

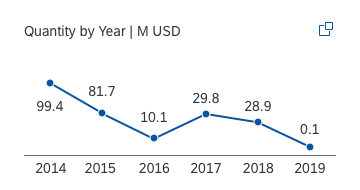
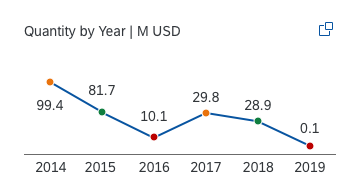
Interactive Line Chart

The interactive line chart is used exclusively for displaying time series data, and can show a maximum of six data points. Always show the first or last six data points (for example, last six days, last six months, first six days, and so on).

Interactive line chart
Interactive line chart with semantic colors

Interactive Bar Chart

The interactive bar chart can be used for non-time-related data (for example, categories) and has a maximum of three filter values. These filter values show the top three or bottom three entries.

Interactive bar chart
Interactive bar chart with semantic colors

Using Interactive Charts

The interactive charts come with the following features and rules:

  • Minimum number of interactive charts: Show at least three visual filters and try to use different chart types.
  • Filter title:
    • Use the following naming convention for the filter title, using title case:
      [Measure Name] by [Dimension Name] | [Scale Factor] [Unit of Measure].
      Examples:
      Project Costs by Project | K EUR
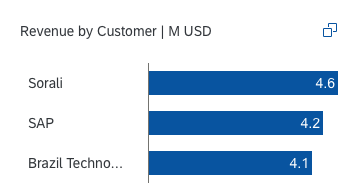
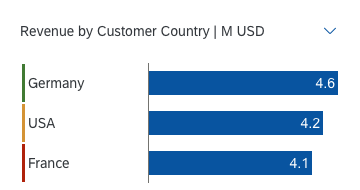
      Sales Volume by Commodity | M PC
    • For an item count, use the following naming convention for the filter title, using title case:
      Number of [Dimension] | [Scale Factor] [Unit of Measure].
      Examples:
      Number of Products | PC
      Number of Contracts by Month
    • Note that for some use cases, it might be appropriate to replace “Number” with a different expression. Bear in mind that the space for displaying the filter title is limited. If the measure and/or dimension names are longer than the predefined space, the text will be truncated.
Filter title with truncation
Filter title without truncation
  • Filter-to-filter dependencies: Ideally, the filters depend on each other. By selecting one or several chart data points, users can perform a quick analysis of the dataset.
    Examples: Supplier with the lowest supplier performance this year, product with the highest sales volume in March in the EMEA region
  • Adding additional filter values: All charts have a maximum number of filter values that can be displayed within the chart itself. More filter values can be selected using the value help or the select popover.
  • Selected values: Any data point or segment that is selected in the visual filter’s interactive charts will remain selected even when the user changes the measure, chart type, or sort order in any of the charts. If a selected record falls outside the top/bottom three records being displayed, the number of selected records is shown in parentheses at the top right of the chart.
  • Semantic colouring: All interactive charts support semantic colors to indicate the criticality of filter values.
  • How to design a visual filter: To design a visual filter, choose a meaningful measure out of the dataset and match it to a filter dimension. If no measures or no meaningful measures are available, use an item count instead. Have a look at the visual filter bar article for more information.

Filter Dialog

In the filter dialog, the user can switch between the visual filter bar and the compact filters using a toggle button, and also manage the filters. For more about the standard filter dialog, see Filter Bar. Visual filters are explained in more detail below.

Filter Dialog for Visual Filters

The filter dialog is launched by clicking the Adapt Filters ([number of applied filters]) link in the page header area. In the filter dialog for visual filters, the user can choose which filter fields are shown in the visual filter bar, and make the following changes:

  • Add visual filters
  • Delete visual filters
  • Hide visual filters in the visual filter bar
  • Search for visual filters
  • Change the sort order  of each visual filter
  • Change the chart type   of each visual filter
  • Switch to other measures  in the visual filter display

Analytical List Page Content Area

The content area shows different visualizations of the selected data. In the hybrid view, users can interact with both the chart and table visualizations at the same time. In addition, the analytical list page supports a chart-only view and a table-only view. The analytical list page always comes with all three views. Offering additional views or even tabs would add too much complexity, and is neither supported nor recommended.

Check out the following sections for more details on the hybrid view, chart-only view, and table-only view.

Hybrid View

The hybrid view uses both chart and table visualizations at the same time. It enables users to analyze data step by step from different perspectives. Users can interact with both the chart and the table, and drill down through either the smart chart or table entries to investigate a root cause. They can also act directly on transactional content. In the initial view of the chart, visualize the most important aspects of the whole dataset in the chart.

Example: The view shows all the suppliers the user is responsible for, organized by value. By drilling down the material to the plant with the highest/lowest volume, the user can see if materials need to be shifted from one plant to another. The corresponding transactional data is shown in an analytical table below the chart, which might also offer an action for shifting the material.

Analytical list page - Hybrid view

Chart-Only View

The chart-only view enables users to analyze data step by step from different perspectives, and to investigate a root cause through drilldown, without direct access to transactional content. The smart chart control provides the chart visualization in the chart-only and hybrid views: it is used to display the dataset as a chart. The smart chart drilldown functionality provides a convenient way to analyze the dataset. In addition, the smart chart offers detailed information on the chart data and a breadcrumb that shows the drilldown path. Ensure that you show the most important aspects of the dataset in the chart.

This mode is perfect for applications with analytical data that can easily be represented visually using charts, but doesn’t need to be linked to the transactional dataset.

Analytical list page - Chart-only view

Table-Only View

The table view provides access to transactional content. The user can act on single or multiple objects, and navigate to the object details or to other applications.

Depending on the use case, you can opt to use either the analytical table or the responsive table.

Snapping or scrolling is not available for desktop-focused tables, such as the analytical table. Scrolling is only available when the responsive table is used. The pin is enabled by default. The table entries are loaded using lazy loading.

Users can apply filters at table level using the Settings button ( ). For analytical tables, filtering is also available at column level. For more information, see Analytical Table (ALV) – Filter.

Analytical list page - Table-only view

Behavior and Interaction

The expand/collapse header and pin/unpin header features work as in the dynamic page.

Initial Focus

When the analytical list page is loaded, set the initial focus as follows:

  • If the compact filter is visible by default, set the focus on the first filter field (for live update mode) or on the Go button (for manual update mode).
  • If the header contains empty mandatory fields, set the focus on the first empty mandatory field.
  • If the visual filter bar is visible by default, set the focus on the first chart container.
  • If the header is collapsed (visual or compact filter), set the focus on the first chart data point or the first table row (depending on the selected view).

Open and View the Global KPI Card via the Global KPI Tag

Clicking a KPI tag opens the KPI card, which shows the details for the particular KPI.

Select Filters in the Visual Filter

Unlike micro charts, the visual filter charts are interactive. In live search mode, selecting a filter value triggers data filtering in the content area. Both single and multiple selection are supported.

To select a filter value, the user clicks on a value in the chart. The filter can be removed by either clicking on the value help link, or by clicking on the same value in the chart again. The user can select more filter values using the value help or select popover.

Any data point that is selected in a chart still remains selected when the user selects a data point in another chart. Filter values react on each other. If a selected record falls outside the top/bottom three records being displayed, the number of selected records is shown in parentheses at the top right of the chart.

Switch Views: Hybrid, Chart-Only, and Table-Only

Users can switch between the hybrid view, chart-only view, and table-only view.

If the user selects values and then switches the view, the selection remains intact. See the table below for more details.

Switch Description
Hybrid view to table view Table selection remains intact
Hybrid view to chart view Chart selection remains intact
Chart view to hybrid view Chart selection remains intact; corresponding table selections are displayed
Table view to hybrid view Table selection remains intact

Show/Hide Table Entries in Hybrid View and Table View

The table toolbar for the analytical list page offers a Show   and Hide    table entries feature as a toggle switch in the hybrid and table views:

  • If the Show icon is active, the table shows all items. These include highlighted entries (where values are selected in the chart) and non-highlighted entries.
  • If the Hide icon is active, the table shows only items that are selected in the chart.

For example, if the user selects SAP’s Sales Revenue for 2012 as Customer in the chart, all records relating to SAP’s Sales Revenue for 2012 are highlighted (but not selected) in the table. Note that the record is still highlighted even if Customer not displayed as a column in the table. If the table rows are grouped, the entire grouping is highlighted, even if only one record within the grouped set is affected by the chart selection. All values that are not selected in the chart are “hidden” and are not shown in this table mode.

Guidelines

Show the filter dimension with one measure in the visual filter, not multiple measures

Filter dimensions in the compact filters (filter bar) have exactly one representation in the visual filter bar.
Do not show the same filter dimension with two or more different measures at the same time in the visual filter bar. The example shows the filter Dimension Year with two different measures Revenue and Quantity. Showing the filter dimensionYear twice is not in sync with the compact filter, where it is shown only once. Furthermore, matching between the two filter types will not work.

If the use case requires you to show a dimension with different measures, consider using an overview page instead.

Do
For each dimension display exactly one representation in the visual filter bar.
Don't
Do not use the same filter dimension with different measures

Resources

Want to dive deeper? Follow the links below to find out more about related controls, the SAPUI5 implementation, and the visual design.
Elements and Controls

Implementation

Tree

Within SAP Fiori, we distinguish between tree tables and trees. Both usually allow the user to display and work with a hierarchical set of items. While tree tables are usually used for more complex data, trees are generally used for rather basic data. Trees are mostly used in the main list for a list-detail scenario using the flexible column layout and in popovers or dialogs. In certain use cases, they can also be used in the dynamic page layout.

In the case of tree tables and trees, items that contain additional items are called nodes, while items that do not contain any other items are called leaves. If available, a single topmost node is called a root node. Apart from the hierarchical structure of its nodes and leaves, a tree is quite similar to a list.

Usage

Use the tree if:

  • You need to display the key identifier of hierarchically structured items (for example in the first column of the flexible column layout).
  • Selecting one or more items out of a set of hierarchically structured items is a main use case.
  • The hierarchy has a restricted number of levels (up to about 12, depending on the content) and items (around 200).
  • You want to have only one implementation for all devices.

Do not use the tree if:

  • The main use case is to select one item from a very small number of non-hierarchical items, without viewing additional details. In this case, a select or combo box might be more appropriate.
  • Items are not structured hierarchically. Use a list instead.
  • The hierarchy turns out to have only two levels. In this case, use a grouped list.
  • The hierarchy turns out to be just a categorization based on several details of the item. In this case, an analytical table provides multi-level grouping. Note that the analytical table is not fully responsive. It is only available for desktops and tablets, so you will need to take an adaptive approach by offering an additional UI for smartphones.
  • You need to display very deep hierarchies with additional data per item. In this case, use a tree table. Note that the tree table is not fully responsive. It is only available for desktops and tablets, so you will need to take an adaptive approach by offering an additional UI for smartphones.
  • The structure contains more than around 200 items. In this case, use the tree table. It is optimized for large item sets and provides better performance. Note that the tree table is not fully responsive. It is only available for desktops and tablets, so you will need to take an adaptive approach by offering an additional UI for smartphones.
  • You need an overview of a large amount of data. In this case, use a chart.

Check out the table overview to decide which SAP Fiori table is most suitable for your needs.

Responsiveness

The tree is like a list containing hierarchical data. It acts as a container for items, with the possibility to expand and collapse nodes. When reducing the width, item texts wrap to ensure that the tree adapts to the new size.

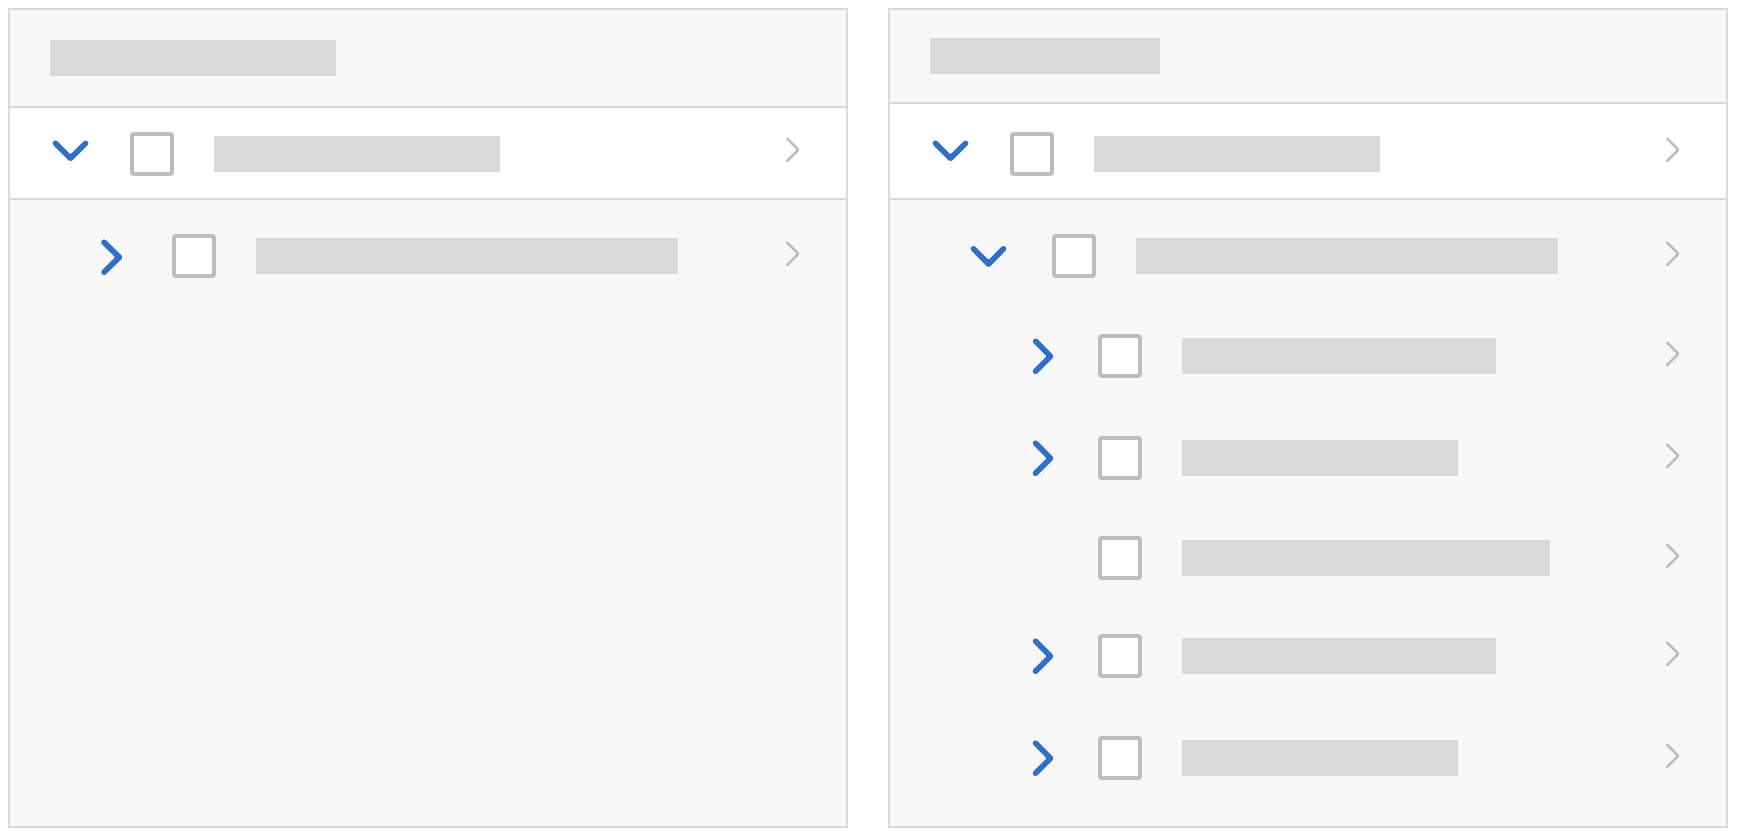
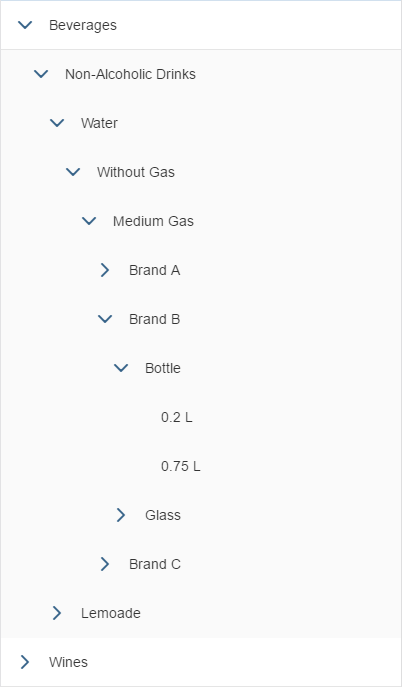
In addition, the tree changes the indentation per level dynamically when the user expands a node, based on number of levels currently showing.

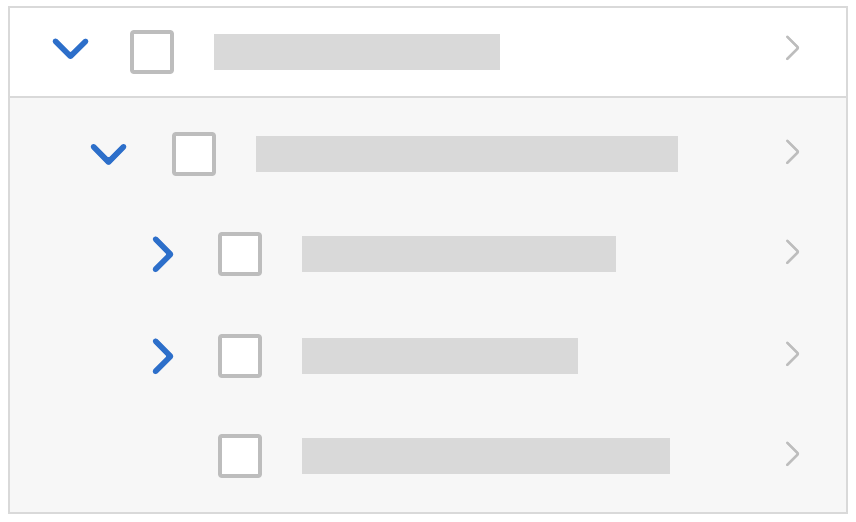
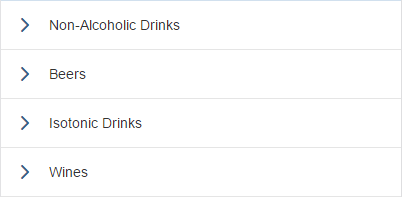
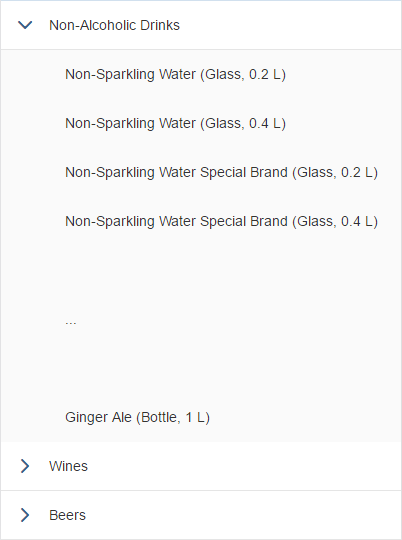
Tree displaying 2 levels
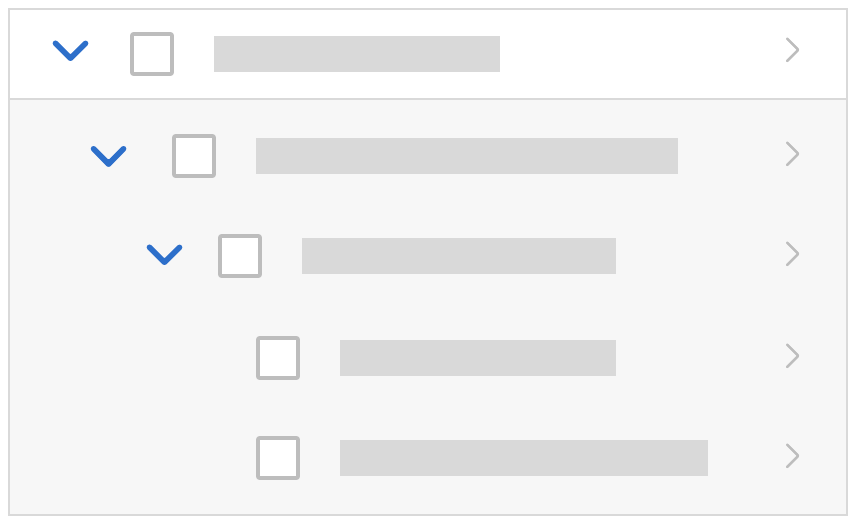
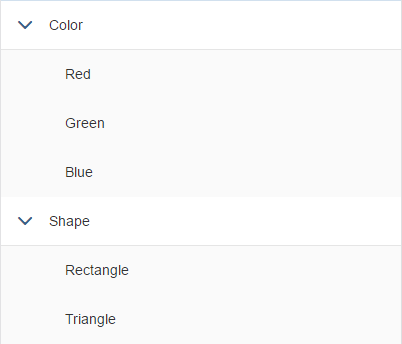
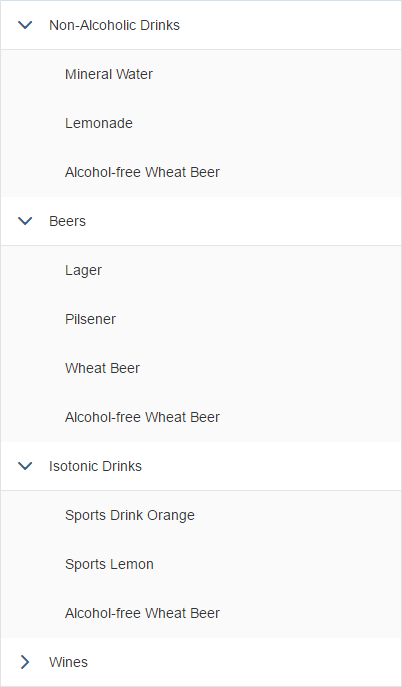
Tree displaying 3 levels
Tree displaying 4 levels

Layout

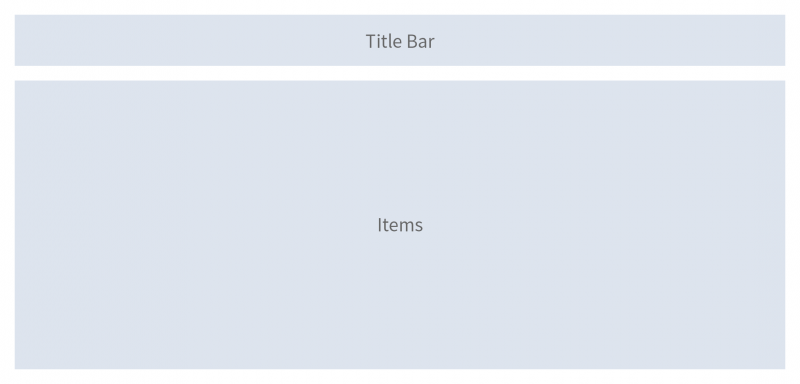
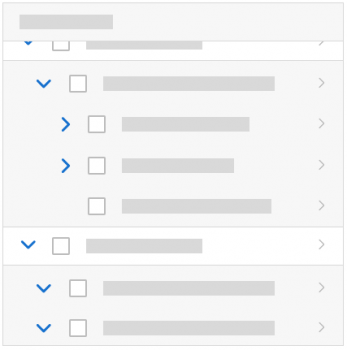
The title bar (optional) contains the title of the tree. In addition, an item counter and toolbar items can be placed on the title bar.
The collection of hierarchical items occupies the main part of the tree.

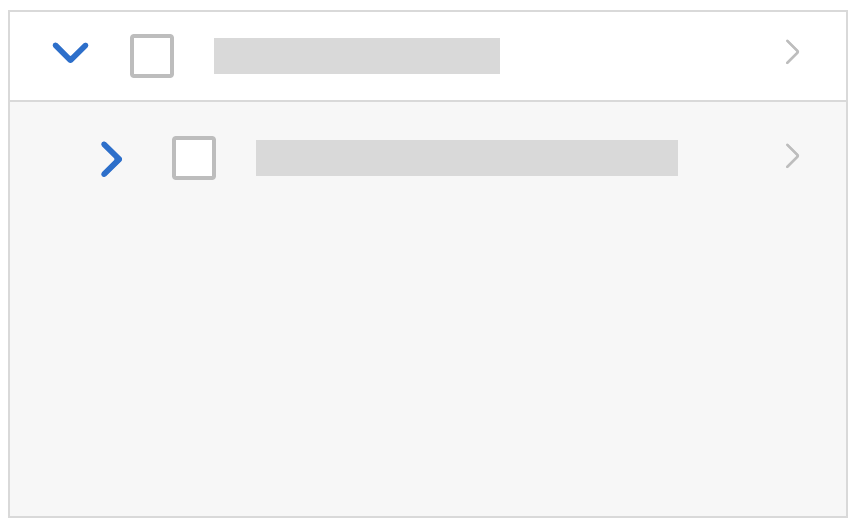
Schematic visualization of the tree

Components

The title bar consists of a toolbar. The toolbar can contain a title, an item count, and other toolbar items such as actions or view settings, for example.

The standard tree item consists of:

  • A highlight indicator (optional)
  • An expand/collapse button for nodes
  • A selector in form of a checkbox or a radio button (optional)
  • An icon (optional)
  • text
  • A counter (optional)
  • Additional buttons with actions such as Edit, Navigate, or Delete (optional)

If additional controls are needed, use a custom tree item. The custom tree item allows you to use any combination of controls inside the tree.

Standard tree item
Standard tree item

Behavior and Interaction (incl. Gestures)

Tree Level

Scrolling

The height of the tree is defined by the number of items it contains. It does not have its own scroll container, but is scrolled together with the app.

Same tree, with different expand state

When the user scrolls, the title and the filter infobar can stick to the top of the surrounding layout container (sap.m.Tree, property: sticky).

Information
The “sticky” feature comes with some limitations:

  • It is not available on all browsers. In non-supporting browsers, the corresponding areas are not fixed on top of the surrounding layout container while scrolling.
  • Certain layout containers suppress the sticky behavior, such as the grid layout. The same happens if the table is placed within the object page.
  • If focus is set to a sticky area, the tree is automatically scrolled to top.

Sticky title
Sticky title

Selection Modes

A tree can have one of the following selection modes (sap.m.Tree / sap.m.ListBase, property: mode):

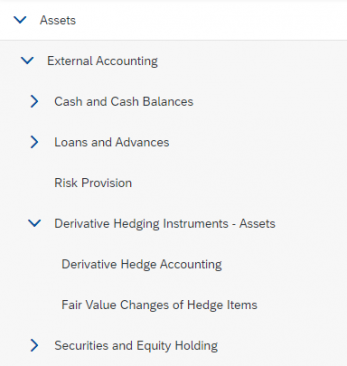
None: Items cannot be selected (sap.m.ListMode.None).
Beware: Items can, nevertheless, use the sap.m.ListType “navigation” which allows click-handling on specific items. This should only be used when the click triggers a navigation to a corresponding item details page.

Tree without selectable items

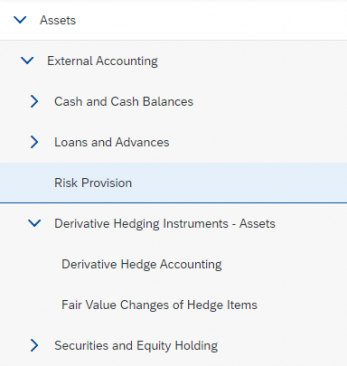
Single select master: One item of the tree can be selected. To select an item, click anywhere on the item. Single select master does not add any visual indication to the tree and therefore cannot be differentiated from trees without selection if no item is selected. Therefore, always keep one item selected. For single selection, this is the preferred mode. (sap.m.ListMode.SingleSelectMaster)

Single selection: Only one item is selected.

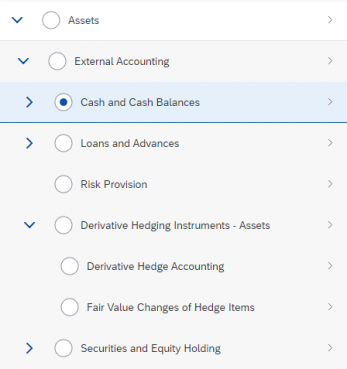
Single select left: One item of the tree can be selected. For this, the tree provides radio buttons on the left side of each line item. Use this selection mode only if clicking on the item triggers something else, such as a navigation. Ideally, always keep one item selected, even in initial state (sap.m.ListMode.SingleSelectLeft).

Single selection with radio buttons. Use only if row clicks are used for something else, for example navigation.

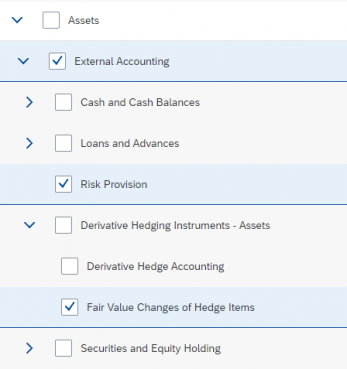
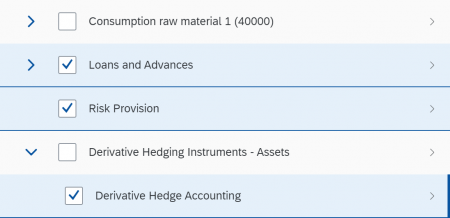
Multiple selection: Allows the selection of one or more items. For this, the tree provides checkboxes on the left side of each line item. Each item is selected independently of the others. The Shift key can be used to select a range. Users can (de)select all items using Ctrl+A. Select All should (de)select all items that the user can reach by scrolling. (sap.m.ListMode.MultiSelect).

Developer Hint
In multiple selection mode, users can (de)select all items using the shortcut Ctrl+A. This only affects items that have already been loaded to the front-end server. All other items are not (de)selected before they are loaded (for example, items added via lazy loading with growingScrollToLoad). This conflicts with the guideline that all items the user can reach by scrolling must be (de)selected.

Also note that Ctrl+A only (de)selects items within expanded nodes.

To process all items, listen to the selectionChange event and to its flag selectAll. This indicates whether Ctrl+A was triggered. As soon as an action is triggered, process the items accordingly. Depending on the number of items, consider processing them in the back end.

Guidelines

  • Never disable the selection checkbox. If an action can’t be performed on a specific item, inform the user after the corresponding action has been triggered. For more information, see Enabling/Disabling Actions.
  • For single-selection list-detail scenarios within the flexible column layout, use the mode “single select master”. Do not show an additional “navigated” indicator.
  • Avoid the mode “single select left”. It removes the possibility of clicking somewhere on the item to select it. Use it only if it is really necessary to have two different click areas; a small one for a selection, and the rest of the item for something else.
  • If selecting / deselecting all items is important for your app, add a button Select All to the toolbar. Change the button text to Deselect All if all items are selected.

Multiple selection
Multiple selection

Deleting

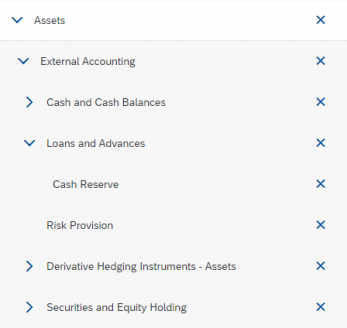
To delete single items, use the tree in “delete” mode (sap.m.Tree / sap.m.ListBase, property: mode, value: sap.m.ListMode.Delete). This adds a Delete  button to each item. Clicking this button triggers the deletion of the corresponding item. Do not use this mode if deleting multiple items at once is the preferred use case. Delete is a mode of the tree and  therefore cannot be used together with single selection or multi selection.

Tree in 'delete' mode

Line Item Level

Expandable and Collapsible Nodes

An Expand/Collapse button is provided automatically for each node.

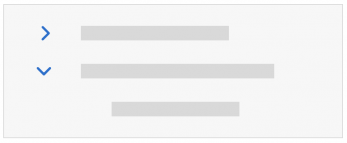
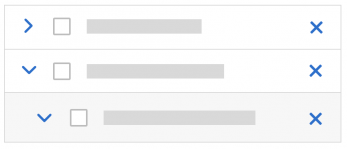
Expand/collapse button

Highlight an Item

To highlight an item, use the “highlight” indicator (sap.m.TreeItemBase, properties: highlight).

Highlighted item
Highlighted item

Navigating

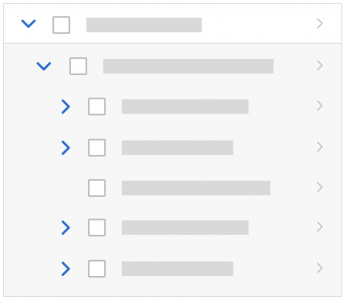
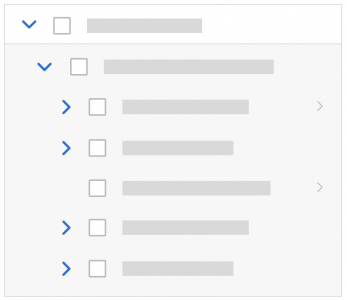
To allow navigation from an item, set type to “navigation” within the corresponding item (sap.m.StandardTreeItem / sap.m.ListItemBase, property: type, value: sap.m.ListType.Navigation). This will create an indicator at the end of the line (“>”) and the entire item will become selectable. Clicking the line triggers the navigation event. However, clicking a selectable area or an expandable/collapse node does not. Use the navigation event to navigate to a new page containing item details.
If no navigation is possible, set type to “inactive”.
Navigation is an item type and therefore cannot be used together with “edit” or in combination with click events for the entire item (“active”).

Tree items with navigation indicator
Navigation indicators can be set per item

Indicate Navigated Item

When multi-selection is used in a list-detail scenario, it is not clear which item was last opened (for example, which item is currently shown in the second column of a flexible column layout). In this case only (multi-selection tree with navigable items), you can display a “navigated” indicator to mark the item that is currently open (sap.m.TreeItemBase, property: navigated).

Navigated item
Navigated item

Editing Items

To allow the user to edit an item, set type to “detail” within the corresponding item (sap.m.StandardTreeItem / sap.m.ListItemBase, property: type, value: sap.m.ListType.Detail or sap.m.ListType.DetailAndActive). This will create an edit  button at the end of the line. Clicking the button triggers the edit event. Use this event to either open a dialog or a details page where the item can be edited.
Edit is an item type and therefore cannot be used together with “navigation” or in combination with click events for the entire item (“active”).

Edit button
Edit button

Clicking an Item

Items as a whole can be clickable. An event is fired by clicking on the item (anywhere except when triggering a selection or when expanding/collapsing a node). Apps can react to the event, such as by opening a dialog (sap.m.StandardTreeItem / sap.m.ListItemBase, property: type, value: sap.m.ListType.Active or sap.m.ListType.DetailAndActive).
Active elements do not have a visual indication and therefore cannot be differentiated from non-active elements.
“Active” is an item type and  therefore cannot be used together with “navigation” or “edit”. In addition, “active” uses the entire item as a clickable area and thus cannot be used together with the “single select master” mode.

Active items
Active items

Context Menu

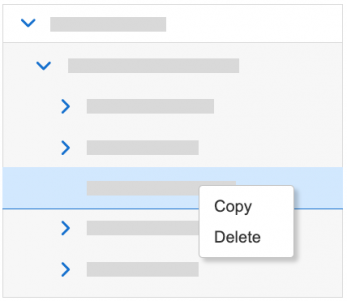
You can attach a context menu (sap.m.Menu) to a tree. The context menu gives users an alternative way to modify the focused elements by giving them access to context-specific functions.

The context menu can be triggered for the tree or per item.

Context menus are opened by right-clicking (desktop), long press (mobile), the context menu key, or Shift+F10.

Be aware that using the context menu overrides the browser context menu, which can no longer be opened.

If a control inside a tree is the “click target”, and the control also provides a context menu, the control context menu “wins”.

Tree - Context menu
Tree - Context menu

Drag and Drop

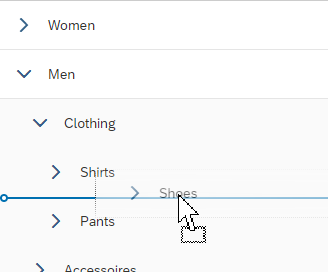
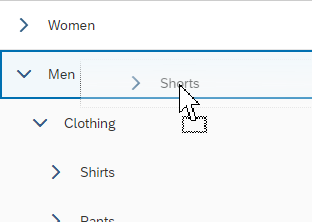
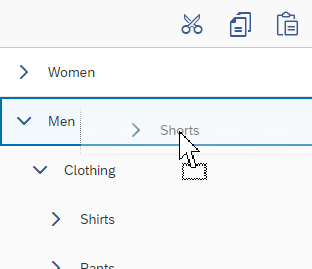
One or several items can be repositioned within a tree or moved to other UI elements using drag and drop operations (sap.m.ListBase, aggregation: dragDropConfig). While being dragged, the items are shown as ghost elements on the mouse cursor.

Drop targets can be on items, between items, or both (sap.ui.core.dnd.DropPosition). On a drop target, the mouse cursor changes to either a “copy”, “link”, “move”, or “none” cursor. “None” indicates that the dragged item cannot be dropped in the current position (sap.ui.core.dnd.DropEffect).

Drag and drop is only available on supporting browsers.

Drag and drop
Drag and drop
Whole item as drop target

Guidelines

Tree vs. List

Trees are more complex than lists due to their hierarchical view. Users tend to have more problems finding items in hierarchical views than in flat lists, except where the hierarchical view is natural. By natural we mean that every child node should be part of only one parent, and this relationship between the child and parent is clear and well known.

Example of an acceptable use of trees
Do
A clear parent-child relationship

Broad vs. Deep Hierarchies

When you use trees, you should choose broad hierarchies over deep hierarchies. Deep hierarchies make finding items more complicated. So try to reduce hierarchical levels where possible, especially if the hierarchy is not natural. Ideally, a tree should have a maximum of four levels, the first two of which should contain the most important items.

Don't
Avoid unnecessary depth in the hierarchy
Do
Favor breadth over depth in a hierarchy

You can use the following methods to reduce hierarchy levels:

  • Avoid a single root node. It is usually not needed.
  • Container nodes at the top level can usually be replaced by tabs or value pickers.
  • Eliminate unnecessary mid-level containers, for example, by combining redundant ones.
  • Exercise care when using a tree due to its overall complexity. The hierarchical structure of the data does not necessarily mean that a tree control is required.
Acceptable: repeat entries to optimize finding items

Design Concepts

The tree can be used to display hierarchical data. Unfortunately, trees convey an immediate feeling of complexity. Ideally, show trees only if there is no other option. You should instead try the following:

  • Flatten the data. A list is still complex, but less so than a tree. A combo box might also fit in some use cases.
  • When only two levels are needed, a grouped list control can be used. This works well, where group nodes are used for categorizing their children and where the group nodes themselves do not need to be selectable.
  • Break down the data into manageable chunks. Allow the user to navigate or drill down between them.
  • Use charts with drilldown functionality until the amount of data is more manageable.

Design for Performance

To optimize performance, we recommend showing no more than 200 items at once in the tree. For larger datasets (up to 1,000 items), use the “growing” mechanism to limit the number of displayed items, and make sure that users can filter the data.

Warning
The limits above are only recommendations. For a specific app context, the number of manageable items might be far higher or lower.

The actual limits depend on your concrete scenario, including:

  • The number of rows in the table
  • The number of displayed columns
  • The complexity of the cell content (for example, simple text vs. complex charts)
  • Other elements on the page (for example, multiple pages in a flexible column layout, or several tables/elements with more complex rendering on one page)
  • The browser being used

Title

Use a title only if the title of the tree is not indicated in the surrounding area. If needed, implement the title text by adding a title to a toolbar. Place the toolbar above the tree.

Do not use a title if it simply repeats text that is already above the tree. For example:

  • Beverages tree is the only control on a tab labeled Beverages.
  • A section or subsection on an object page contains only one tree.

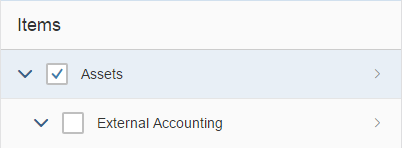
Use a title if you need the item count, toolbar, or variant management. To avoid repeating text, feel free to use generic text as a title, such as Items.
Exception: If the surrounding area contains the title, and both the item count and toolbar can be added to the surrounding area, no additional title is needed.
Example: An object page (sub-)section contains only one tree. In this case, add the item count and the table toolbar to the (sub-)section header.

If you use a title, be sure to include the following:

  • A title text for the tree.
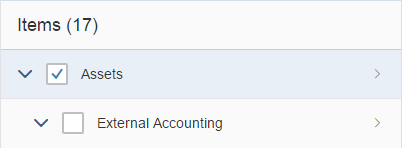
  • An (optional) item count using the following format: Title (Number of Items). For example, Items (17). Depending on the use case, either count all items or only leaves (for example, if nodes are mainly used for categorization).

Remove the item count in the title if there are zero items.

If possible, keep the toolbar sticky (sap.m.Tree, property: sticky).

Developer Hint
Assistive technologies (such as screen readers) use the title to create a hierarchical site map for faster navigation. In addition, screen readers use the title as the label for the tree.

If you don’t use a title (for example, to avoid repetition), make sure that the tree is connected to another meaningful on-screen text that can be used as a label for assistive technologies. You can do this using the method addAriaLabelledBy.

Title
Title
Title with item count

Loading Data

To indicate that the tree is currently loading items, use the busy state (sap.m.Tree, property: busy). Do not show any items or text. As soon as the data is loaded, remove the busy state and show all items.

Tree in busy state while loading data

Initial Display

Think of the initial expandable/collapsible state of a tree. If your structure contains many items on the root level, it might make sense to collapse the whole tree in its initial state.

In contrast, if the most important items are displayed on a deeper level (if, for example, the parent nodes are simply a kind of categorization), the tree should be expanded up to the first level where the most important items immediately appear.

Errors and Warnings

To indicate that the tree contains items with errors or warnings, show a message strip above the tree. On the message strip, provide information about errors or warnings. When issues are solved or when new issues appear, update the message strip accordingly.

To indicate an error in a single row, see Item States below.

For details on displaying errors, warnings, and other messages, see Message Handling.

Developer Hint
The sap.m.plugins.DataStateIndicator displays a message strip above the table, which shows binding-related messages.
Tree containing errors

Content

Content Formatting

To display object names with an ID, show the ID in parentheses after the corresponding object name.

Place the ID in brackets after the corresponding object name

Try not to display an empty tree. If there is no way around this, provide instructions on how to fill the tree with data (sap.m.Tree / sap.m.ListBase, properties: showNoData, noDataText).


Examples:

  • If a tree is initially empty, provide at least a basic text:
    No items available.
    Overwrite this whenever a hint can be provided on how to fill the tree with data.
  • If a tree is used together with a filter bar (as in the list report), and is initially empty, use the following text:
    No filters set. To start, enter your search and filter settings and run the search.
  • If a tree is used together with a filter bar and the filter does not return results, use the following text:
    No items found. Check the search and filter settings.

Adapt the texts above if:

  • The text is not precise enough for your use case (for example, no search is offered, only the search is offered).
  • You are using the live search (no Go button in the filter bar). In this case, leave out “run the search”.
  • The standard text is misleading (for example, if the data is filled based on a list-detail pattern instead of search and filter settings).
Provide meaningful instructions within an empty tree

Highlighting Items

To show that an item needs attention, you can display a highlight indicator in front of the item. The highlight indicator can be used to indicate:

  • A semantic state, such as red or orange for an error or warning. In this case, use semantic colors.
  • Additional information, such as blue to highlight newly added items. In this case, use semantic colors.
  • Industry-specific or process-specific states, such as “out of stock” or “excess of inventory”. In this case, use indication colors.

Be aware that the highlight is just an indication. It does not tell users exactly what is wrong. Make sure that you provide this information within the table row, ideally in the same color.

For details on the use of highlight colors, see How To Use Semantic Colors.

(sap.m.ListItemBase, property: highlight)

Highlighted items
Highlighted items

Item States

To show that an item has been modified, for example within the global edit flow, add the string (Modified) to the text of the item.

A modified item
A modified item

To show that a modified item contains an error, for example within the global edit flow, add the string (Contains errors) to the text of the item and highlight the row accordingly. A row with errors should be highlighted in all use cases – for example when the field is visible in the row in edit mode.

A modified item with an error

To show that an item is locked, add the string (Locked by [name]) to the text of the item.

A locked item
A locked item

To show that an item is in a draft state, add the string (Draft) to the text of the item.

Item in draft state
Item in draft state

Show only one state at any one time.

Actions

To trigger actions on items, show the actions on a toolbar above the tree. Do not offer action triggering on multiple items if the tree is expected to have fewer than 10 items in most cases.
The following actions on single items must always be in-line:

Delete: Use “Delete” mode (sap.m.Tree / sap.m.ListBase, property: mode, value: sap.m.ListMode.Delete). This places a Delete  button at the end of each item.

Items with 'Delete' button

Navigation: Use the “Navigation” item type (sap.m.StandardTreeItem / sap.m.ListItemBase, property: type, value: sap.m.ListType.Navigation). This places a navigation indicator at the end of the corresponding items. Use this to navigate to a new page containing item details.

Items with navigation indicator

Edit: Use the “Detail” item type (sap.m.TreeItem / sap.m.ListItemBase, property: type, value: sap.m.ListType.Detail). This places an Edit   icon at the end of the corresponding items.

Edit button
Edit button

From these three actions (delete, navigation, and edit), you can combine delete and edit, or delete and navigation. Edit and navigation cannot be combined.

To trigger actions that are independent of the selection, show the actions on a toolbar above the tree. For example: AddCollapse AllExpand All, …

To trigger a default action on the entire item, use the “Active” or “DetailAndActive” item type (sap.m.TreeItem / sap.m.ListItemBase, property: type, value: sap.m.ListType.Active). Active items trigger an event when clicked, which can be handled by apps, for example, to open a dialog. Selection and expanding/collapsing a node does not trigger the event, but are handled by the tree. Do not use this for navigation, to switch the line item to an edit state, or to delete the item.
Active can be combined with edit and delete, but not with navigation. Do not combine active with single selection master.

Add Items

For adding items, place an Add or Create text button on the tree toolbar.

  • Use Create if the button adds a brand new item that doesn’t yet exist on the database.
  • Use Add if the item already exists and is merely added or assigned to the current object.

Enable the shortcut Ctrl+Enter (and ideally Enter in addition) to trigger the Add or Create button.

Show new items as the first item of the tree or node:

  • If nothing is selected, add the new item to the root.
  • If a single node is selected, add the new item to the selected node.
  • If a single leaf is selected, add the new item as a child of this leaf. The original selected item becomes a node.

If your tree doesn’t support adding items to the root, selected node, or selected leaf, disable Create or Add for the corresponding levels.

Disable Create or Add if more than one item is selected.

There are three options for adding an item. In order of priority (most recommended first), these are:

  1. Add the item inline. Create an empty, editable item as the first item of the selected node. Show the Save button on the tree toolbar. This option is recommended for simple scenarios where just a few input fields have to be filled.
  2. Open a dialog for items where up to 8 input fields need to be filled. Save the new item at dialog level.
  3. Navigate to a new page. This behavior should only be used for very complex scenarios that cannot be handled by a dialog (for example, creating complex objects). When the user presses Save in the footer toolbar of the create page, navigate back to the tree.

Depending on the flow, an item can be in one of three different states:

  • New: The item was just created inline and is in edit mode (for example, after pressing the Create button). It is highlighted with a visual indicator (information state).
  • Recent: The item was just created and is in read-only mode (for example, if Create leads to a dialog, and Save was triggered within the dialog). In this case, keep the item highlighted and display it as the first item of the corresponding node. Ignore current sort, filter, and grouping criteria to keep the item visible.
  • Added: The item has been fully added. It follows the sort, filter, and grouping settings and also loses the visual highlight. This state is used after:
    • Inline creation: After Save was triggered on the tree toolbar or at page level.
    • Create with dialog: A tree showing one or several items with the state “Recent” gets updated (for example, after sorting, filtering, or grouping, or when the browser is refreshed).

In the context of draft handling, new items are not saved at tree level, but rather with the entire draft.

For more details, see the guidelines for managing objects (including subarticles).

Editing Items

To edit items, add an Edit button either in-line on the toolbar above the tree. Triggering the button either opens a dialog or navigates to an editable details page.

For mass editing:

  • Provide multiselection (sap.m.Tree/ sap.m.ListBase, property: mode, value: sap.m.ListMode.MultiSelect).
  • Provide an Edit button on the toolbar above the tree.
  • If several items are selected, triggering the Edit button opens a dialog in which the user edits the corresponding fields for all selected items.

For more details, see mass editing.

Context Menu

Use the context menu only to give users a quick way of accessing functions that are already available elsewhere (for example, as buttons in the toolbar).

Don’t just offer actions in the context menu itself, as users might not realize that these actions are available at all.

Drag and Drop

Warning
To comply with the new WCAG 2.2 standard, the control must offer an alternative to the drag and drop feature. See the visible alternatives described below.

Drag and drop is “invisible” on the UI: users can’t see where dragging is available and where it isn’t. In addition, there is no generic keyboard interaction. Drag and drop is also not available on all browsers. For these reasons, provide it only in addition to existing (and visible) UI elements that fulfill the same purpose. For example, offer (toolbar) buttons for moving or for copying and pasting items. These are keyboard operable and available on all browsers.

Use drag and drop only in addition to existing visible UI elements

If you offer drag and drop for rearranging items within a tree, use the following options:

  • For dropping items as a child, use whole nodes as drop targets (sap.ui.core.dnd.DropPosition.On).
  • For dropping items on the same level, use the space between items as drop targets (sap.ui.core.dnd.DropPosition.Between).
  • If you want to allow users to drop items as a child or sibling, offer both drop targets (sap.ui.core.dnd.DropPosition.OnOrBetween).

This provides better feedback on where the item will be inserted. Show the “move” mouse cursor (sap.ui.core.dnd.DropEffect.Move).

Do not combine rearranging items within one level and sorting. If you really need to do so, make sure there is a dedicated sort criterion for the user-defined sort order, and only offer options for rearranging items if this sort order is set.

Moving items from one node to another can be combined with sorting without any issues.

Drop targets in between items

Visible Alternatives to Drag and Drop

Depending on the functionality you need, use one or more of the following alternatives:

  • To move items up or down within a node:
    Use the  Move Up and  Move Down buttons on the toolbar. These buttons move the selected items until the first selected item can’t be moved up or the last selected item can’t be moved down any further.
    Depending on your tree, this can make sense for both leaves and nodes, only for leaves, or only for nodes. When moving a node, move the whole node and (if applicable) all its children up or down to the next position within the parent node.
    Always make sure that when the user moves an item in one direction and then moves it back, the order is the same as it was before.
    Do not combine the option to move items up and down with sorting.
  • To move items to another node:
    Use Copy and Paste buttons on the toolbar.
    Alternatively, offer a Move To button. Clicking Move To opens a dialog that shows all the nodes of the tree, but no leaves. Selecting an item in this dialog closes the dialog and moves the corresponding items to the selected node.
  • To change the level of an item:
    In some trees, such as document structures, users can change the level of an item without affecting the level of parent or child items. In this case, use left and right arrow buttons (   ).

Filtering

What exactly needs to stay or be removed is highly dependent on the kind of structure and data your tree displays. For many trees, the following approach works well if you want to apply filters only to the leaves of a tree:

  • Remove all leaves that don’t fit the filter criteria
  • Remove empty nodes

If you also apply filters to nodes, keep the following in mind:

  • A node may or may not fit the filter criteria.
  • A node can contain items (nodes and/or leaves) that fit the filter criteria.

Because of this, the results might contain more nodes than those that are relevant for the filter criteria.

Information
The tree control itself has no influence on the filter result. It sends a filter request and displays whatever comes back. Make sure that the result set is meaningful.

Sorting

Before you start, ask yourself if sorting is meaningful in your tree. If so, decide on a meaningful default sort order.

If sorting is meaningful, is it meaningful on all levels? Or does the tree structure need to be stable? In the latter case, sort only leaves, but not nodes.

Always sort the tree in a meaningful way when it first loads.

The descending sort order must always be the exact reverse of the ascending sort order. Use a meaningful sort order. For example:

  • Sort text alphabetically
  • Sort numbers by their value
  • Sort status information by the severity of the status:
    • Ascending: Sort status information from positive to negative, with neutral last.
    • Descending: Sort status information from negative to positive, with neutral first.
    • Ascending with different values per severity level: Sort status information from positive to negative, with neutral last. Sort different values within a severity level (semantic color) alphabetically.
    • Descending with different values per severity level: Sort status information from negative to positive, with neutral first. Sort different values within a severity level (semantic color) alphabetically.

Export to Spreadsheet

On the table toolbar, apps can provide a menu button for exporting the tree data to a spreadsheet. For the export, use the export to spreadsheet function.

'Export to Spreadsheet' menu button

Resources

Want to dive deeper? Follow the links below to find out more about related controls, the SAPUI5 implementation, and the visual design.
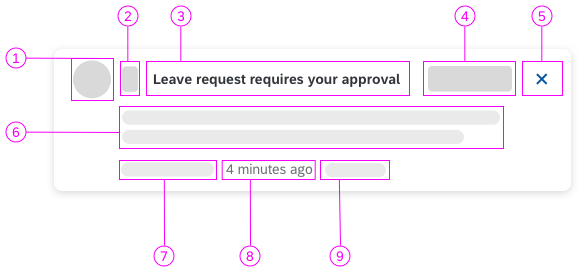
Elements and Controls

Implementation

Lightbox

The lightbox control allows the user to view an image in its original size. This control displays the image in a popup while dimming the rest of the screen.

Usage

Use the lightbox if:

  • The thumbnail view is not detailed enough, and it would help the user to see the image in its original size.
  • The original size of the image is bigger than the thumbnail.

Do not use the lightbox if:

  • The image you are using is smaller than or as big as the thumbnail.
  • There is another click event attached to the image control.
  • You are using an image placeholder to display the object.

Responsiveness

The lightbox container is displayed in the middle of the screen.

The image is displayed in its original size unless the original image size is bigger than the size of the screen. In this case, the image is resized proportionally in order to be fully visible and fit on the screen.

On a mobile device, flipping the device to landscape mode will flip the lightbox. The image will then be adjusted to fit the new dimensions.

Lightbox - Size XL
Lightbox - Size XL
Lightbox - Size S
Lightbox - Size S

Components

The lightbox contains the following components:

  1. Lightbox container: This is the main container that holds all other components.
  2. Image: This component is an embedded image control that displays the image file with the maximum available size. The size of the image should not exceed the original size and it should fit within the screen.
  3. Image title: This component is mandatory and is used to describe the object to which the image is attached.
  4. Image subtitle: This component is optional and is used to give additional information about the object.
  5. Close button: This is a mandatory component and is used to close the lightbox container.
Components of the lightbox

Behavior and Interaction

Basic Interactions

The lightbox control is attached to the press event of the image control. To trigger the lightbox, the user should click an image. Every image with an attached lightbox control is indicated with a zoom icon on the bottom right.

Lightbox - Zoom icon

When the lightbox control is triggered, the lightbox overlays the page content and the rest of the screen is dimmed out.

If it takes more than one second to load the original image, a busy indicator is shown inside the lightbox container.

The user can close the lightbox by clicking the Close button or by clicking outside of the lightbox container.

Lightbox - Image loading
Lightbox - Basic interactions

Error Handling

An illustrated message is displayed inside the lightbox when:

  • The original file is missing or the connection to the server is lost.
  • The image takes more than 10 seconds to load due to a server error or the size of the image.
Developer Hint
The URL of the image is mandatory. If it is not specified, the lightbox will not be triggered.
Lightbox - Error message

Resources

Want to dive deeper? Follow the links below to find out more about related controls, the SAPUI5 implementation, and the visual design.

Elements and Controls

Implementation

Gantt Chart

The Gantt chart enables you to present time-dependent data in an intuitive graphical manner, from a hierarchical and/or resource-oriented viewpoint. It shows the user the sequence in which various activities occur and the dependencies between these activities. The user can easily see the start and end of a particular activity.

The Gantt chart control provides the basis for creating such a Gantt chart and is a generic tool. Applications can consume the control in order to implement their use cases, and if necessary, they may even enhance the control.

It consists of three areas: a chart area, a table area, and a global toolbar.

Another feature is the option to have a split screen that includes two or more views next to one another, each view consisting of one table and one chart. These views can be arranged vertically or horizontally, and they share a common (global) toolbar.

Gantt chart control – Overview
Gantt chart control – Dual view

Usage

Use the Gantt chart if:

  • You want to build an interactive and complex planning application involving activities, resources, hierarchical project structures, relationships, and other basic shapes such as diamonds, utilization line charts, or bar charts.
  • You want to build a simple application which may be read-only or which does not have a table component.
  • You want to build a simple application that is also capable of evolving into a more powerful application later on.

Do not use the Gantt chart if:

  • Your application needs to run on a smartphone. Consider using the planning calendar control instead.
  • You need to show less than 100 rows. You can still use a Gantt chart, but consider using the planning calendar control instead.
  • You want to show only a simple graphical representation based on rectangles (in other words, without relationships, milestones, and so on). Consider using the planning calendar control instead.

Responsiveness

The Gantt chart is responsive in principle. It can be displayed in a small window (size M) and preserve its layout without needing to create multiple levels of scrollbars nested in one another in the browser window. However, the control is not available in smartphone size (size S).

The Gantt chart control can be used to display data in tablet (size M).

Types

Like all SAP Fiori controls, the Gantt Chart is shown in compact mode on a desktop and in cozy mode on tablets.

For desktop devices, you can fit even more rows onto the screen by using the condensed mode together with the compact mode. This renders less white space for each item.

The condensed content density must always be set in addition to the compact mode. Do not use the condensed mode on its own. Do not mix condensed with cozy. Doing so could lead to unpredictable or unwanted results, such as cozy-sized controls in condensed-sized containers, missing padding, and so on.

Note that neither compact mode nor condensed mode support touch interaction. Even on a desktop with a touch screen, users will have difficulty selecting rows or using controls inside the cells with their fingers.

Furthermore, condensed mode is not available for Internet Explorer 9. If you plan to use condensed mode, please provide a fallback.

For more information on cozy and compact modes, see content density.

Layout

The buttons contained in the optional global toolbar can control the behavior of the entire Gantt chart across multiple views. Each view can contain a local toolbar. This local toolbar is optional and is located above the tree table.

The buttons contained in the local toolbar can only control the behavior of its corresponding view. Each view can contain a tree table to the left and a chart to the right. However, the tree table is optional and the chart area can stand on its own.

Schematic visualization of the Gantt chart

Components

The Gantt chart consists of three areas: a global toolbar, a table area, and a chart area. There can be more than two table and chart areas in a split-screen layout.

Global Toolbar

The global toolbar provides standard functions, which are required by several applications. However, app teams can add extra functions. The user can also hide certain standard functions.

The following standard functions are available:

  • Legend (see details below)
  • Settings (see details below)
  • Zooming (see details below)
  • View combination switch: This dropdown menu is shown only if the consuming application provides more than one view combination.
  • View arrangement: Hide one of multiple views; add views; switch between vertical and horizontal alignment of the views. This can be skipped by the consuming application.
  • Overflow behavior: The global toolbar has the same overflow behavior as the SAPUI5 toolbars. For more information, see toolbar overview.
Gantt chart global toolbar

Legend

For the legend, we provide two templates to address fast implementation in most use cases:

  • List template: Displays a list of shapes and their corresponding texts. You can also add a checkbox before each shape, which allows the application to control if the shape will be displayed in the chart.
  • Dimension template: Shows a matrix of shapes and their corresponding texts for varied combinations of two dimensions.
List legend and dimension legend

Settings

Users can configure the display of the Gantt chart using the Change Settings button ( ). The control offers some standard settings (such as Indicate Current Time, Show Cursor Line, Show Divider Lines, Show Ad Hoc Lines, and Synchronize Time Scroll). The app team can also add their own settings to the settings dialog, giving users more options to control the behavior of the Gantt chart.

You can hide the Change Settings button if the settings are not suitable for your use case. The Gantt Chart control provides the API setToolbarSchemes, which allows applications to override the default buttons in the chart toolbar. Other APIs also allow you to define default values for all the settings. For more information, check out the API reference.

Standard settings
Standard settings

Zooming

The control provides a zooming function for the chart area. It consists of a Zoom In/Zoom Out magnifier buttons and a slider. You can hide the slider if there is not sufficient room for it, for example in size M. The zooming function also controls the labelling of the time axis, which determines whether you see years, months, or days. For more information, see time axis.

Show or hide the zooming slider

Chart Area

The chart area that includes the Gantt chart comprises a time axis and rows that contain different shapes. The position of a shape on the time axis depends on the dates of the object represented by the shape.

General

The chart area is closely connected to the table area. This means a line in the table corresponds to a line in the chart. Selecting a row in the table also selects this row in the chart. The height of the line is the same in both areas. If the user scrolls in one area, the other area scrolls in exactly the same manner.

Time Axis

The chart control can display the time axis in different time measurements as defined by the consuming application. Every time axis should have two levels. The app team can define the formatting of the labels for the times axis. The formats defined by SAPUI5 are supported. The Gantt control provides a default configuration for the time axis.

For more information, see time axis.

Time axis
Time axis
Example of possible timelines

As shown in the above examples, you can display a vertical line indicating the current date. The actual date can be displayed on the axis. It’s also possible to show non-working time frames, such as weekends, by graying out these time frames. These dates can vary from line to line.

Basic Shapes

The Gantt control offers these basic shapes:

  • Rectangle
  • Polygon
  • Line (for example, to show notifications for rectangles)
  • Triangle (for example, to represent constraints such as time windows)
  • Diamond (for example, to represent milestones)
  • Chevron (for example, to represent project phases)
  • Cursor (for example, to represent checklist items)
  • Image (for example, to place images in the chart)
Basic shapes: rectangle, line, chevron, polygon, cursor, diamond, triangle

These shapes can also be combined. The chart control can render the shapes with different border and fill styles and border and fill colors, and use gradients. For more information, see colors.

App teams can add their own shapes, but they must adhere to the chart guidelines on colors. In general, you should use the qualitative palette, but if you need more colors, use the sequential palette.

When choosing the colors and hues to represent different object types, remember to select those that have a significant contrast.

The most commonly used shape is the rectangle (or bar).

Although it is technically feasible to use two bars above and below each other in one row, we do not recommend this practice. Particularly with high screen resolutions, this can lead to visual crowding so that the user cannot discern between different elements.

For example, if you want to show the degree of completion in a bar, it may be better to superimpose the finished section using a different shade over the original task.

Example of completion in a bar

Relationships

You can link two shapes with a line in various styles and colors. The exact meaning of the relationship depends on the use case and the application. However, it usually implies that one activity has to be performed or at least started before the subsequent activity can begin.

  • A relationship can begin from the start or end date of a shape.
  • A relationship can end at the start or end date of a shape.
  • The end of a relationship is shown using an arrow.
  • One shape can have multiple relationships.

The app team should define the logic of a relationship, such as rescheduling.

Relationship between shapes

Utilization Chart

The utilization line chart and utilization bar chart enable you to display the level of consumed capacity of a resource at a specific point in time.

The system displays the utilization curve of the selected resource in the chart panel. You are notified of low load utilization and over-capacity by predefined colors. Moreover, the tooltip along the utilization curve displays the utilization of a resource in specific aspects according to your settings. You can customize it to fit your business needs, for example, to display the loading utilization of a vehicle resource in terms of volume or weight.

Example of utilization chart

Recommendations

Use line widths large enough for the user to distinctly recognize the line. Avoid using dotted or dashed lines whenever possible.

Table Area

The Gantt control contains a table area that allows you to display and edit details of each line. For example, you may want to edit dates using a date picker rather than dragging a shape into the chart area. The table used in the control is the SAPUI5 tree table.

Behavior and Interaction

Various tooltips can be shown, but you should not use them to show additional information because users cannot access this functionality on touch devices.

The Gantt chart supports various events, allowing you to build rich and interactive applications.

Shape Selection

When a shape (including relationships) is clicked, the shape is highlighted and an event is raised. The application can provide respective event handling to catch the event and perform tasks as needed, such as showing an action sheet, or showing a detailed information popover. A parameter is provided to enable three different selection behaviors for different usage environments:

  • Single selection of the shape via clicking
  • Multi-selection of the shapes via clicking
  • Multi-selection of the shapes by pressing the Ctrl key and clicking
Multi-selection of shapes

Shape Drag and Drop

When you click a shape and hold the mouse in the chart area, a shadow of the shape moves along the mouse. When you release the mouse, an event is raised, and then the application can provide an event handler to catch the event and perform tasks as needed, such as moving the shape to a new position. You can also drag and drop the shape across different views inside the same Gantt chart or even outside the Gantt chart; it’s also possible to drag-and-drop multiple selected shapes.

Shape drag and drop
Shape drag and drop

Shape Resize

When you move the mouse icon to a certain border of a shape, the mouse icon changes into a double-headed arrow, pointing left and right. This indicates that you can resize the shape. You can click and hold the mouse and then drag the shape border horizontally. Once the border reaches the expected position, release the mouse. The Gantt chart raises an event when the mouse is released. Your application can use an event handler to catch the event and then perform tasks as needed, such as changing the duration of the shape.

Resizing a shape
Resizing a shape

Relationship Creation

You can connect shapes in the Gantt chart. This can be used to represent the relationship between two activities.

To connect shapes:

  1. Click a shape to display its connection points on the shape borders.
  2. Click the connection point of the shape and then slightly drag it. This displays the connection points of all other connectable shapes.
  3. Connect the shape to another one by reaching its connection point via drag and drop.
Create a relationship

Row Selection

You can select a row the same way as in a tree table, and the corresponding row in the tree table and chart part is highlighted;

Multi-row selection
Multi-row selection

Here are other important events supported by Gantt control:

  • Chart click
  • Chart right-click
  • Chart double-click
  • Chart mouse over
  • Horizontal scroll
  • Vertical scroll
  • Splitter resize

For more information, see the API reference.

Resources

Want to dive deeper? Follow the links below to find out more about related controls, the SAPUI5 implementation, and the visual design.
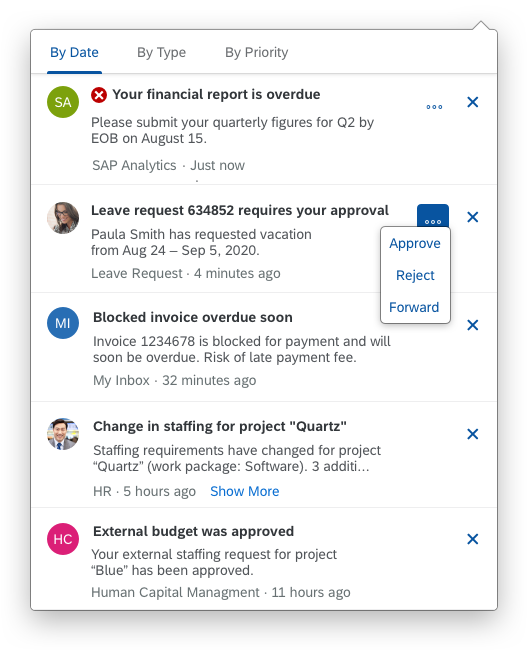
Elements and Controls

Implementation