
Analytical Frameworks
For analytical applications, you can use the following frameworks:
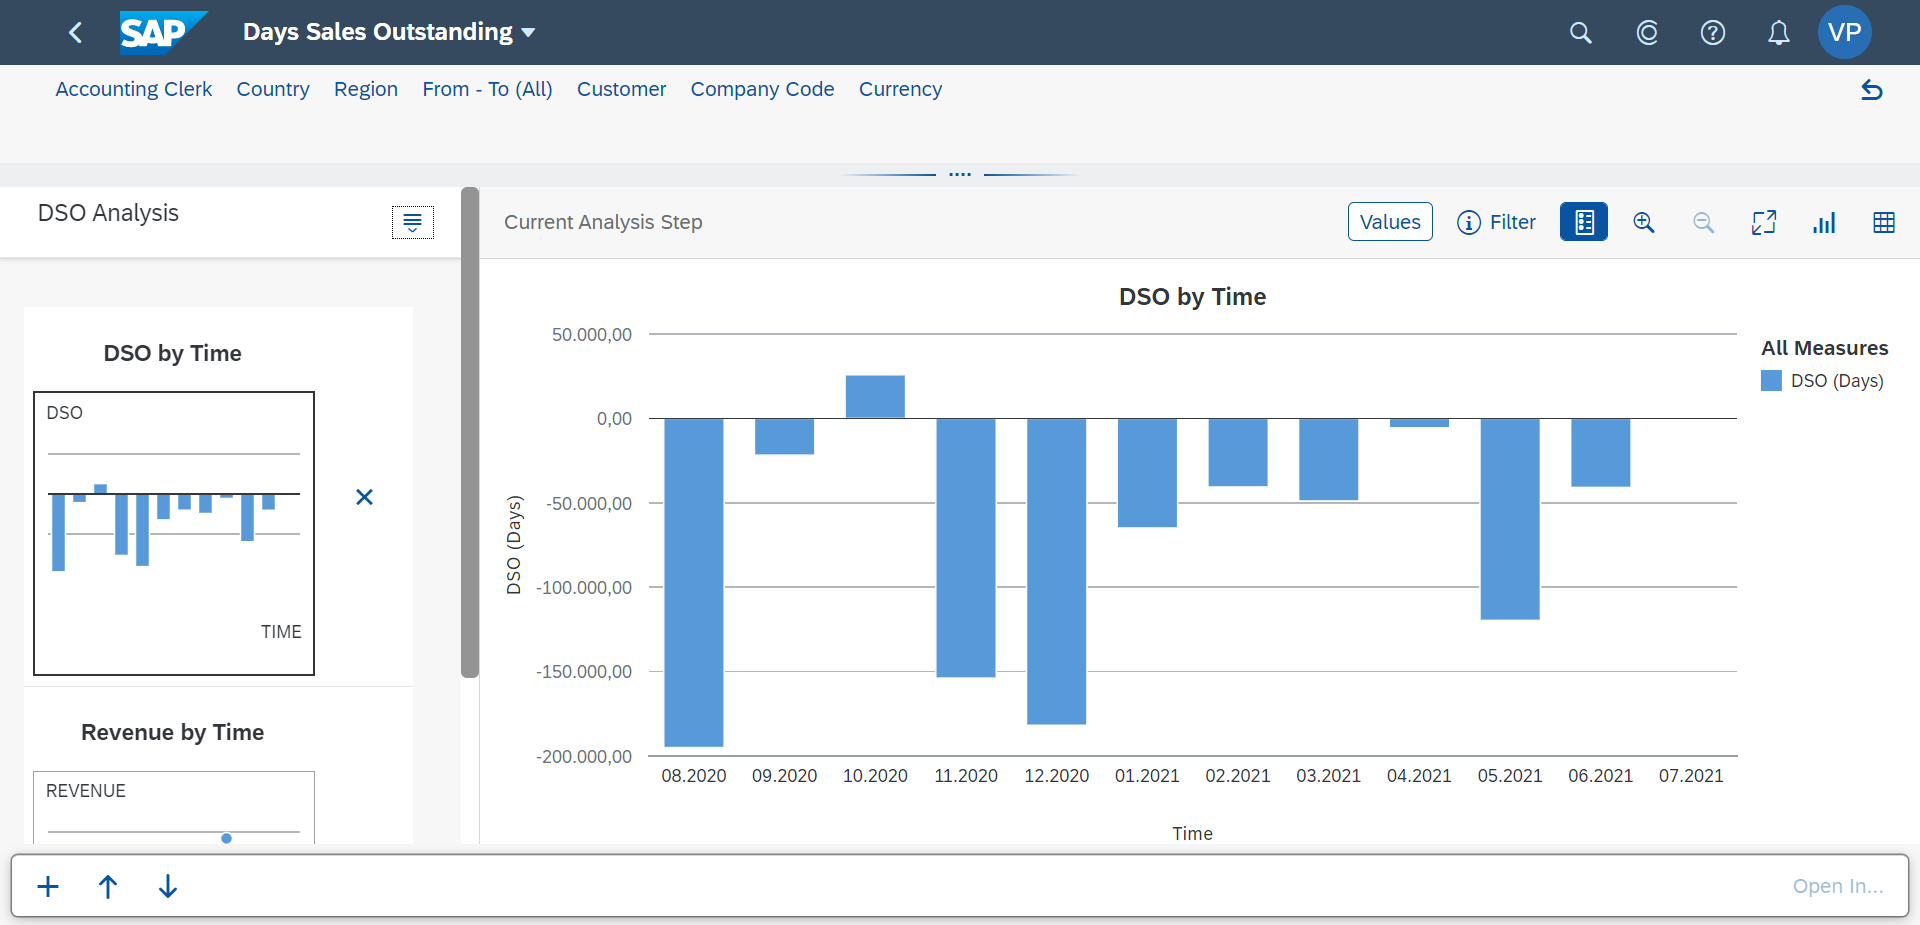
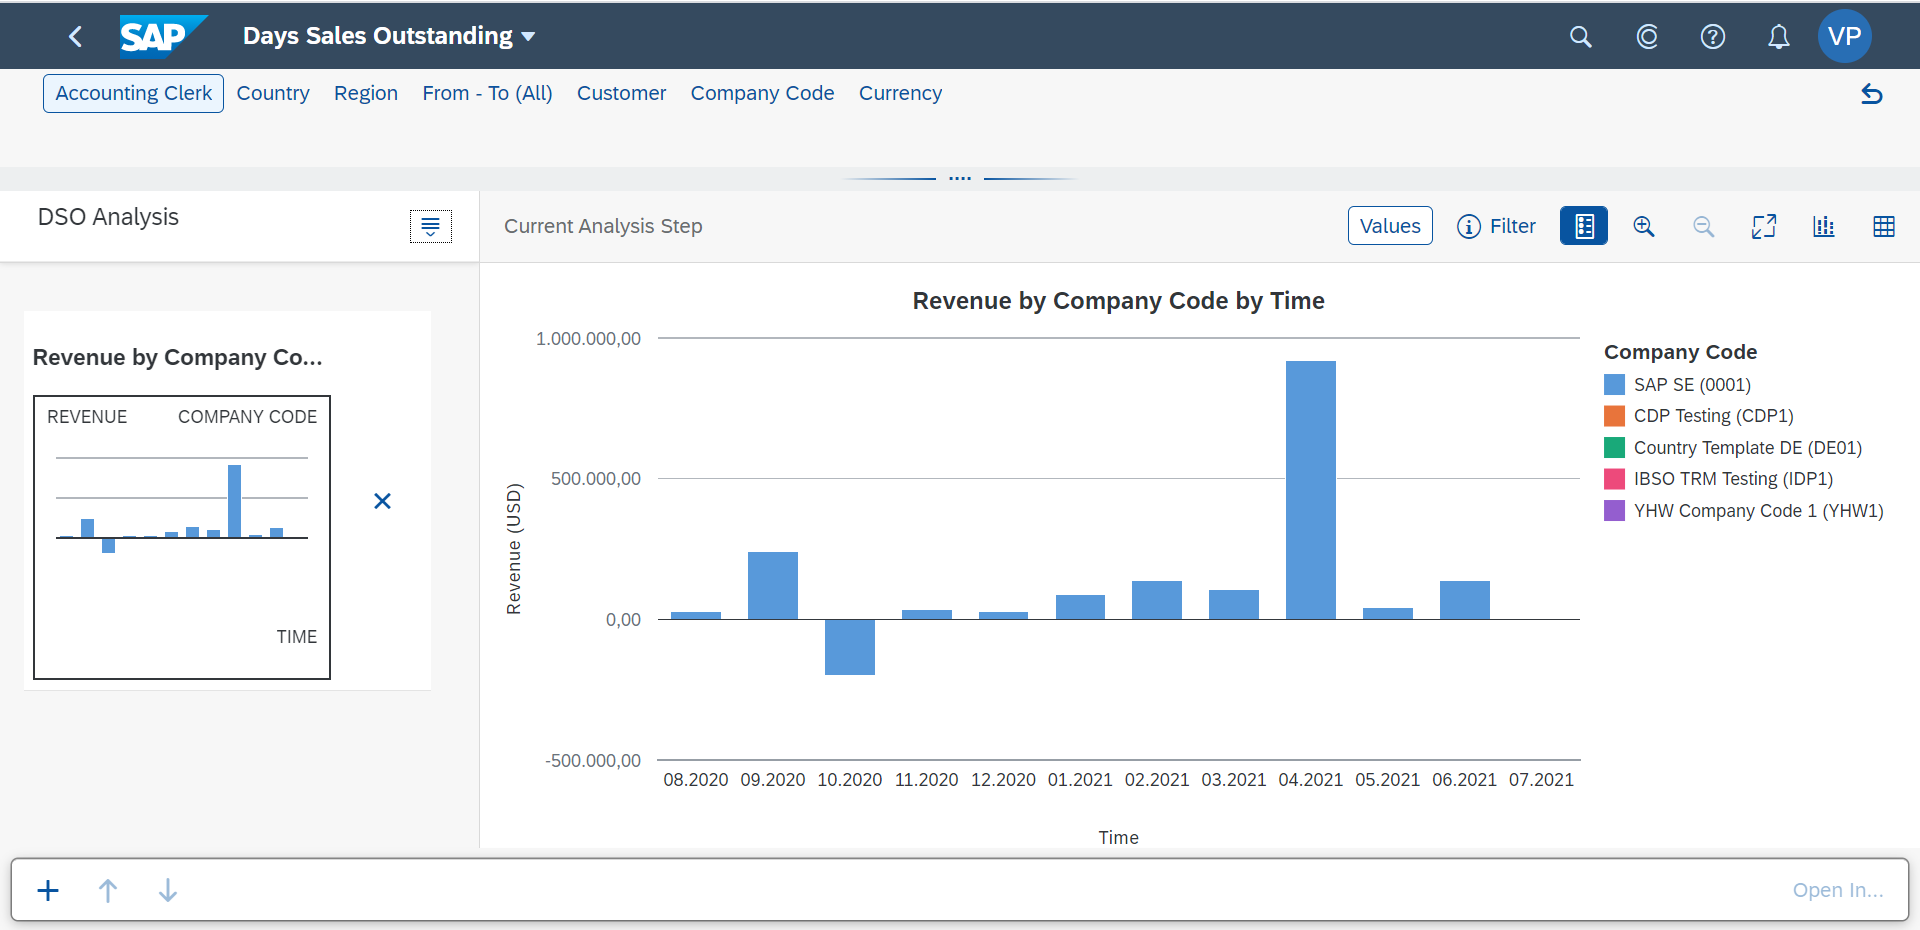
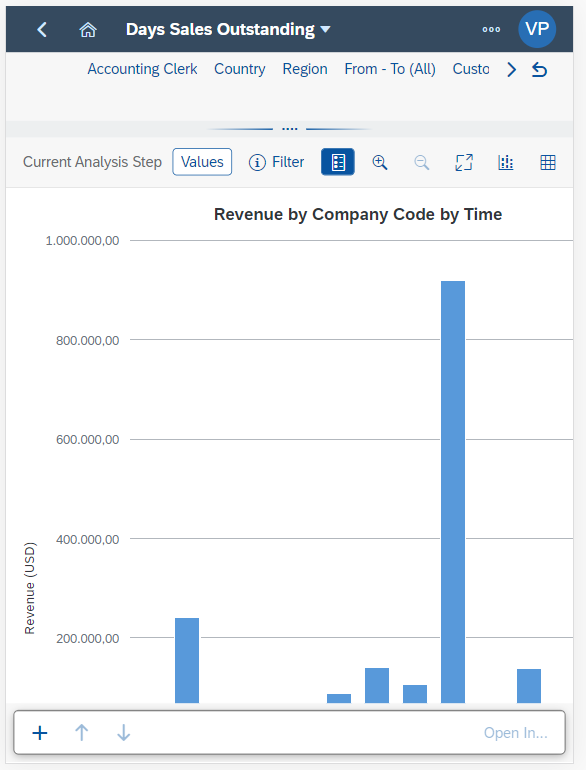
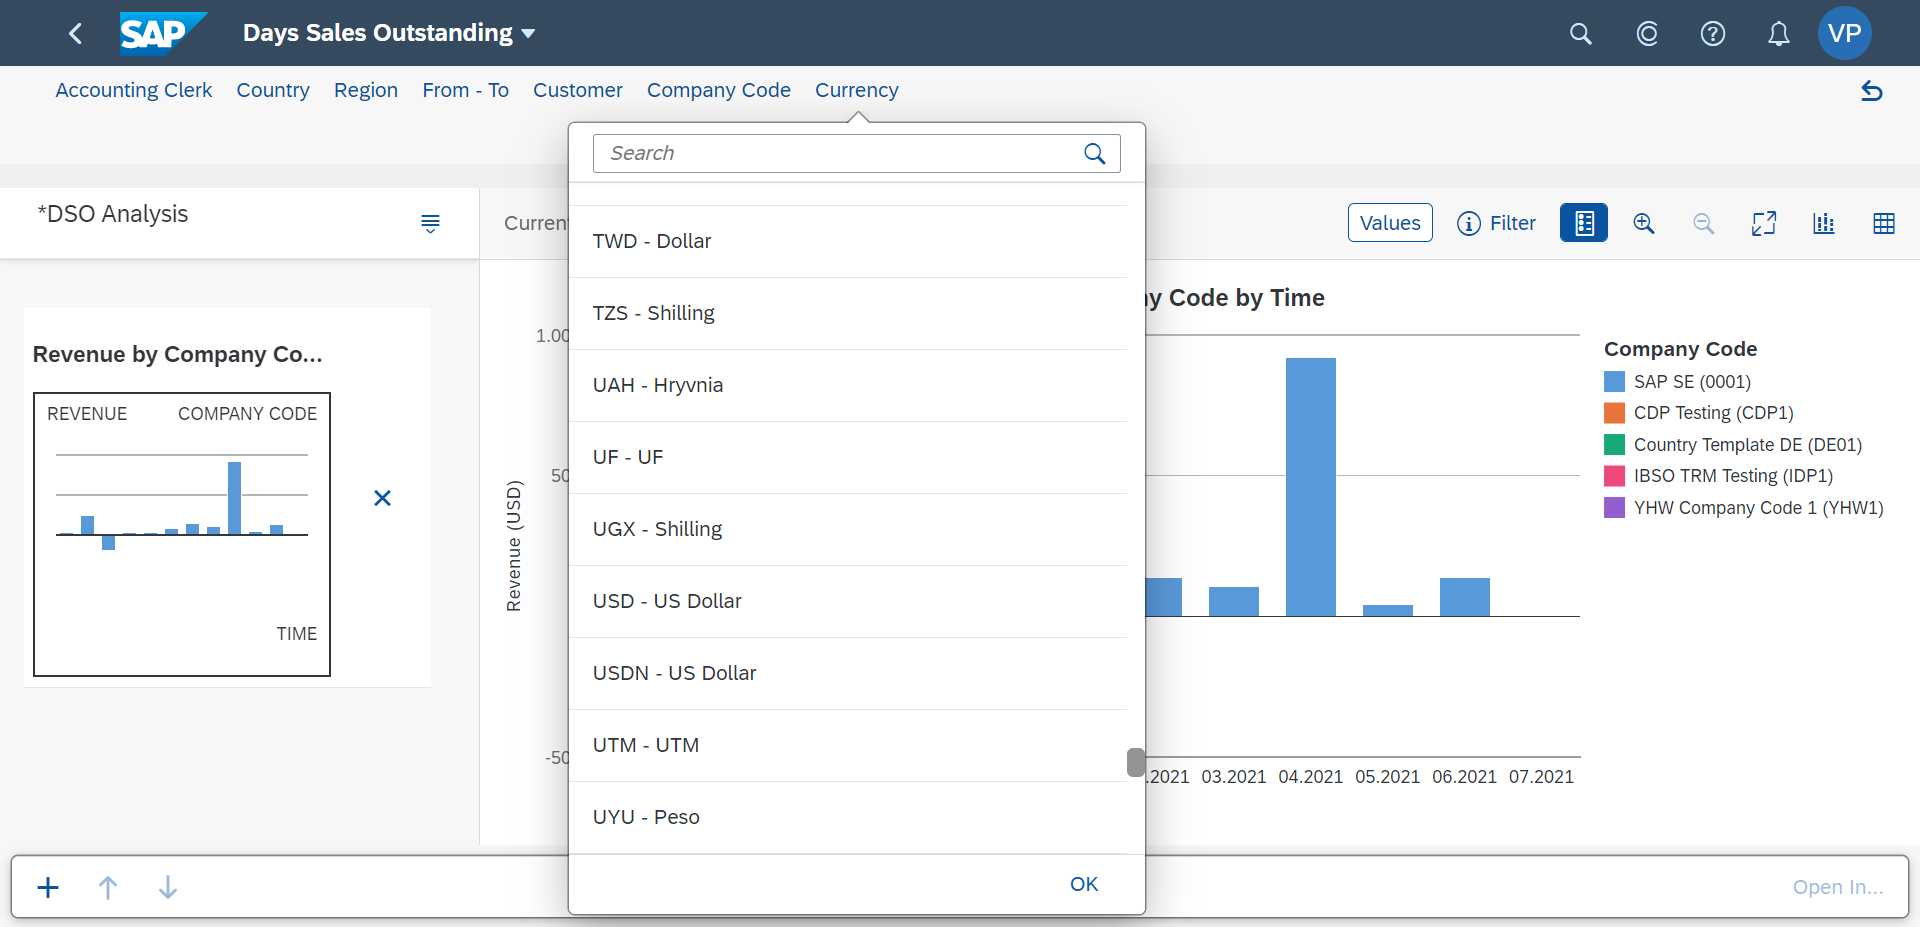
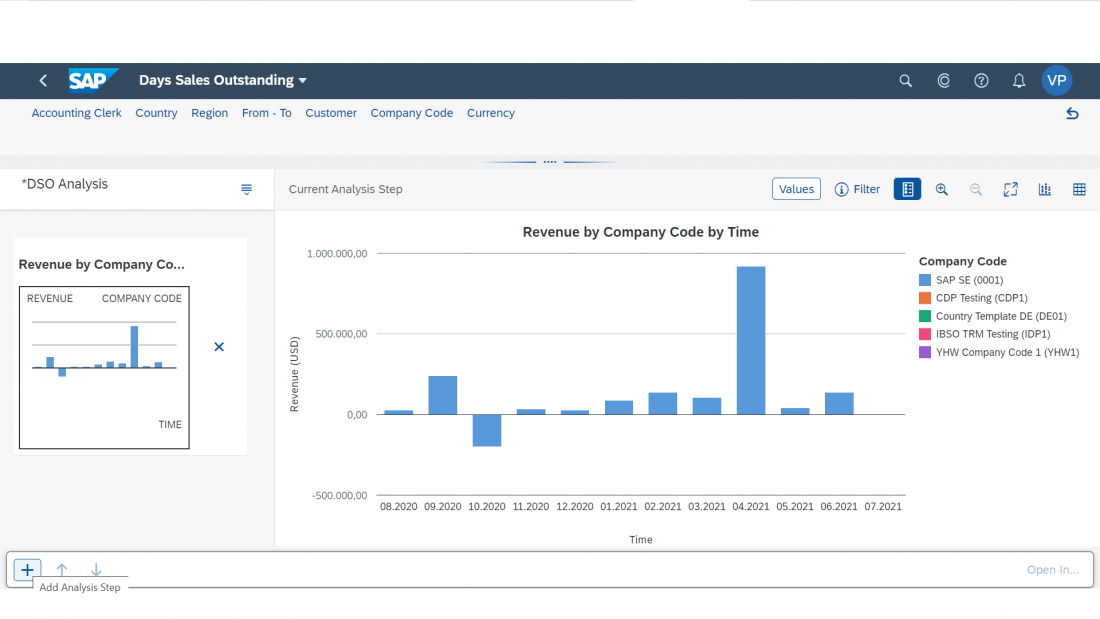
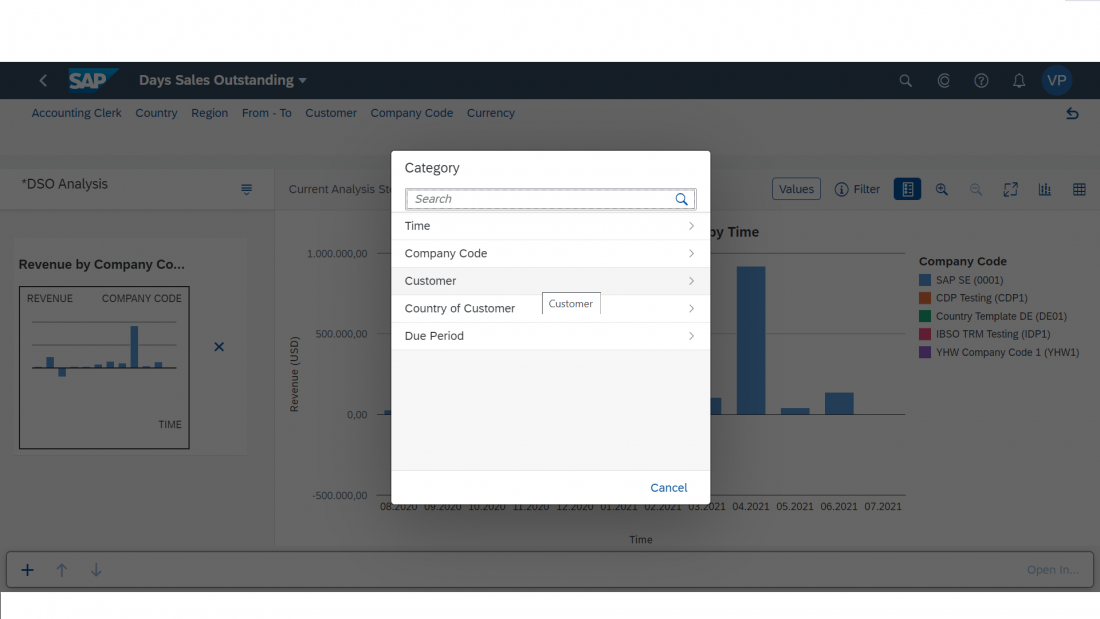
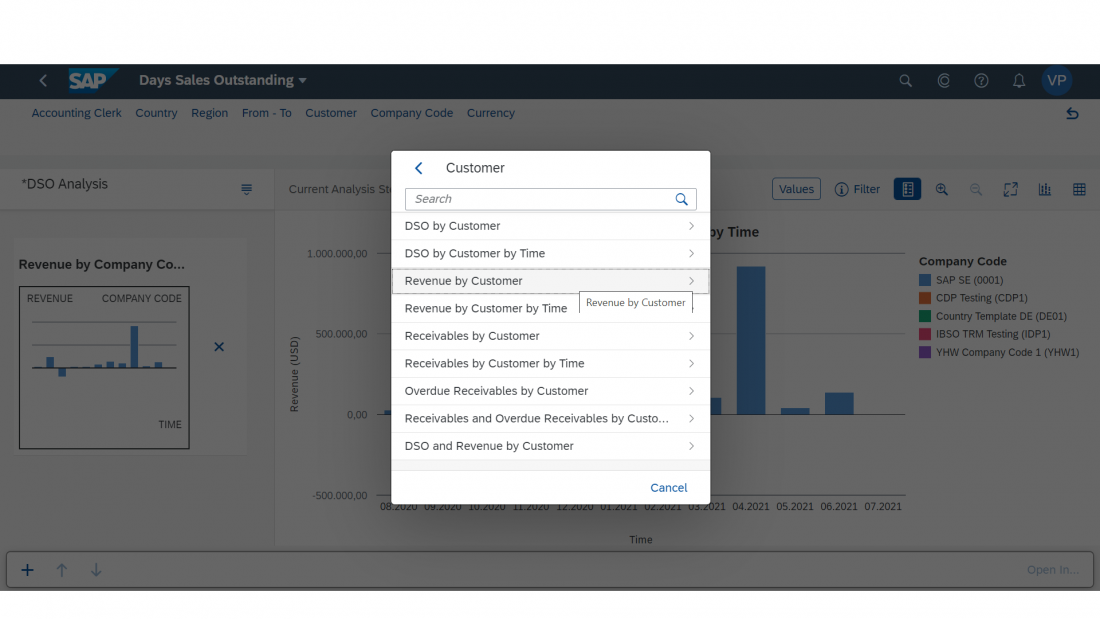
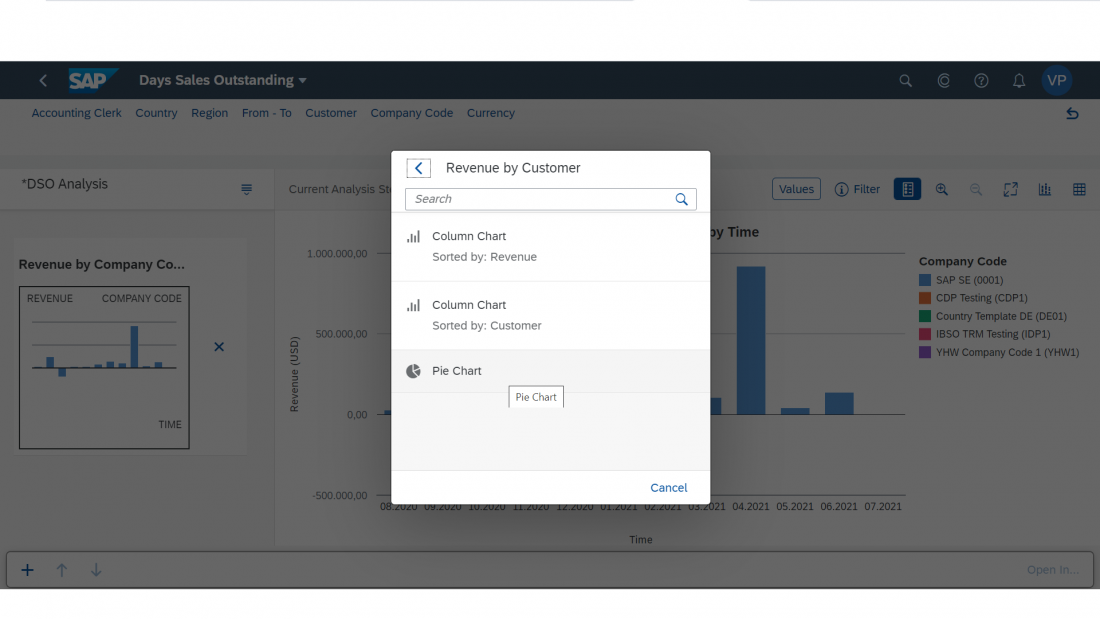
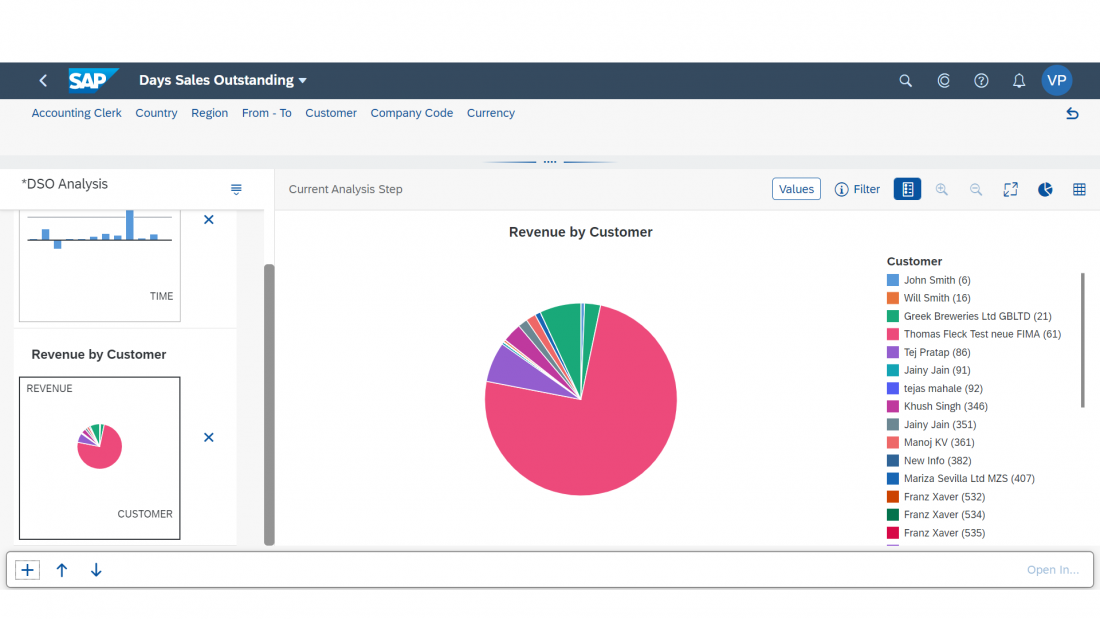
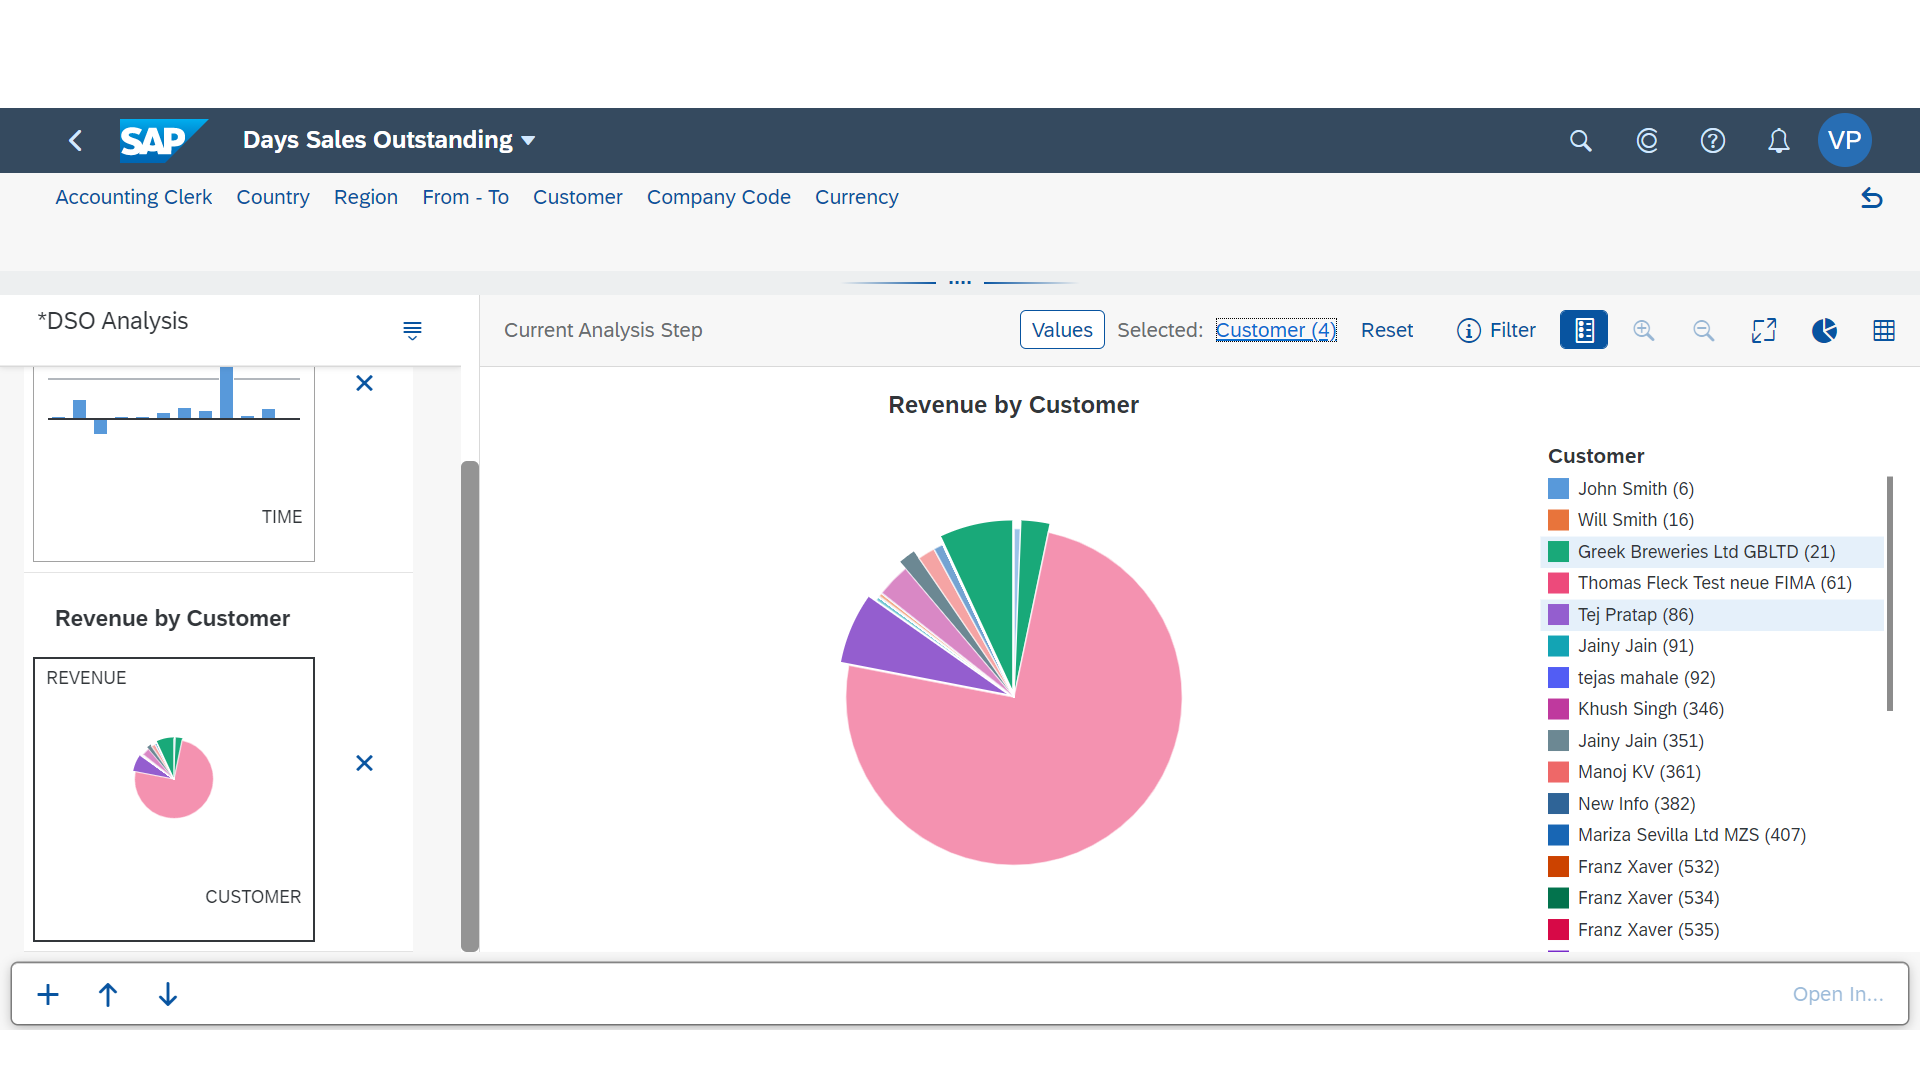
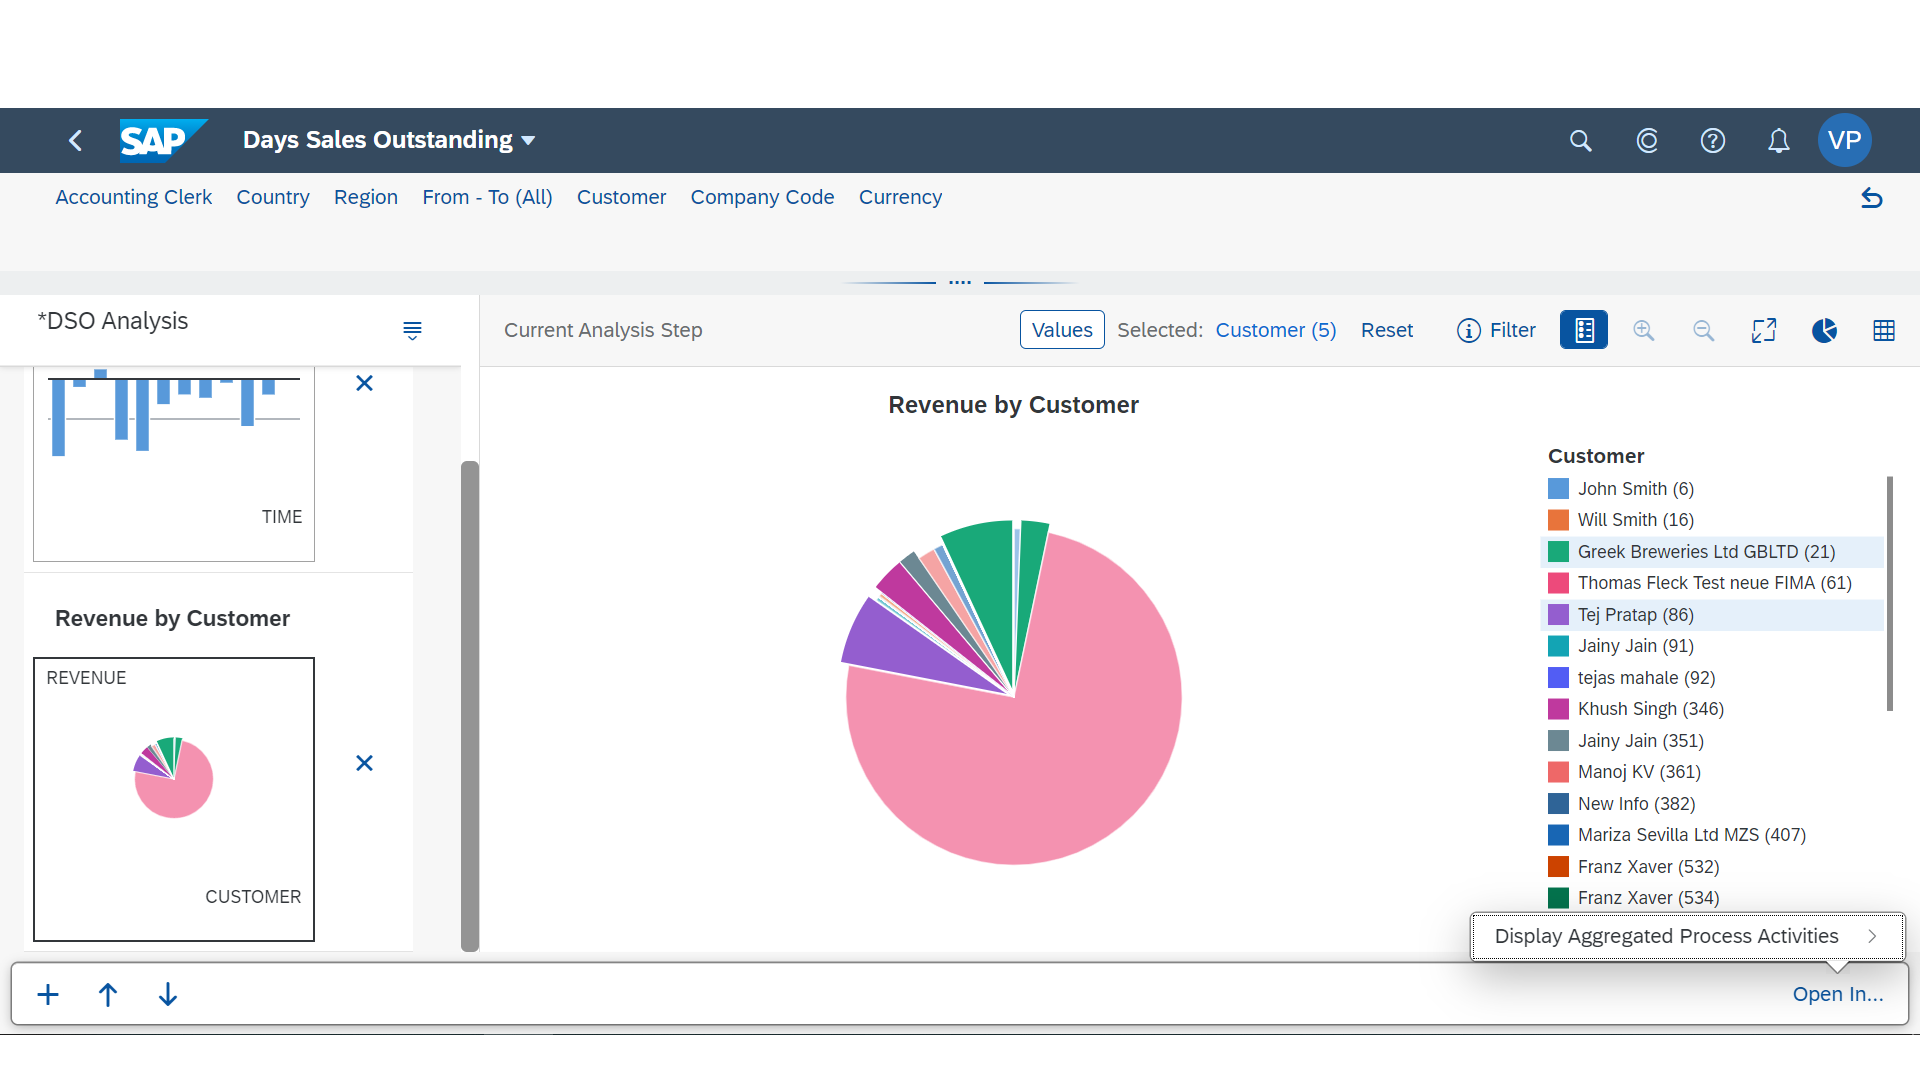
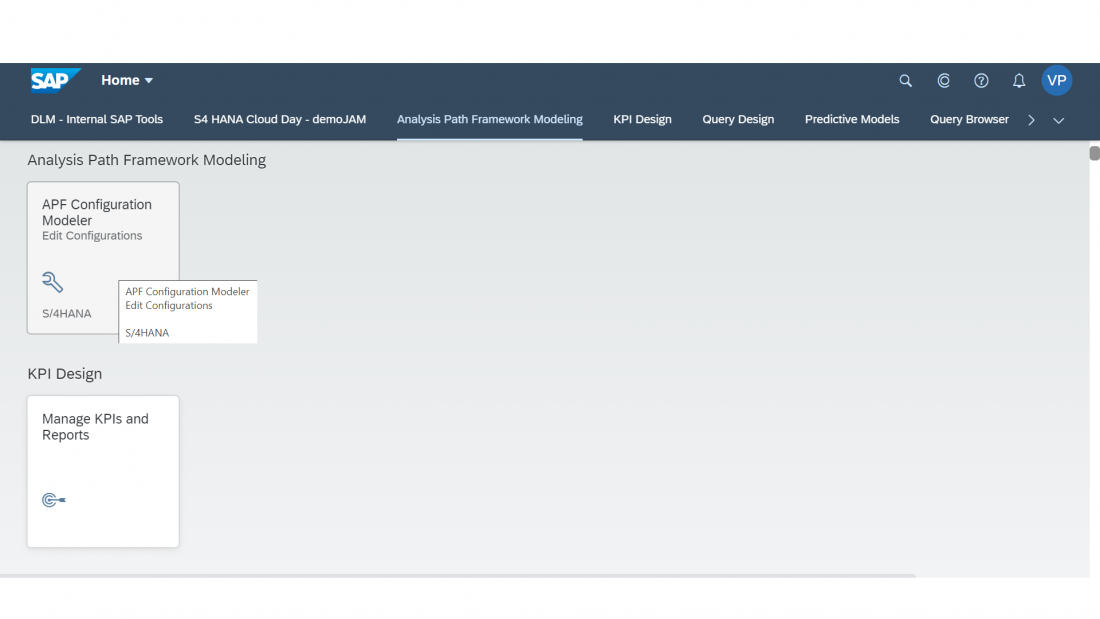
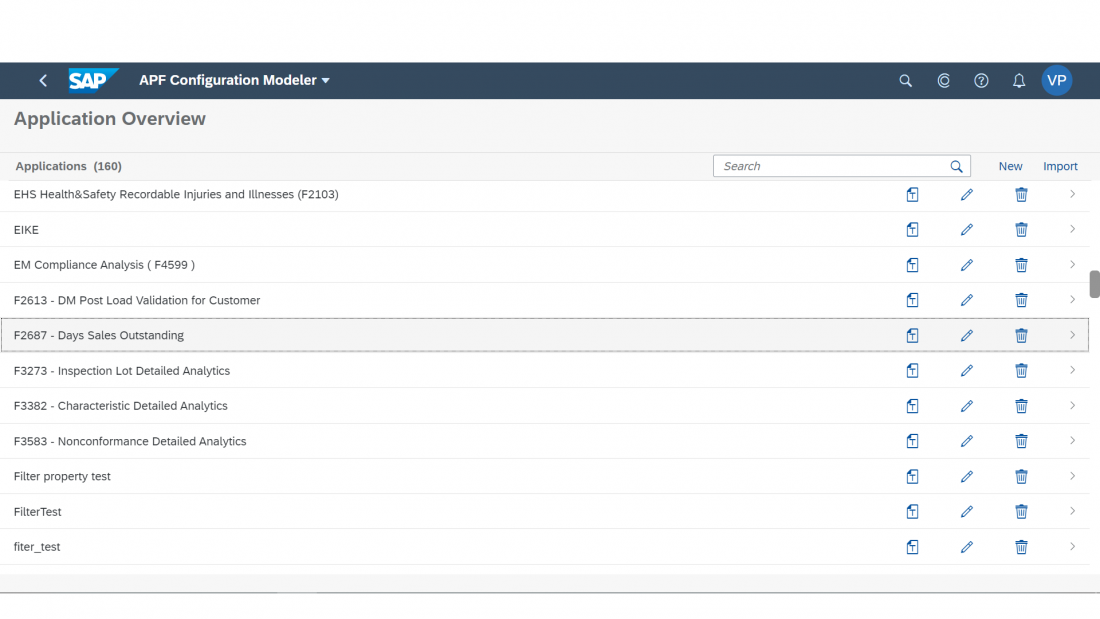
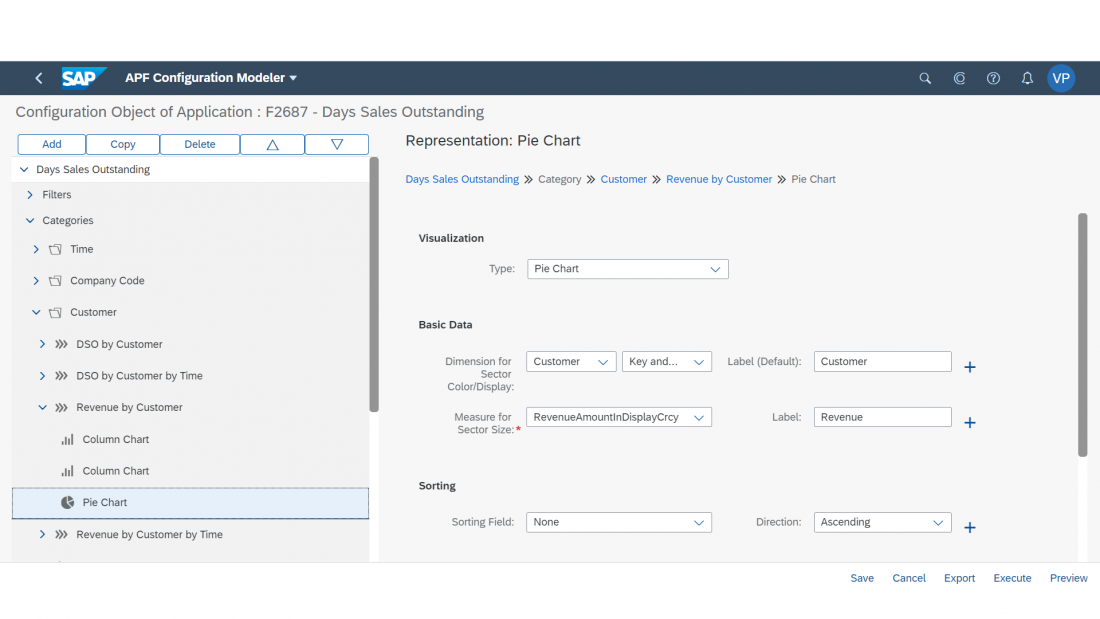
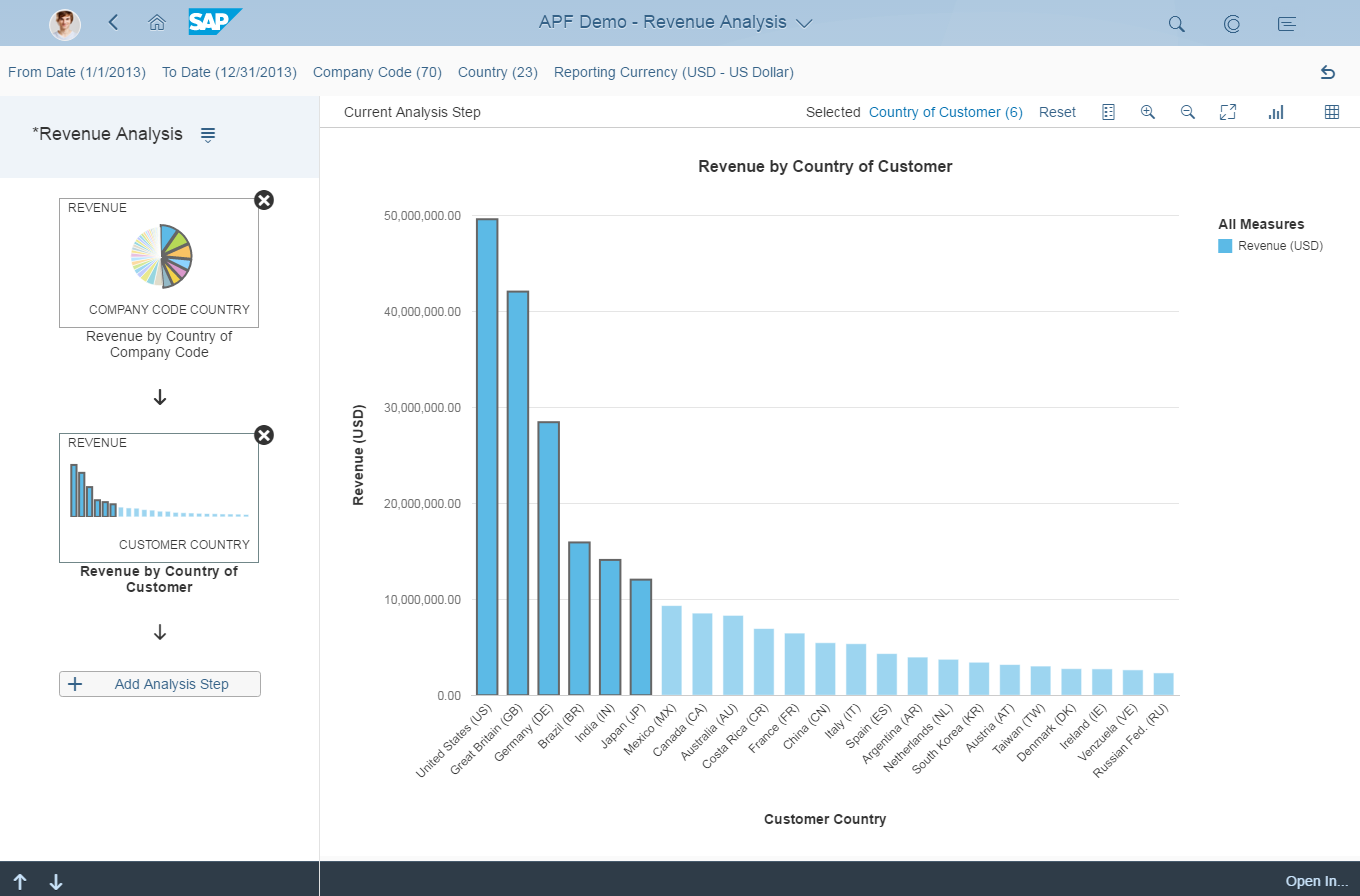
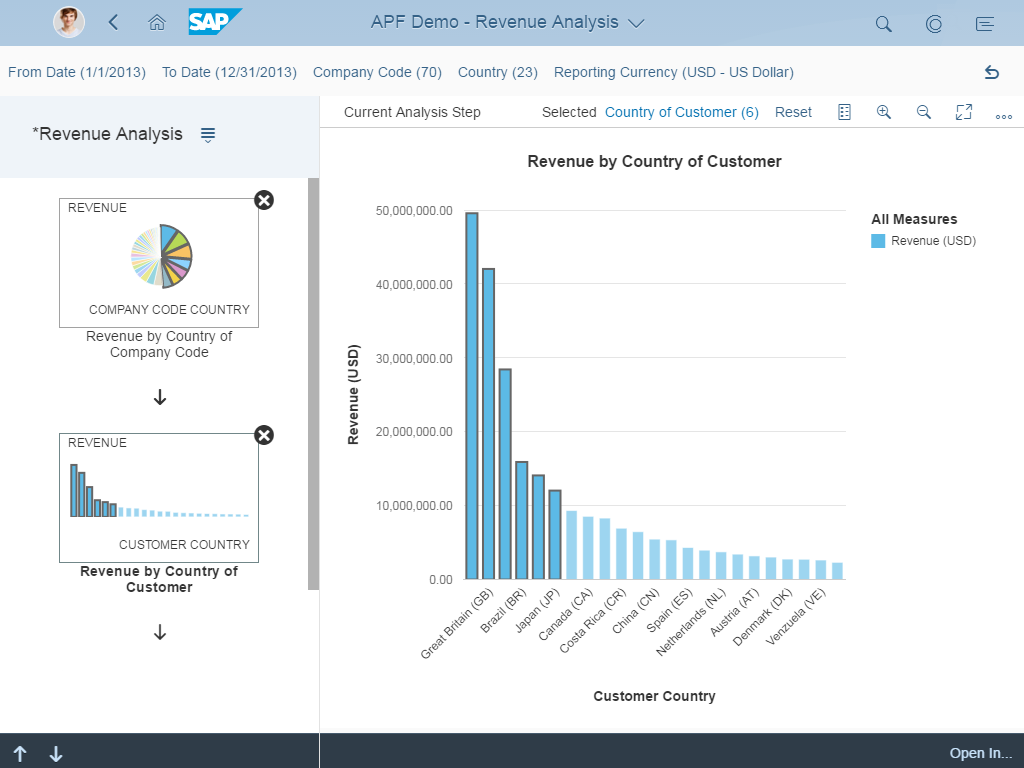
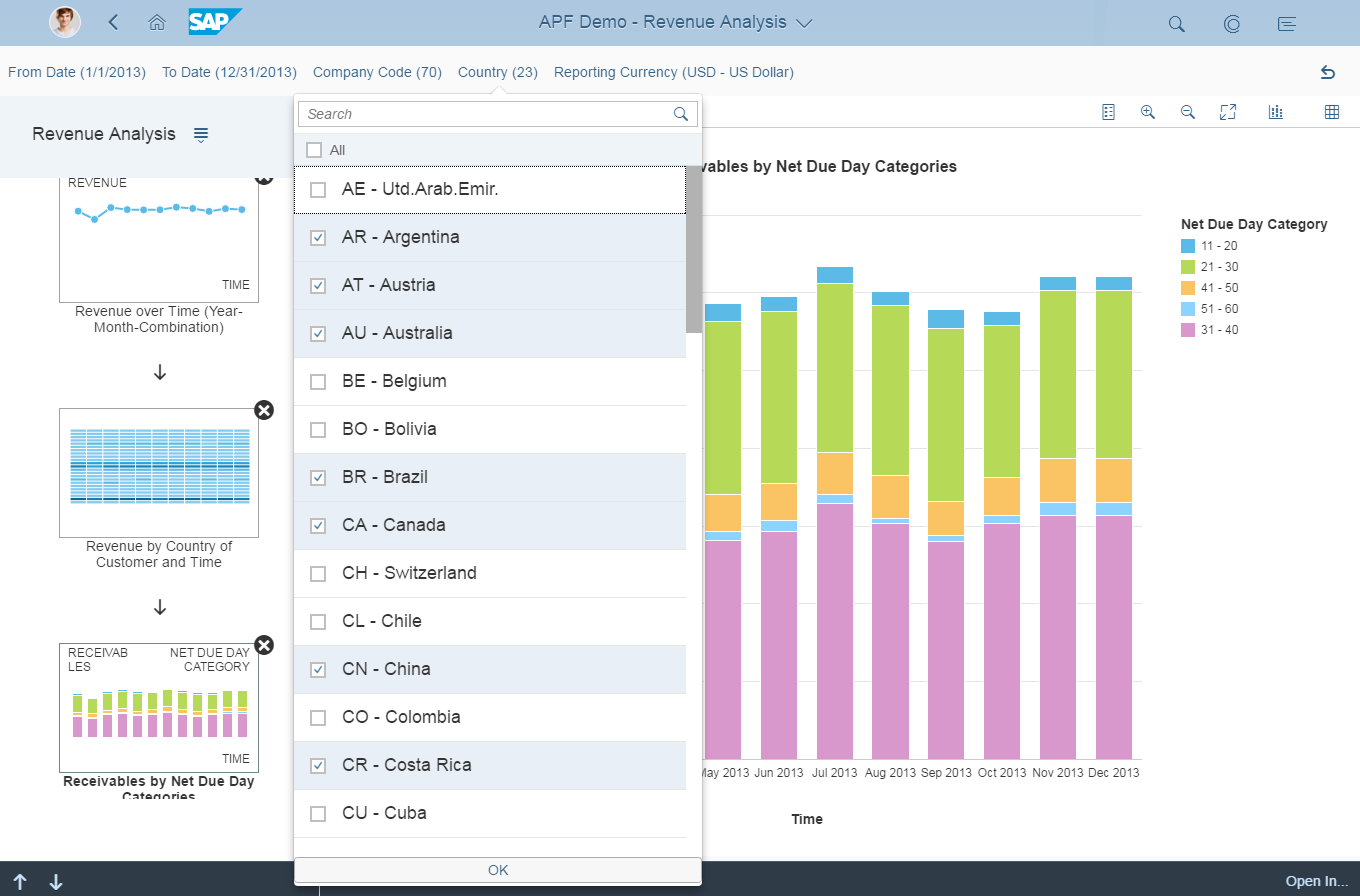
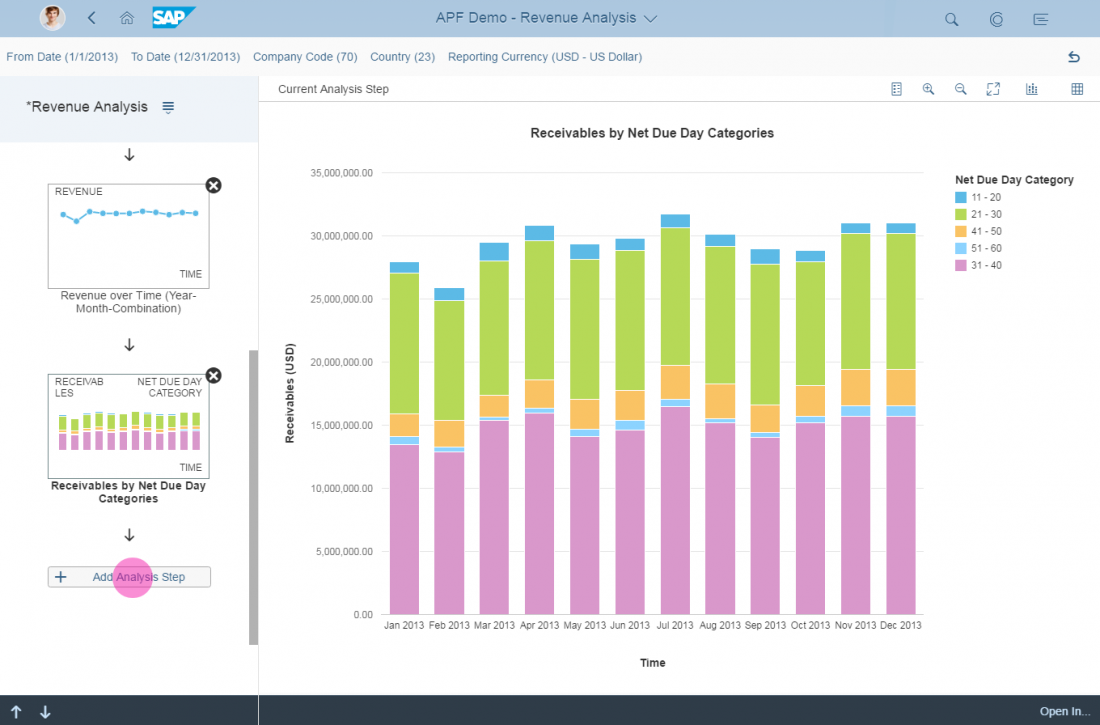
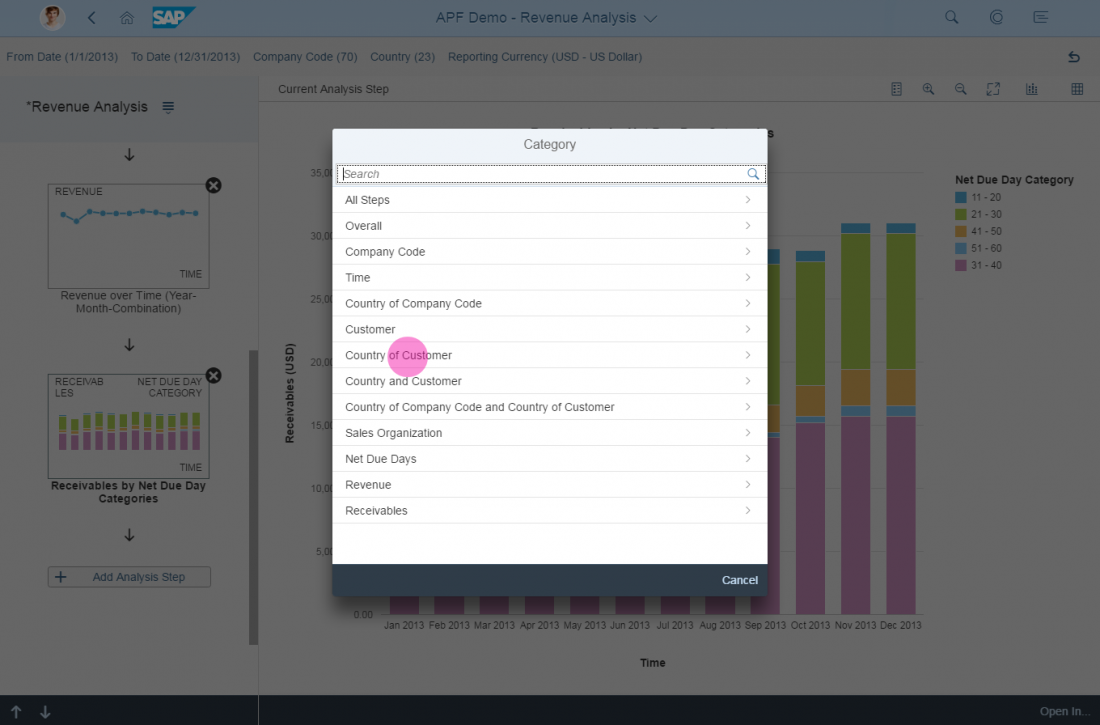
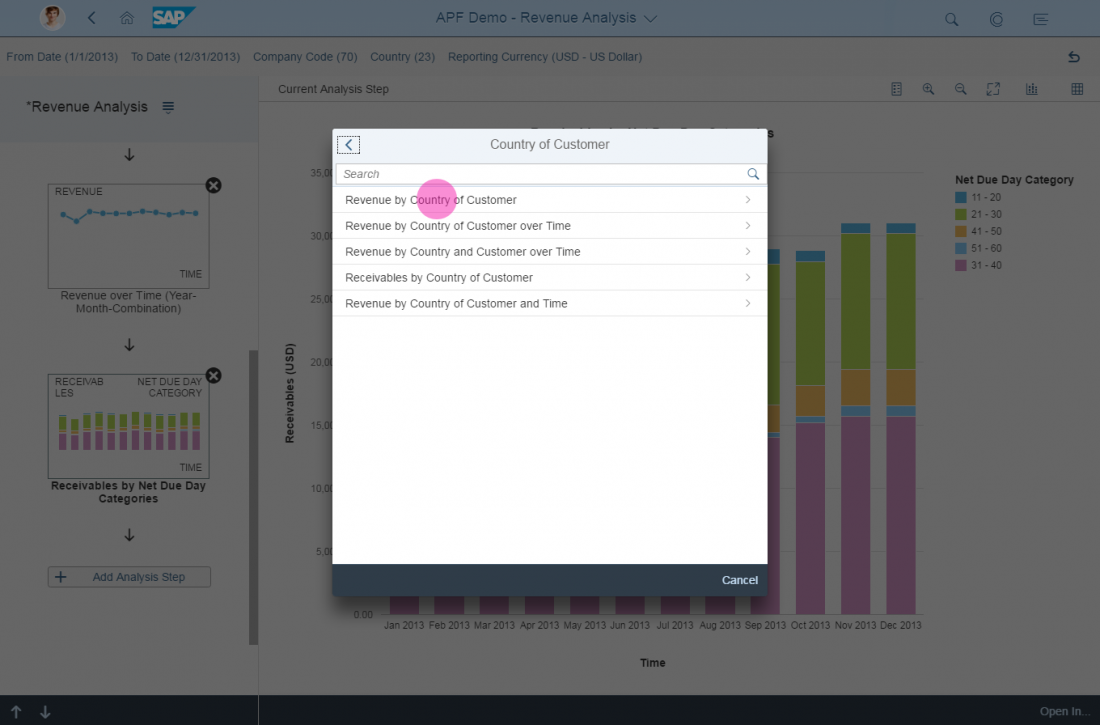
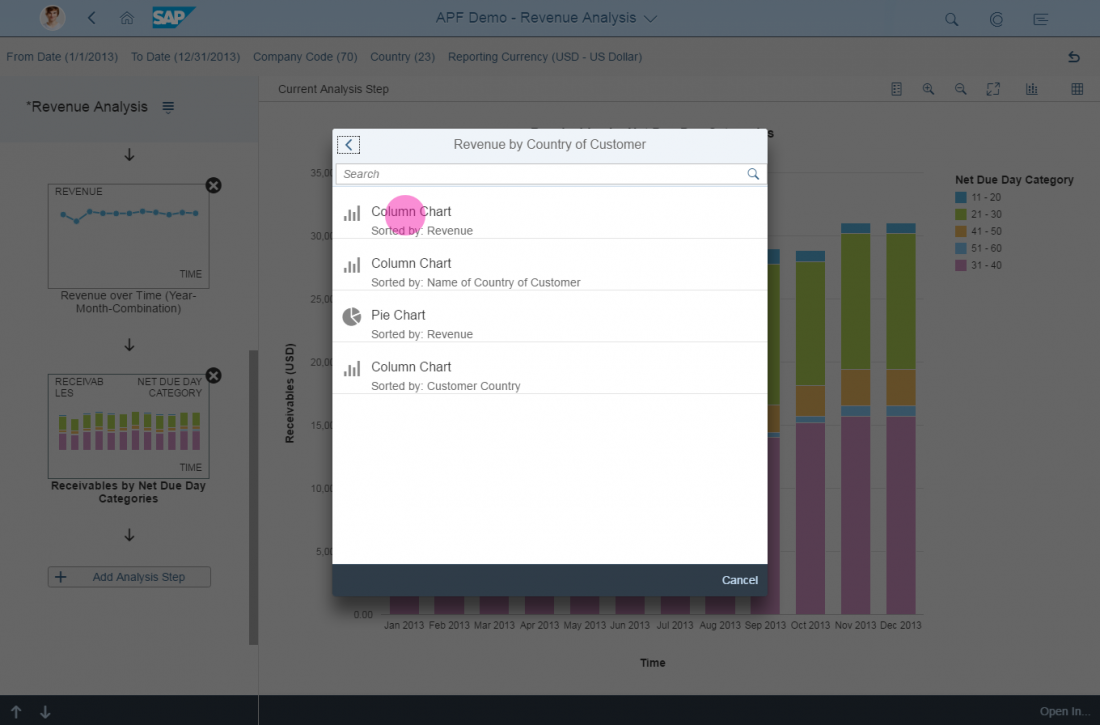
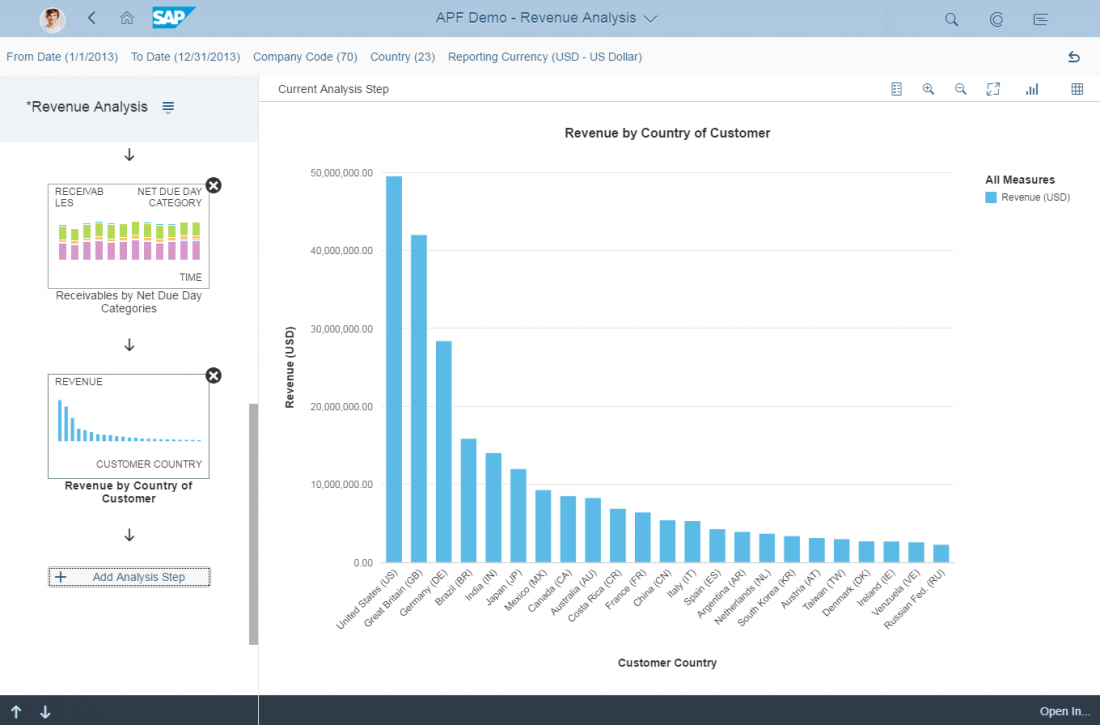
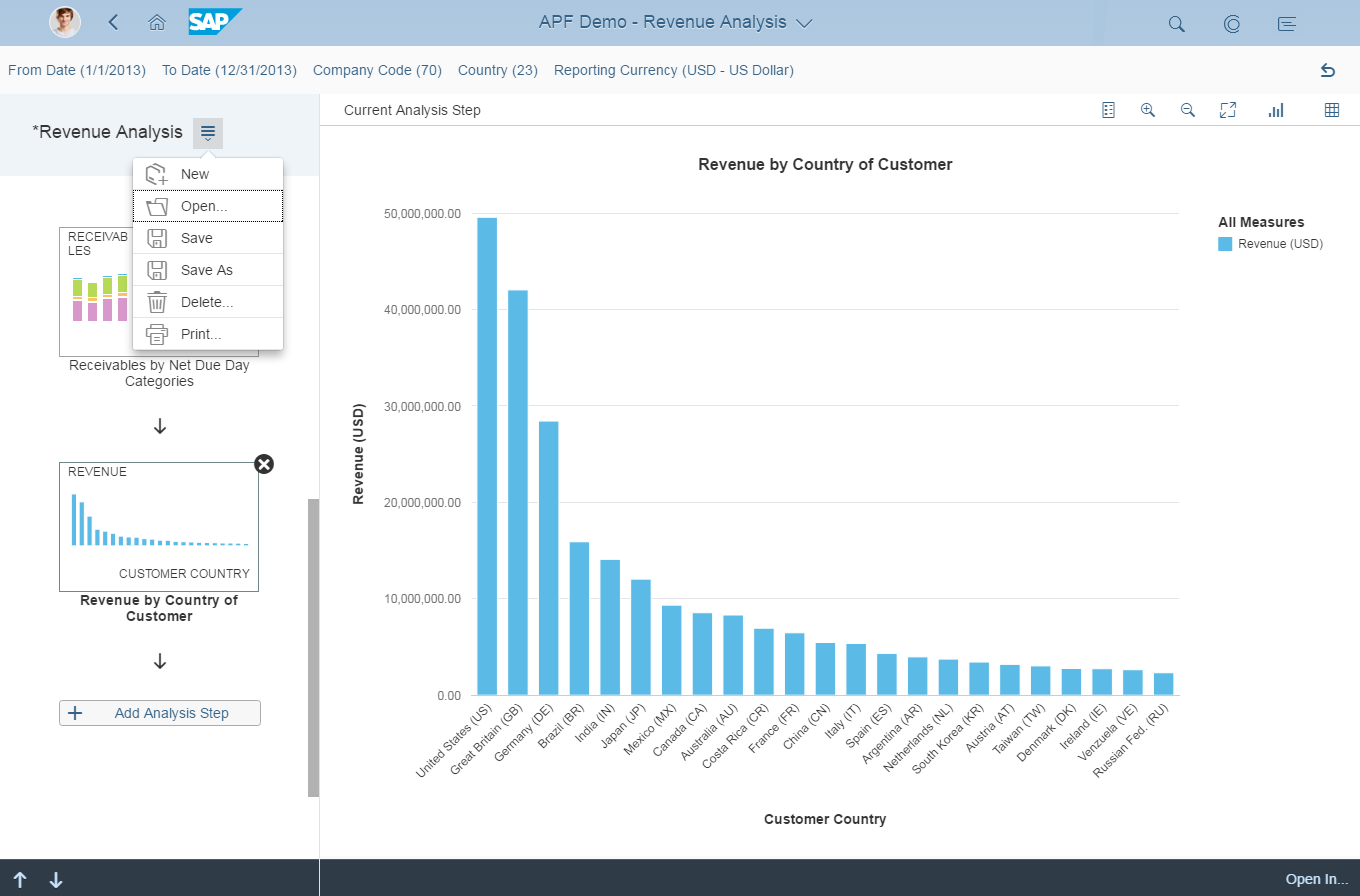
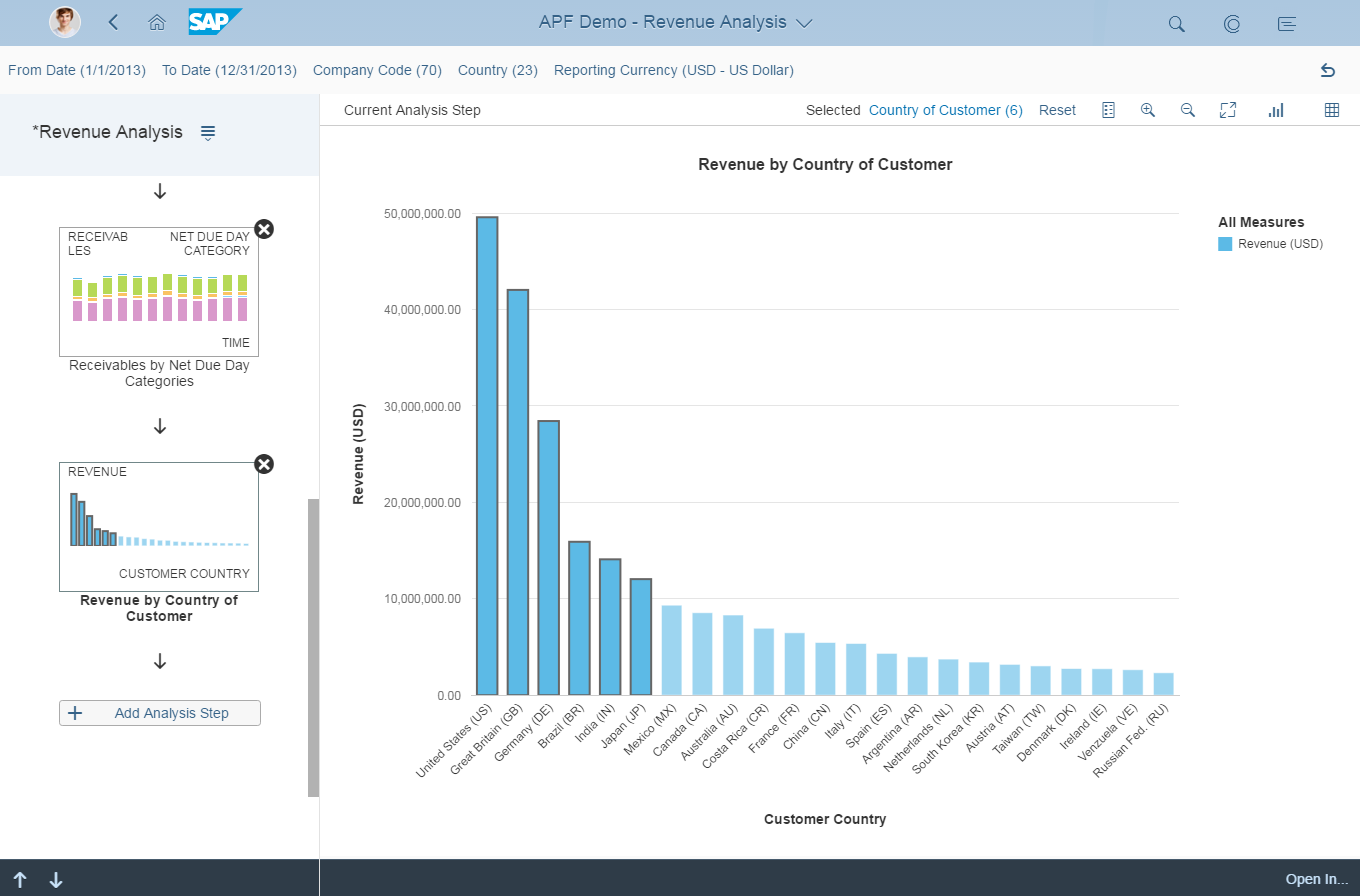
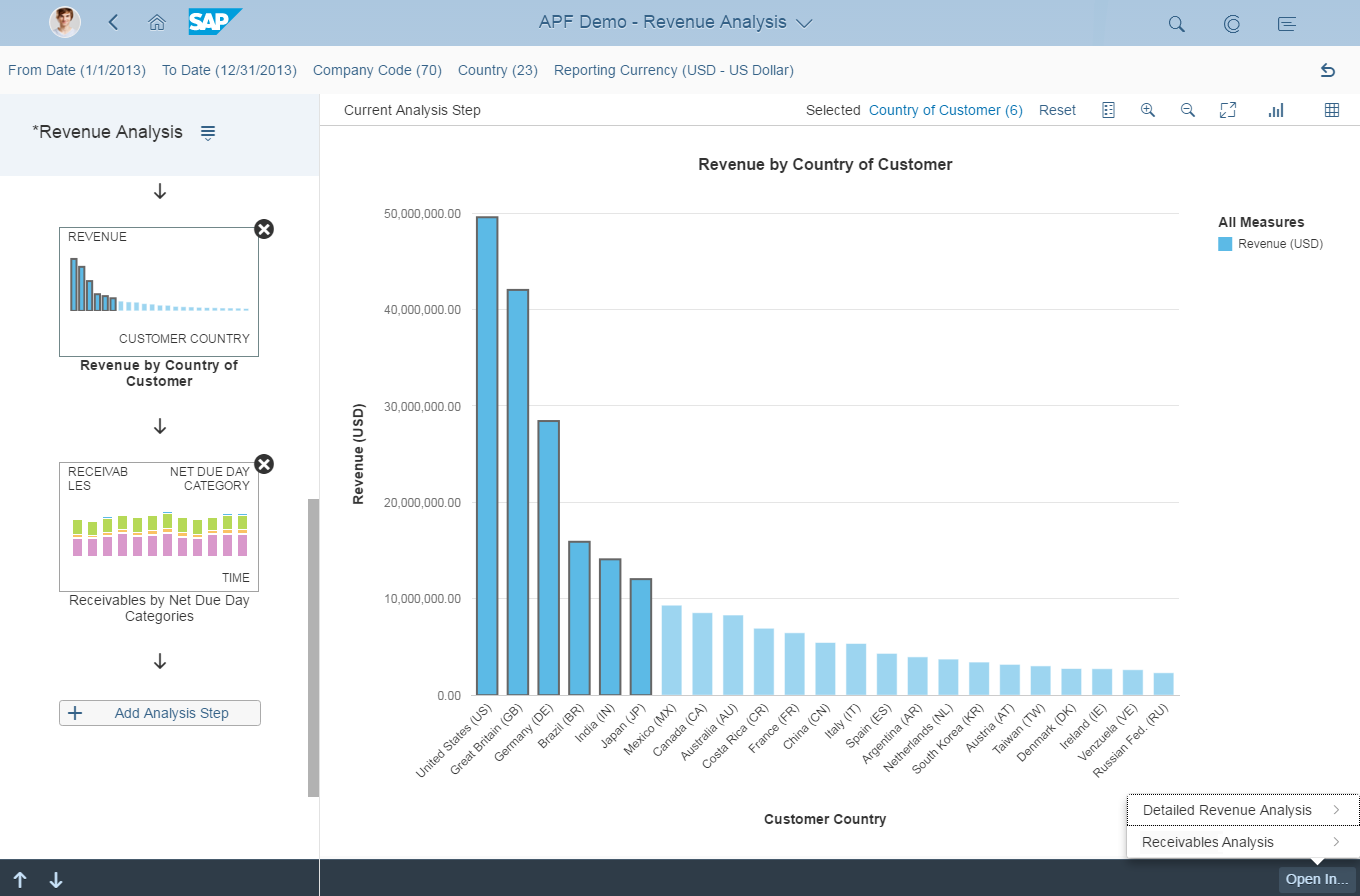
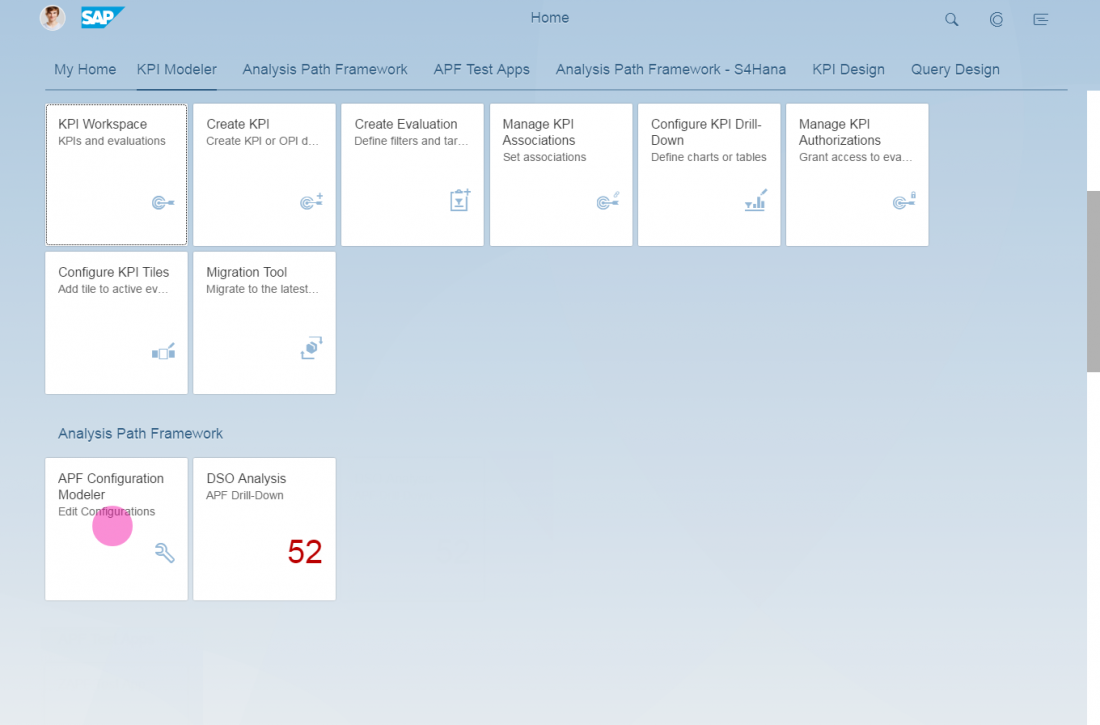
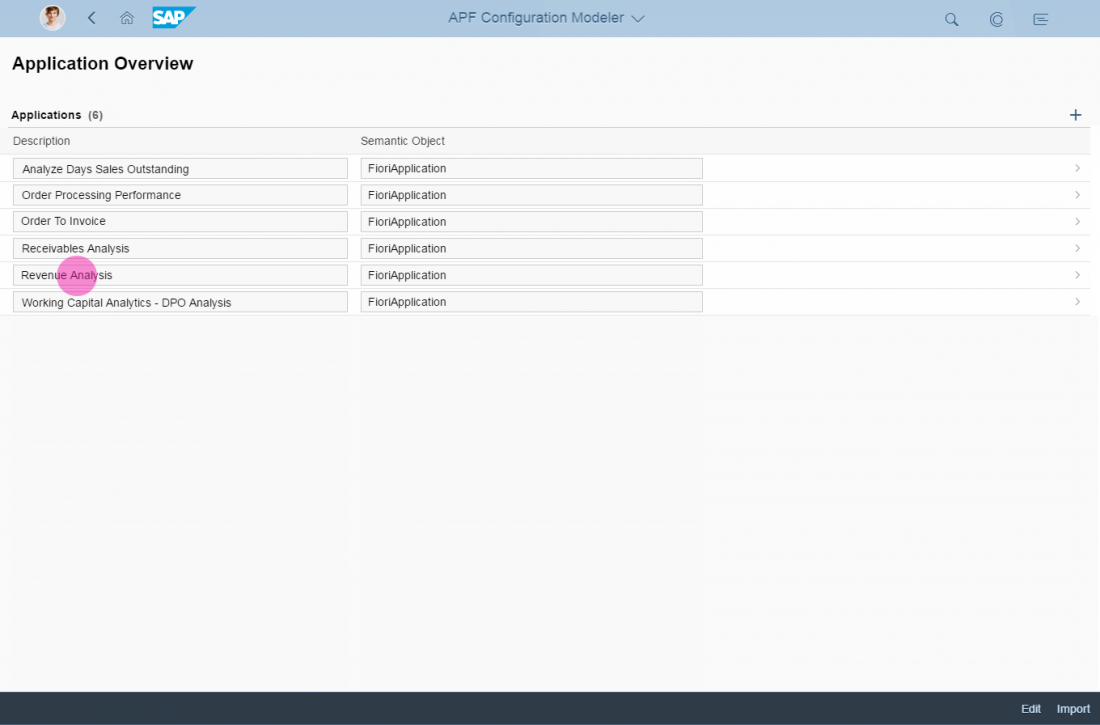
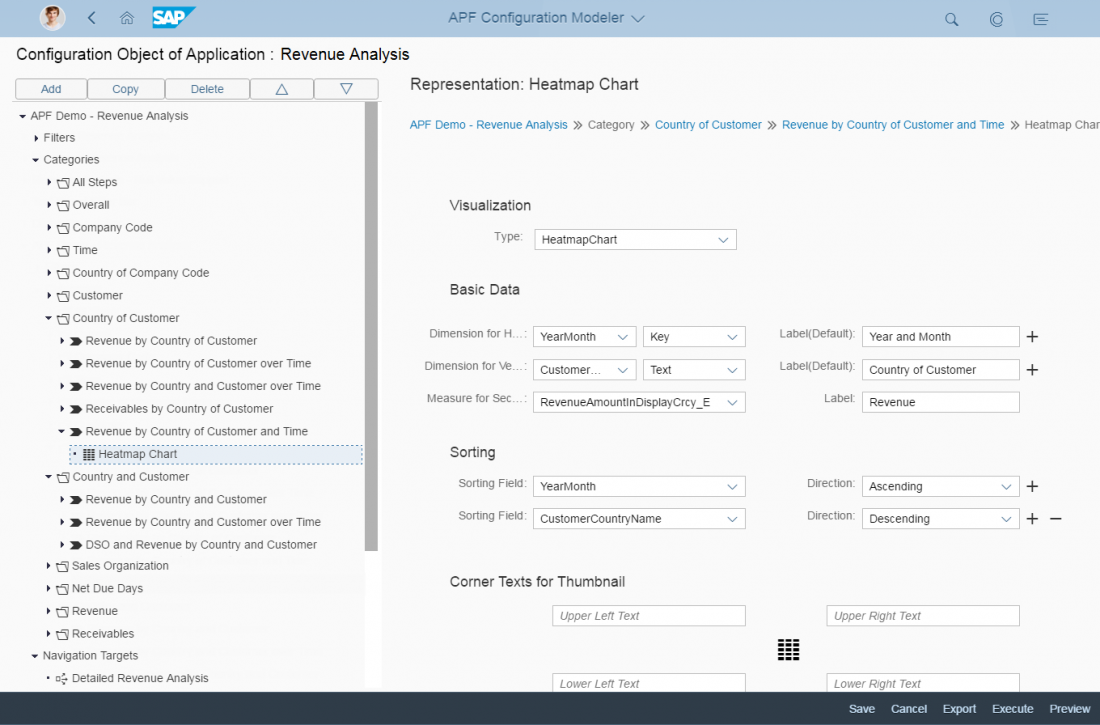
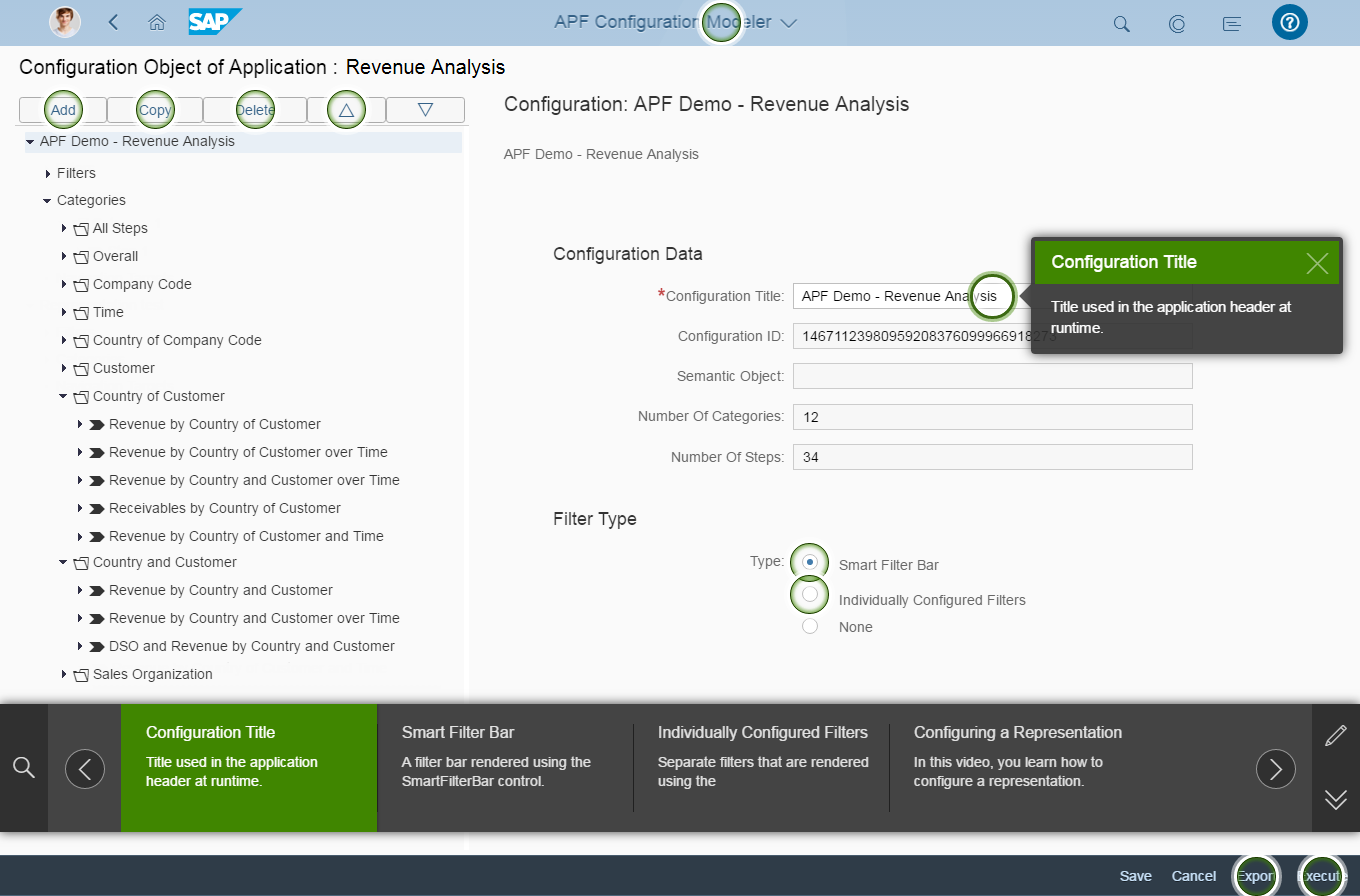
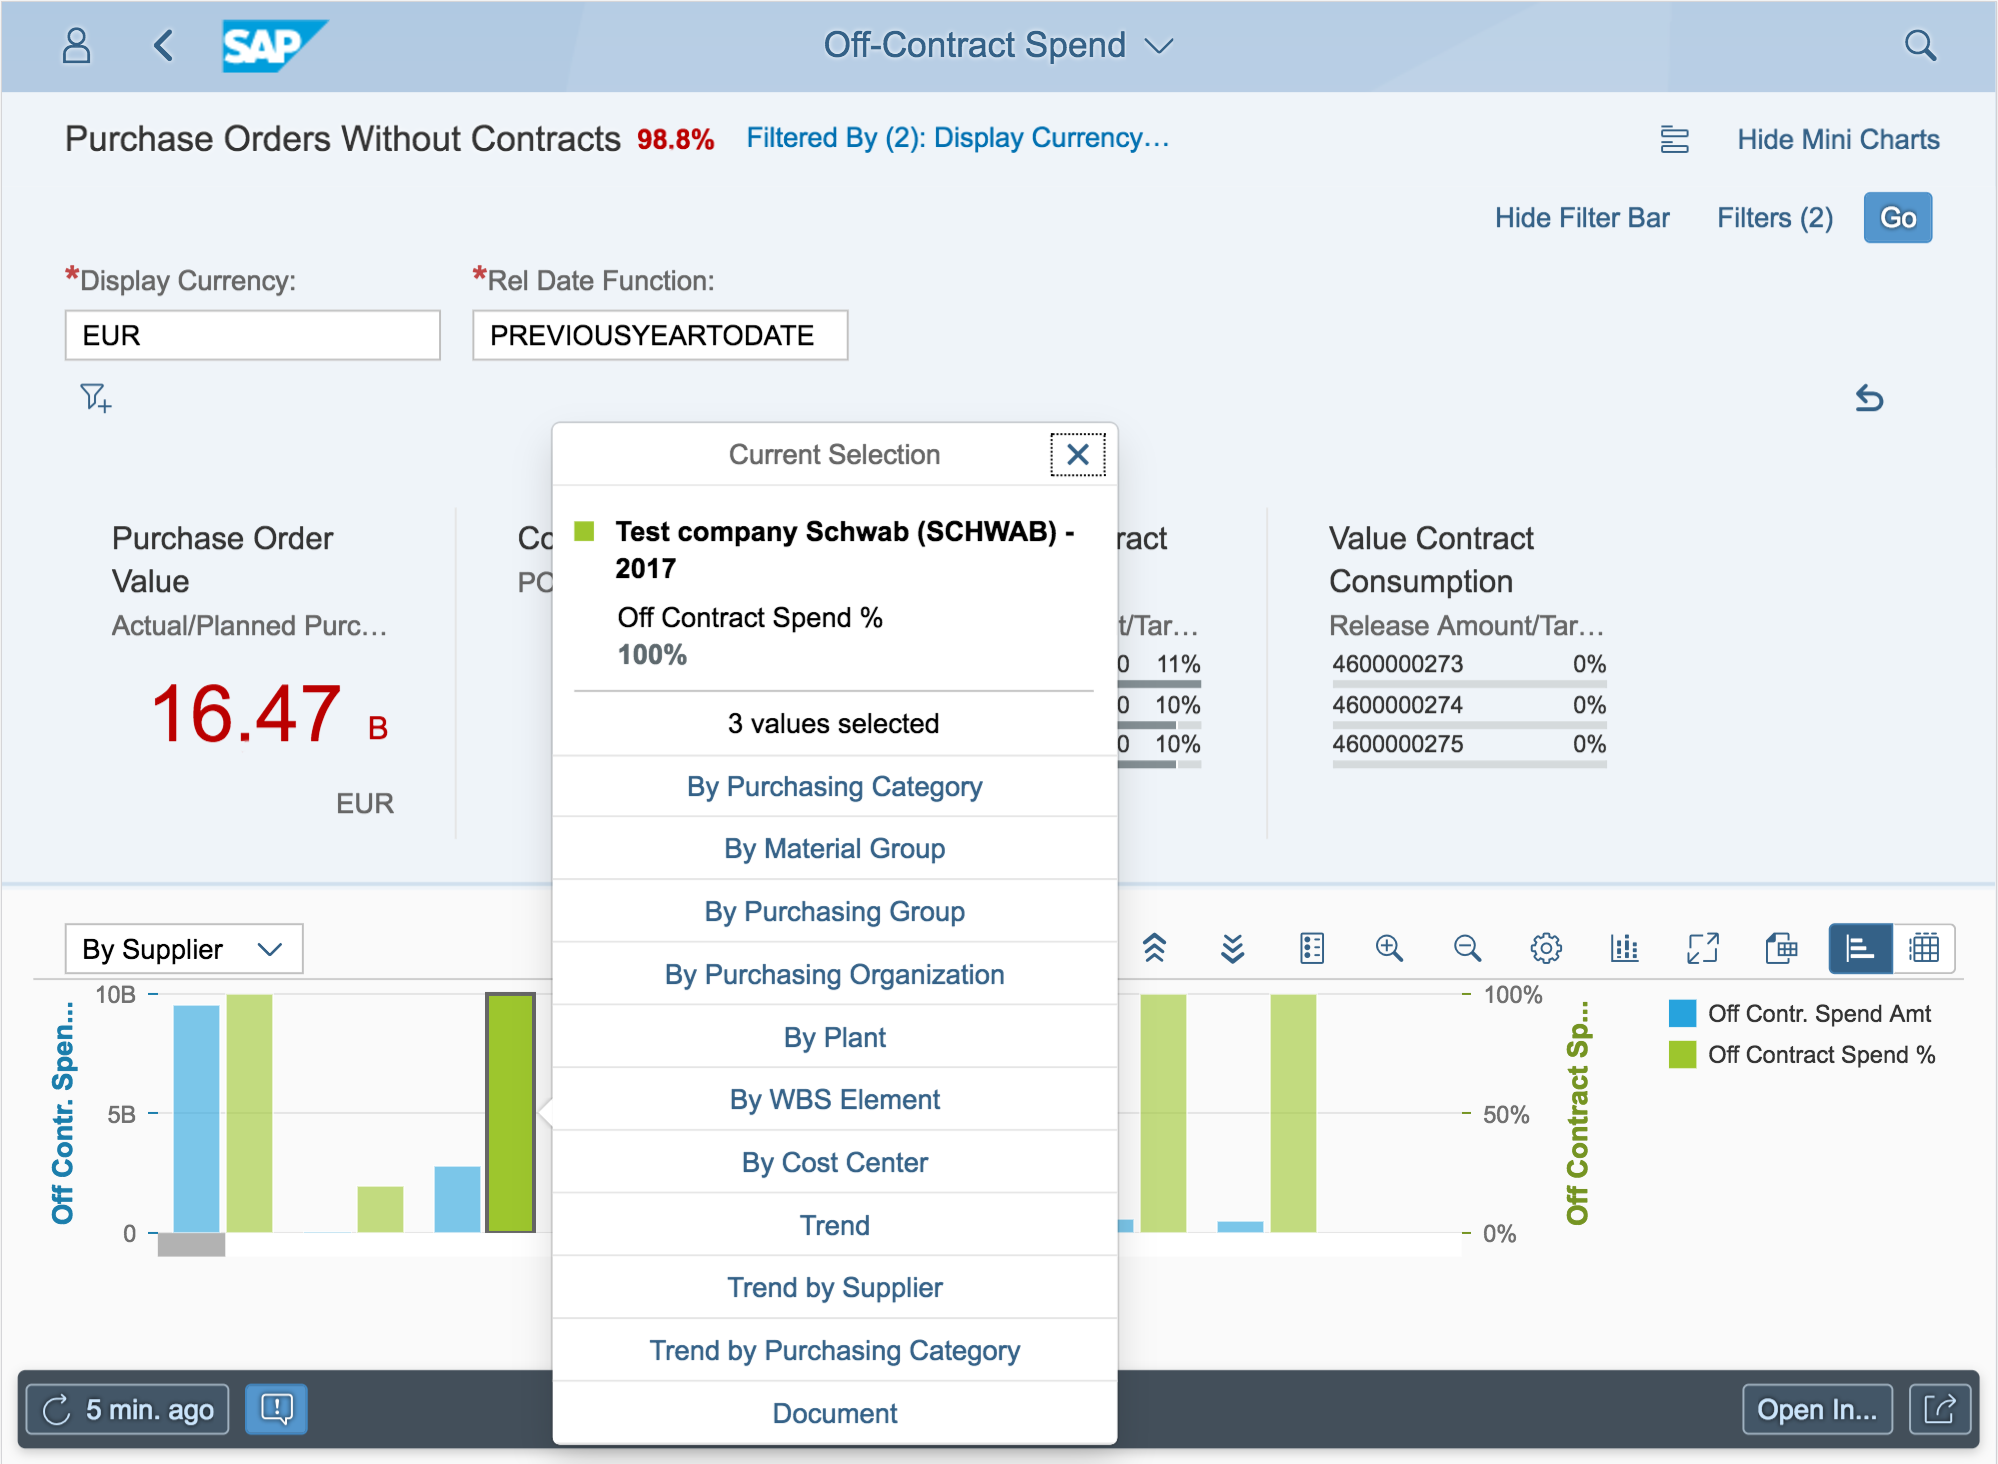
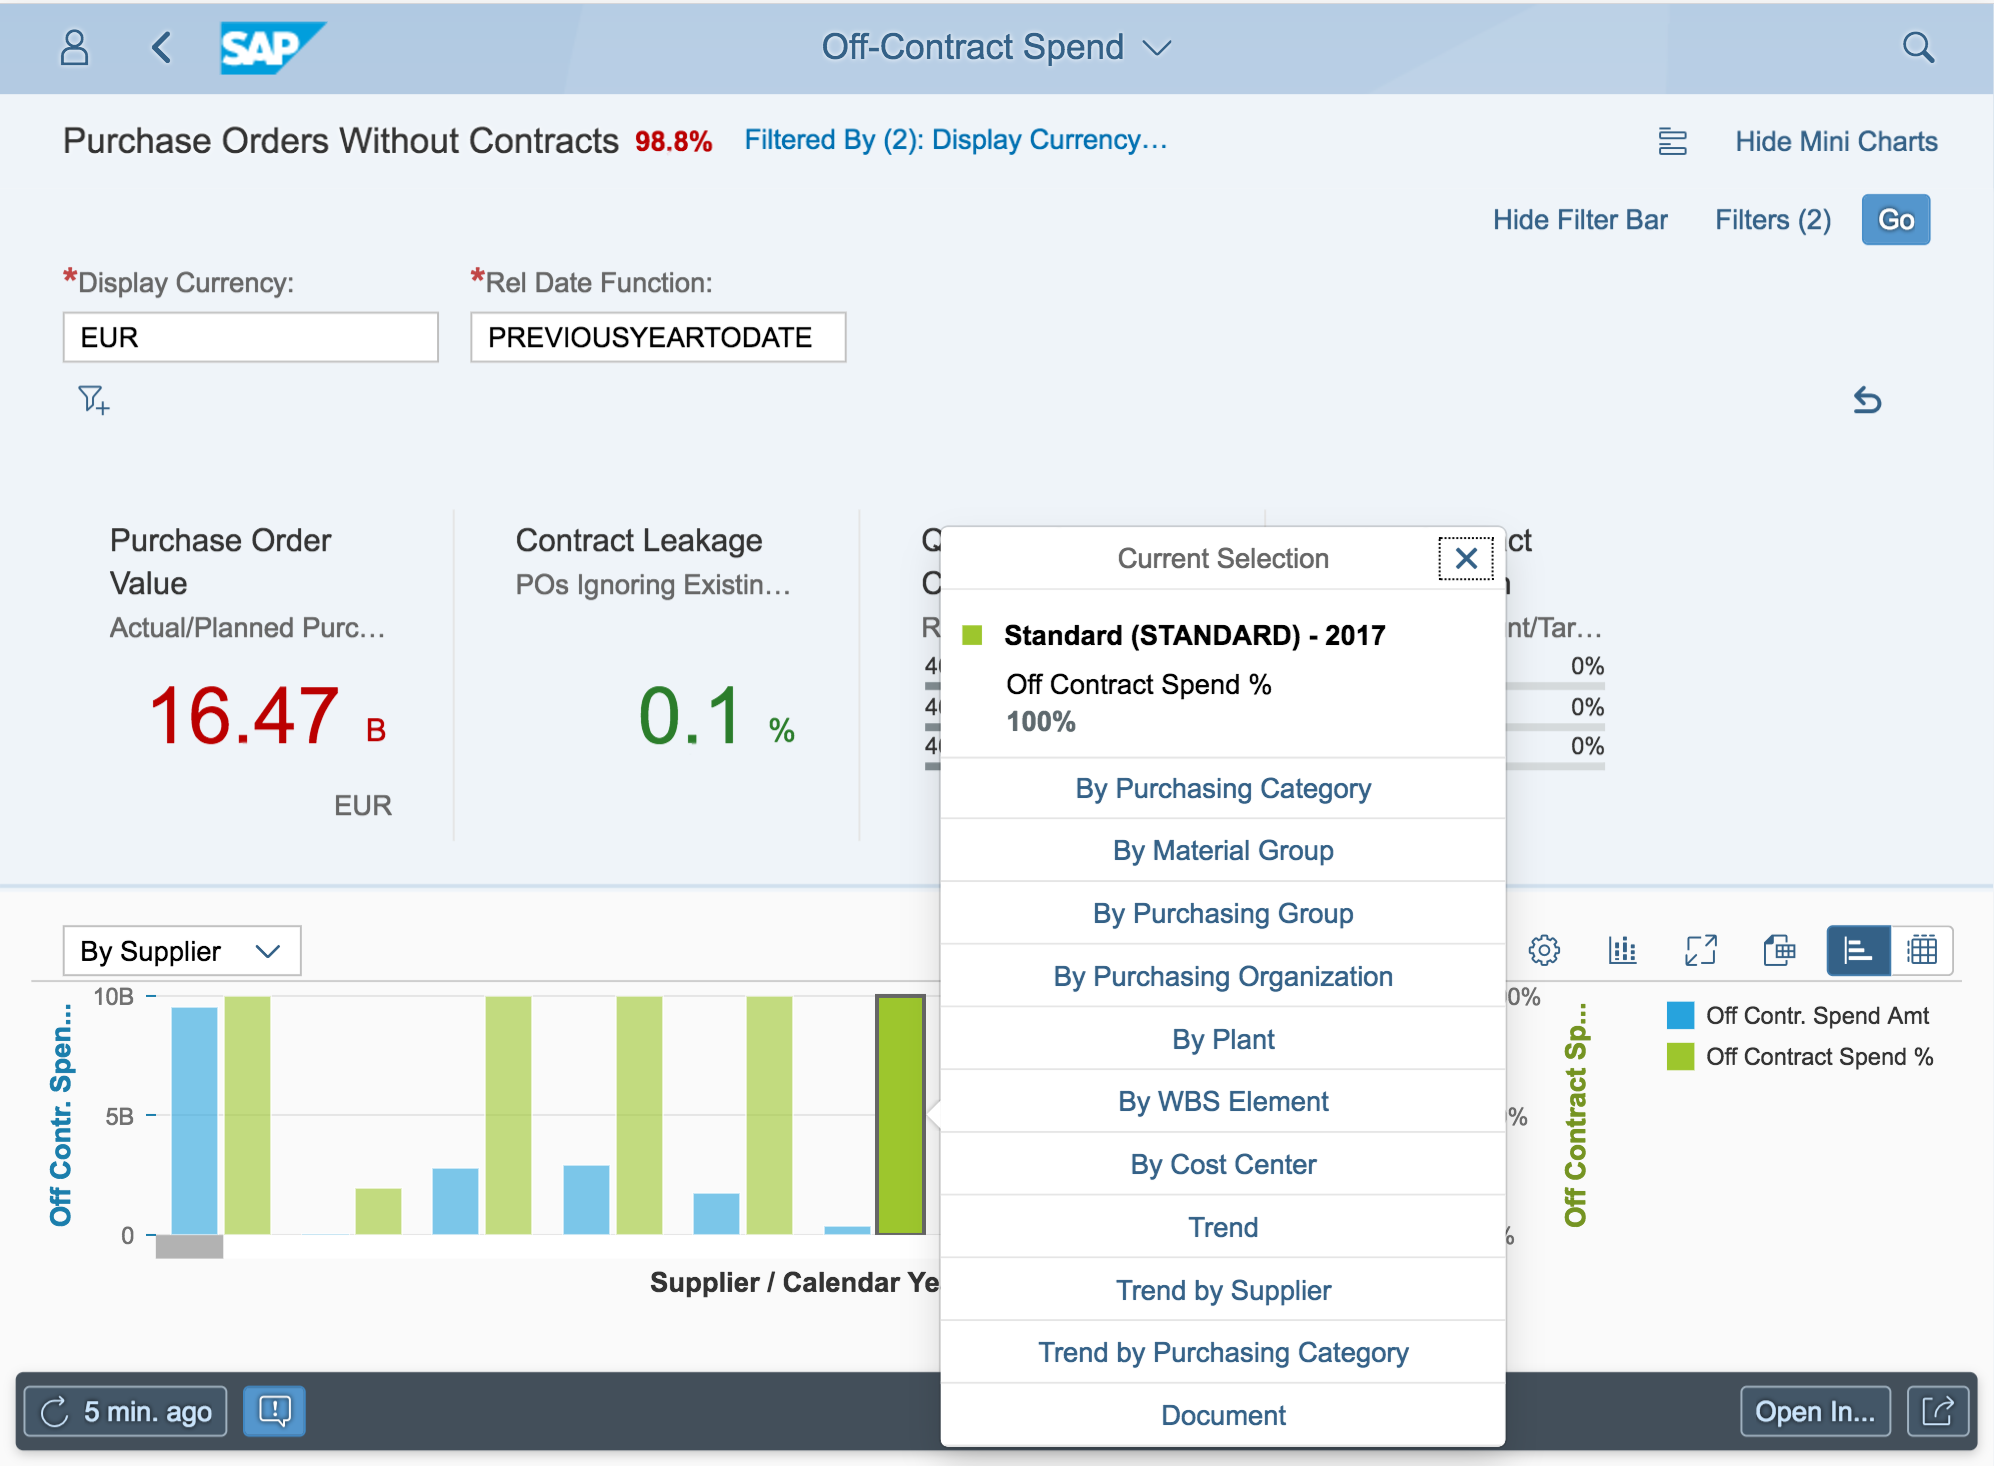
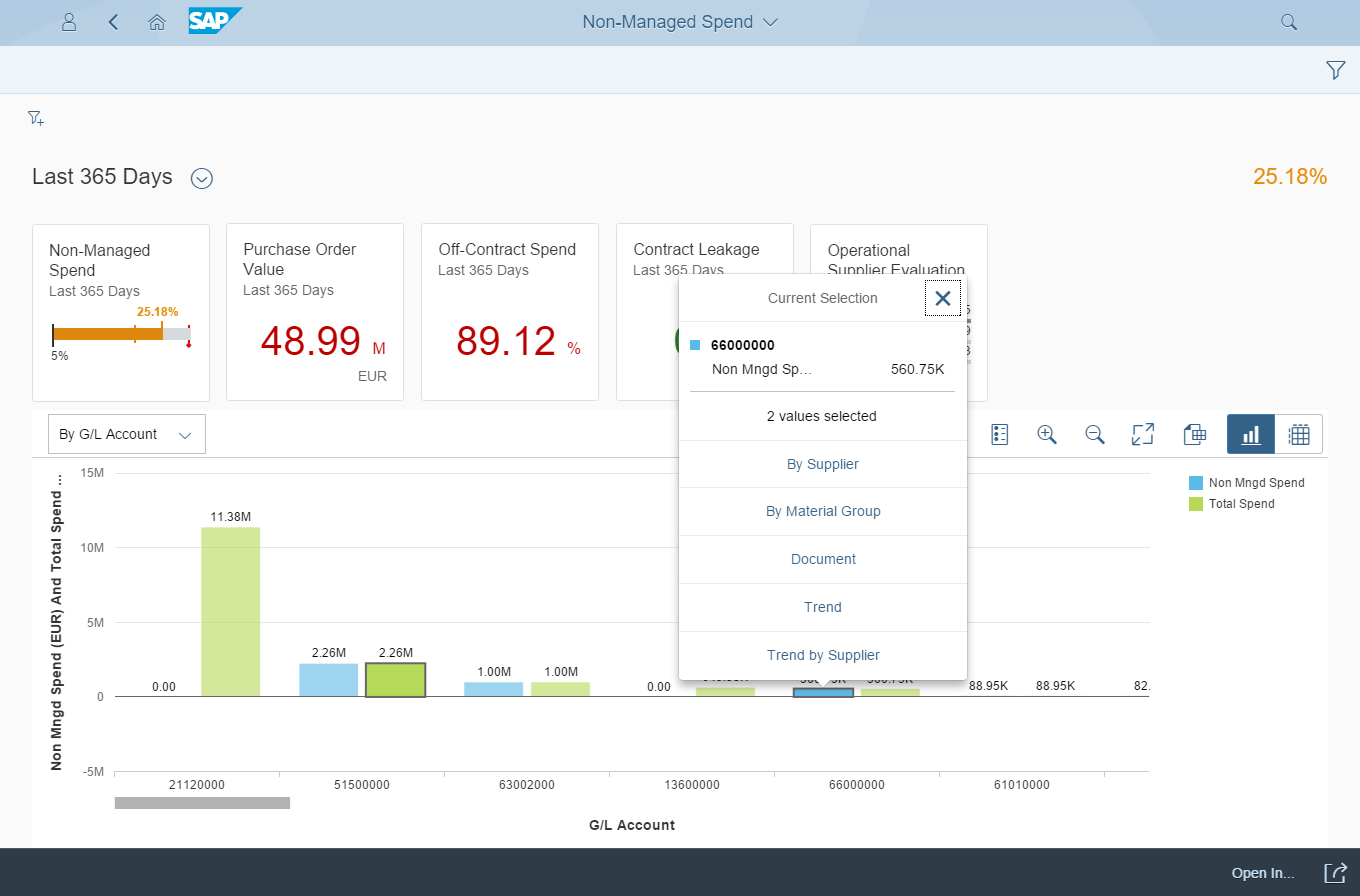
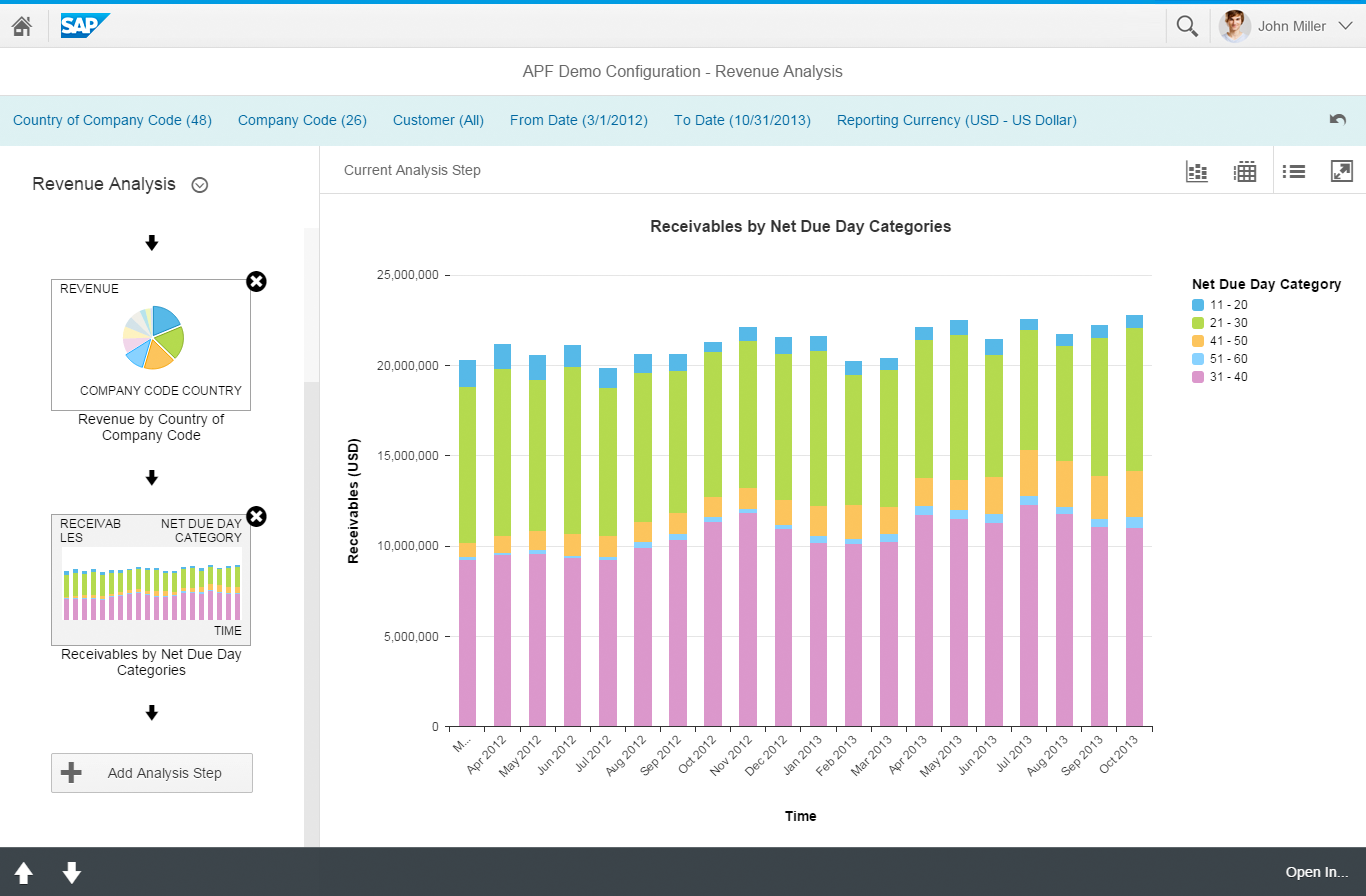
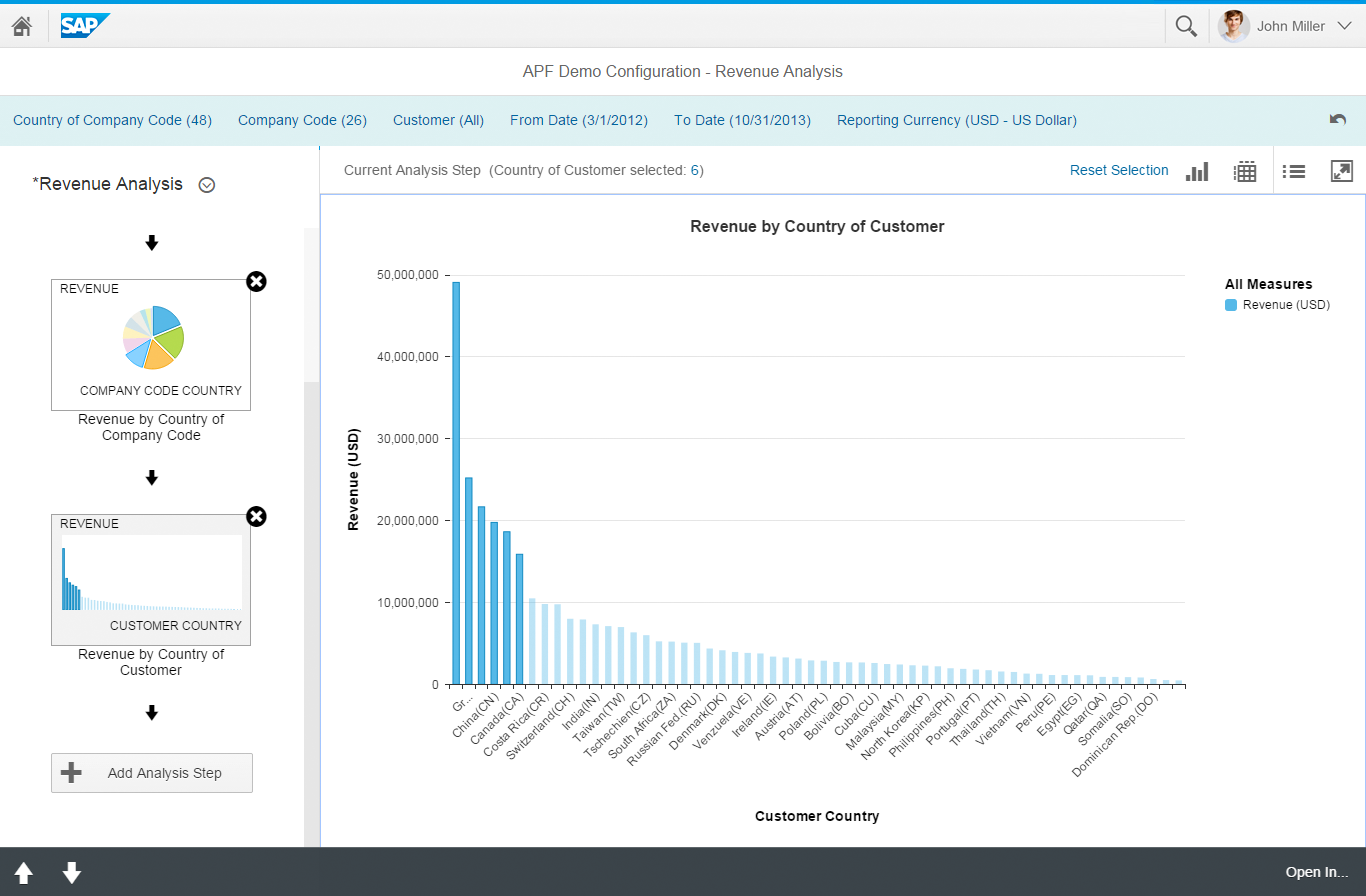
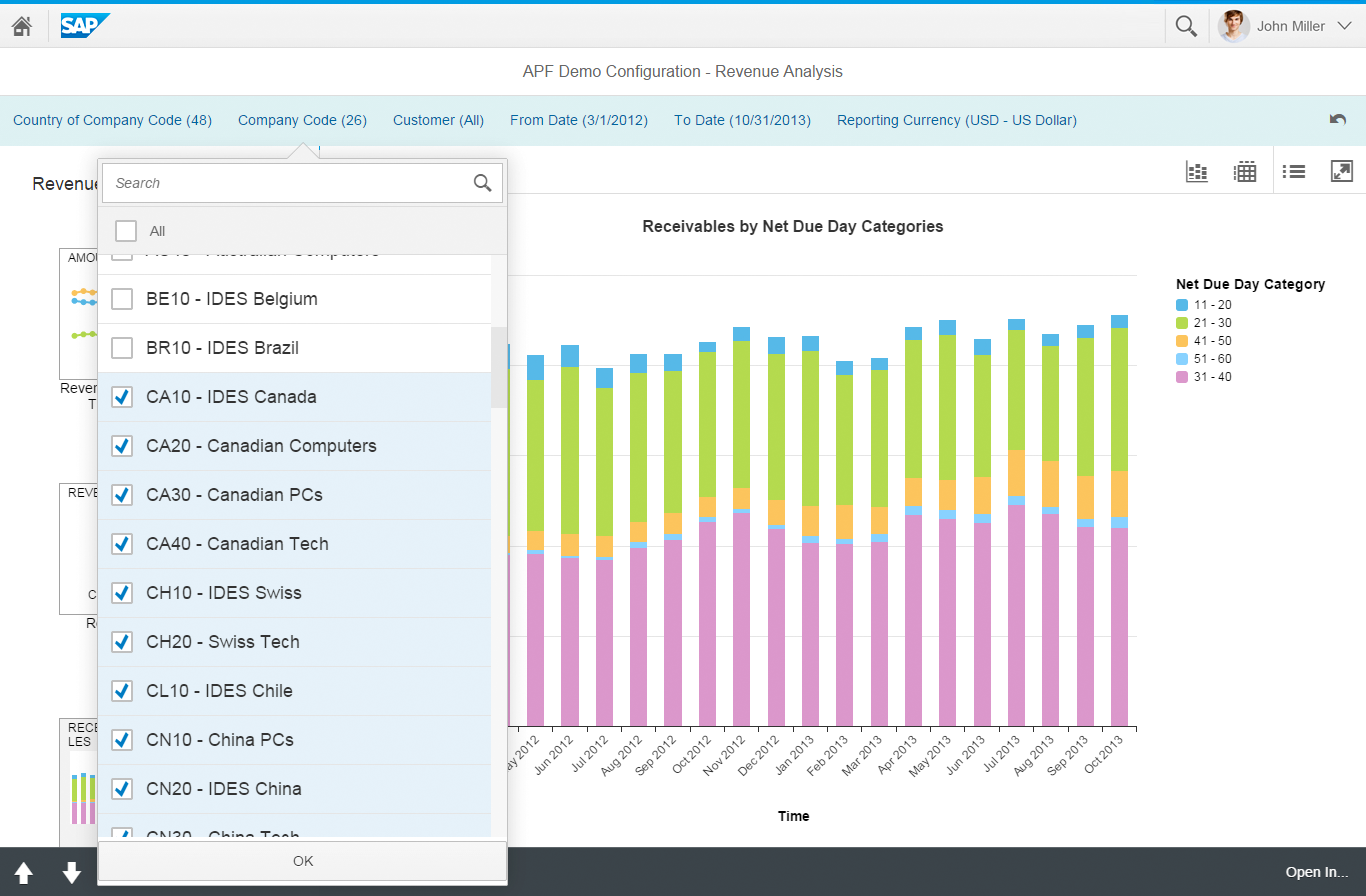
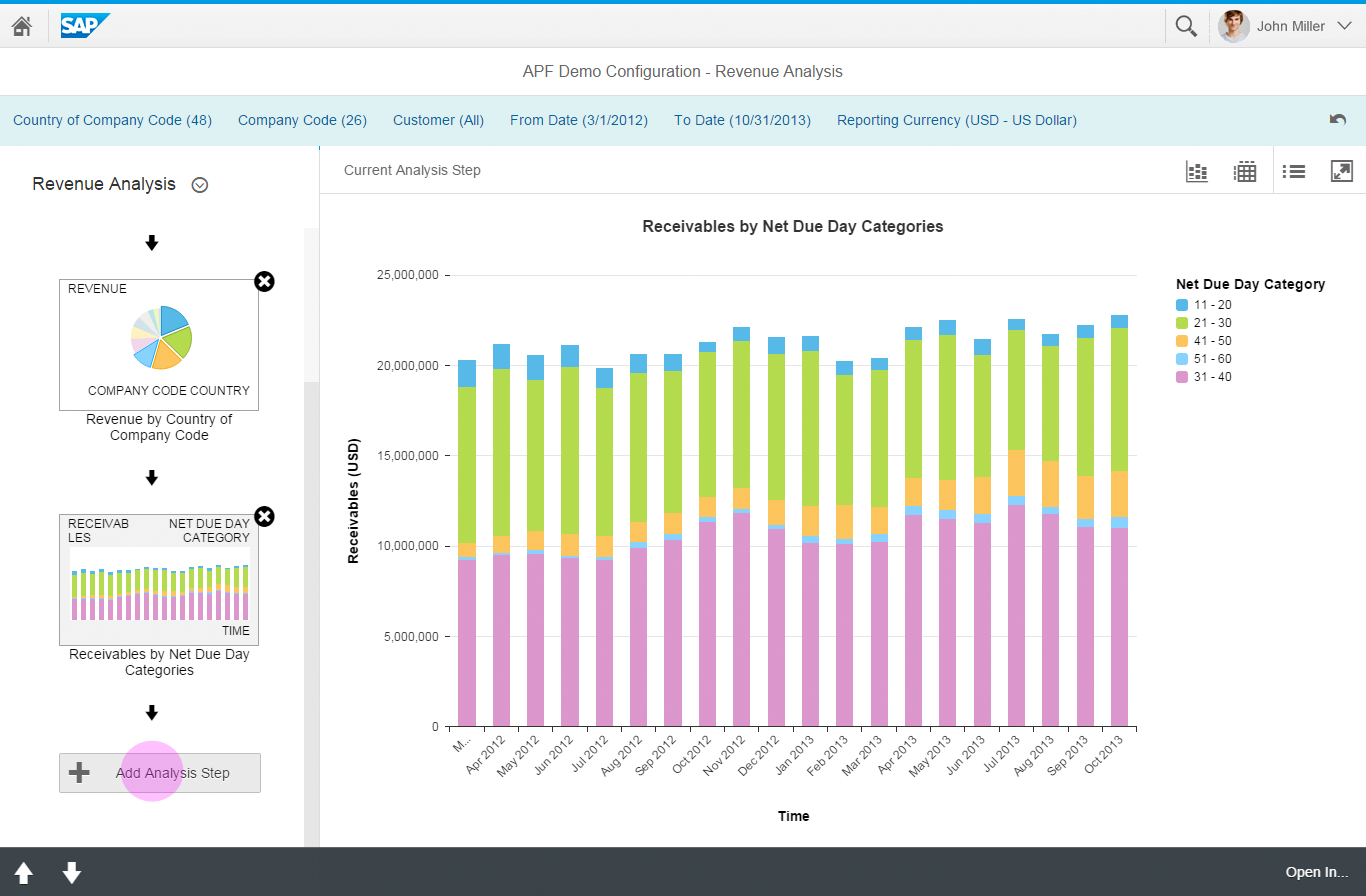
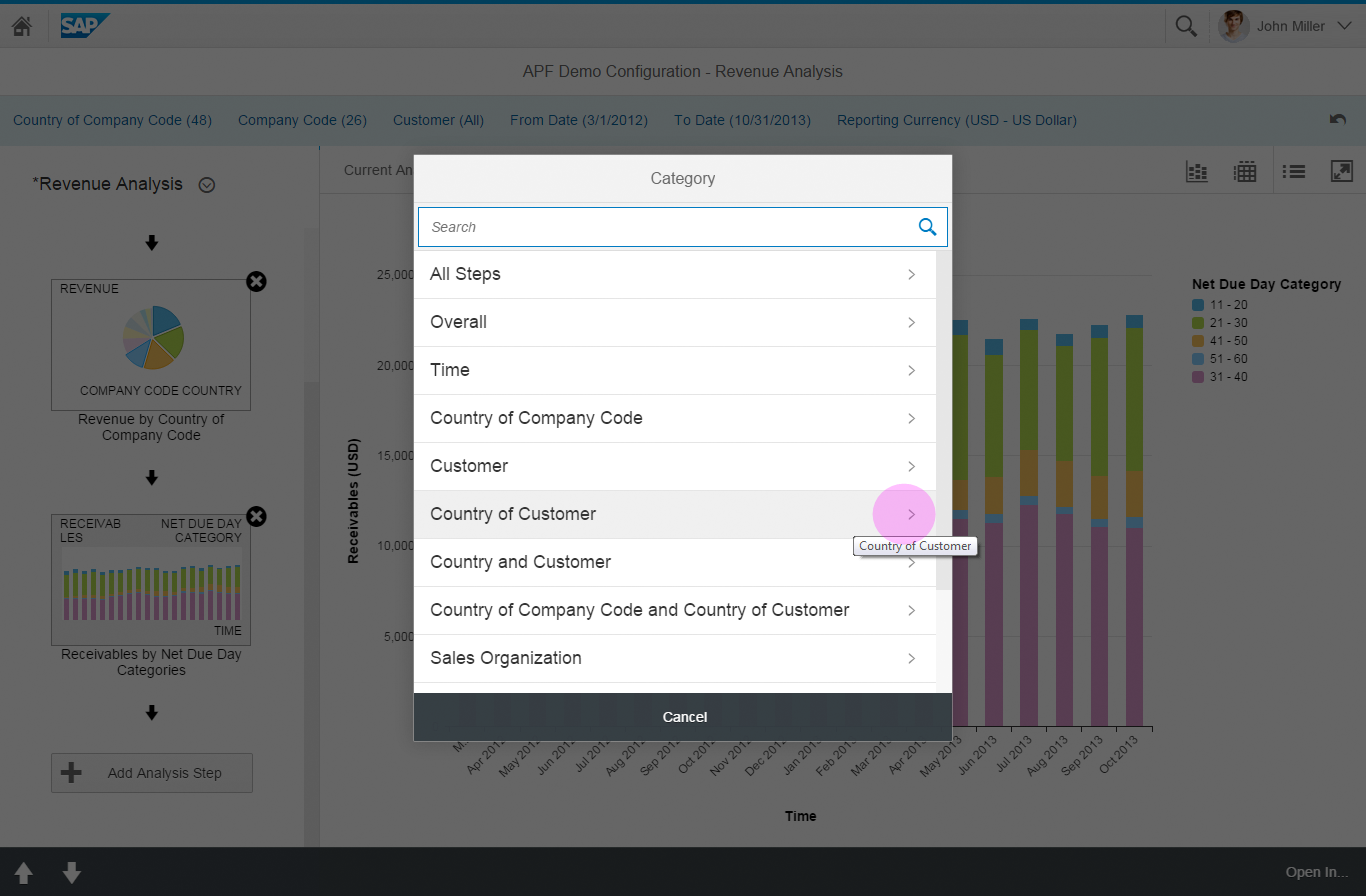
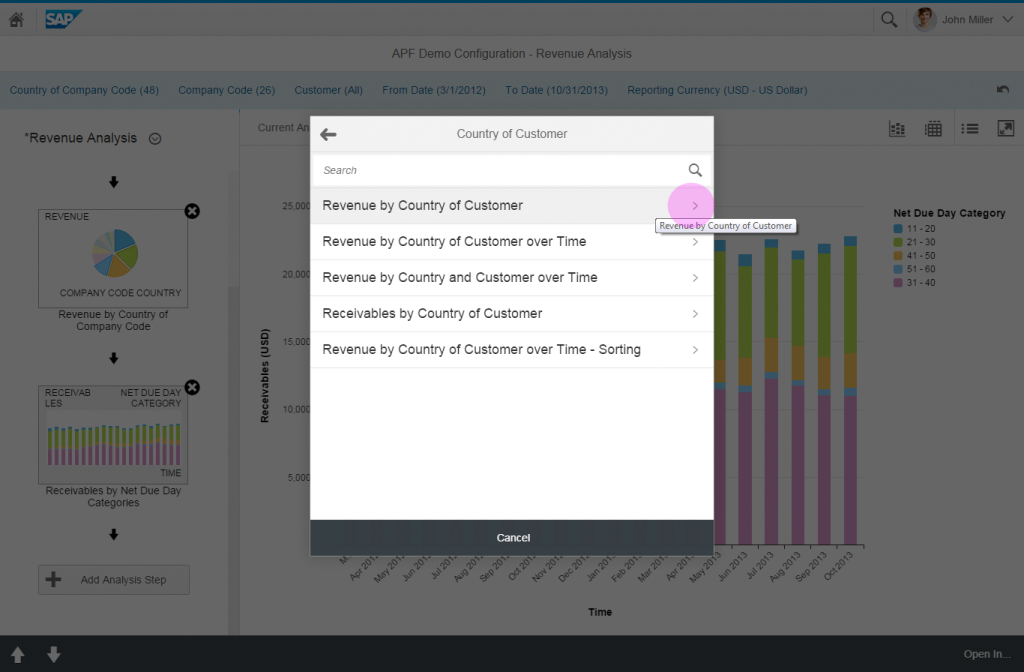
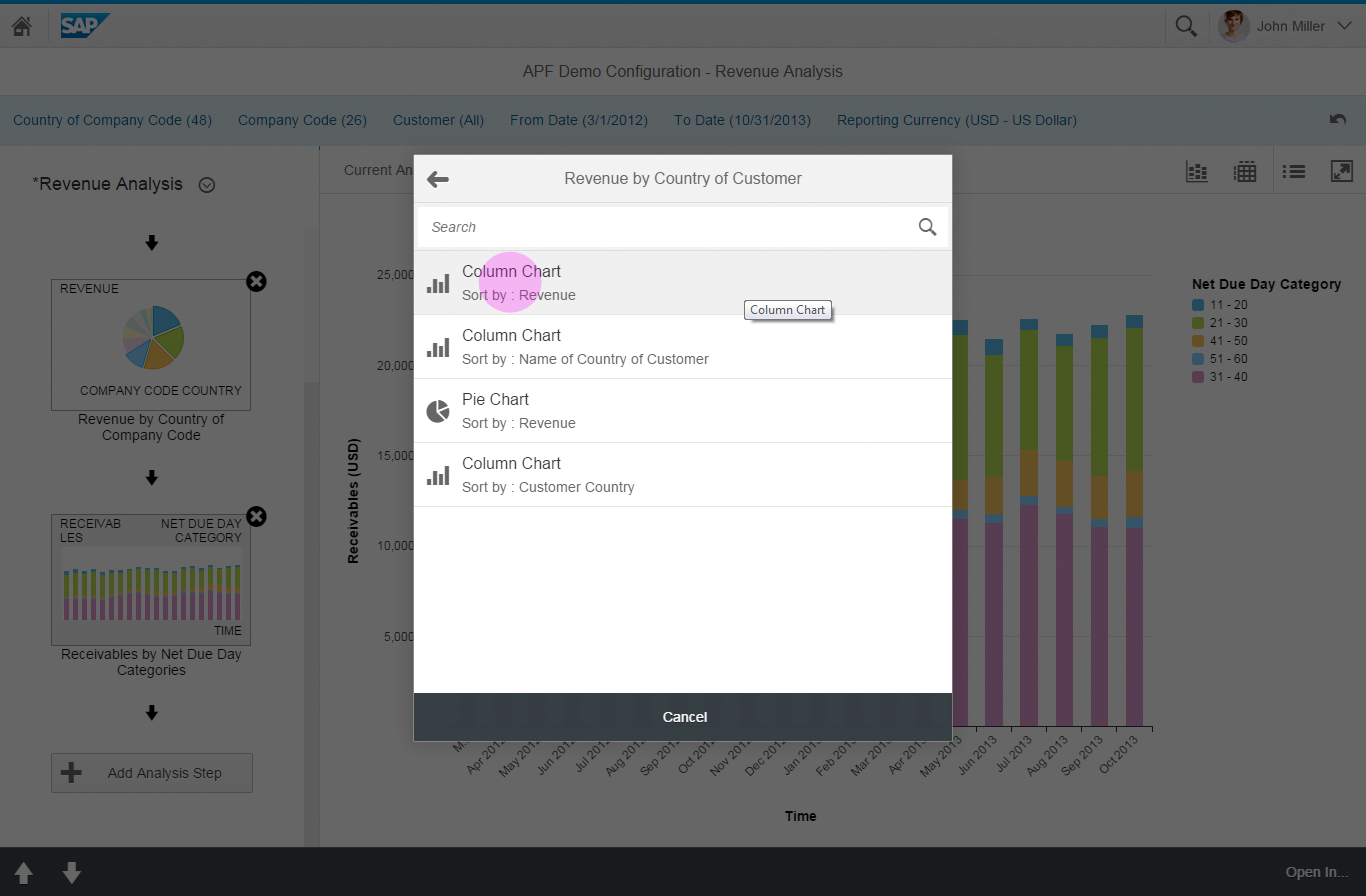
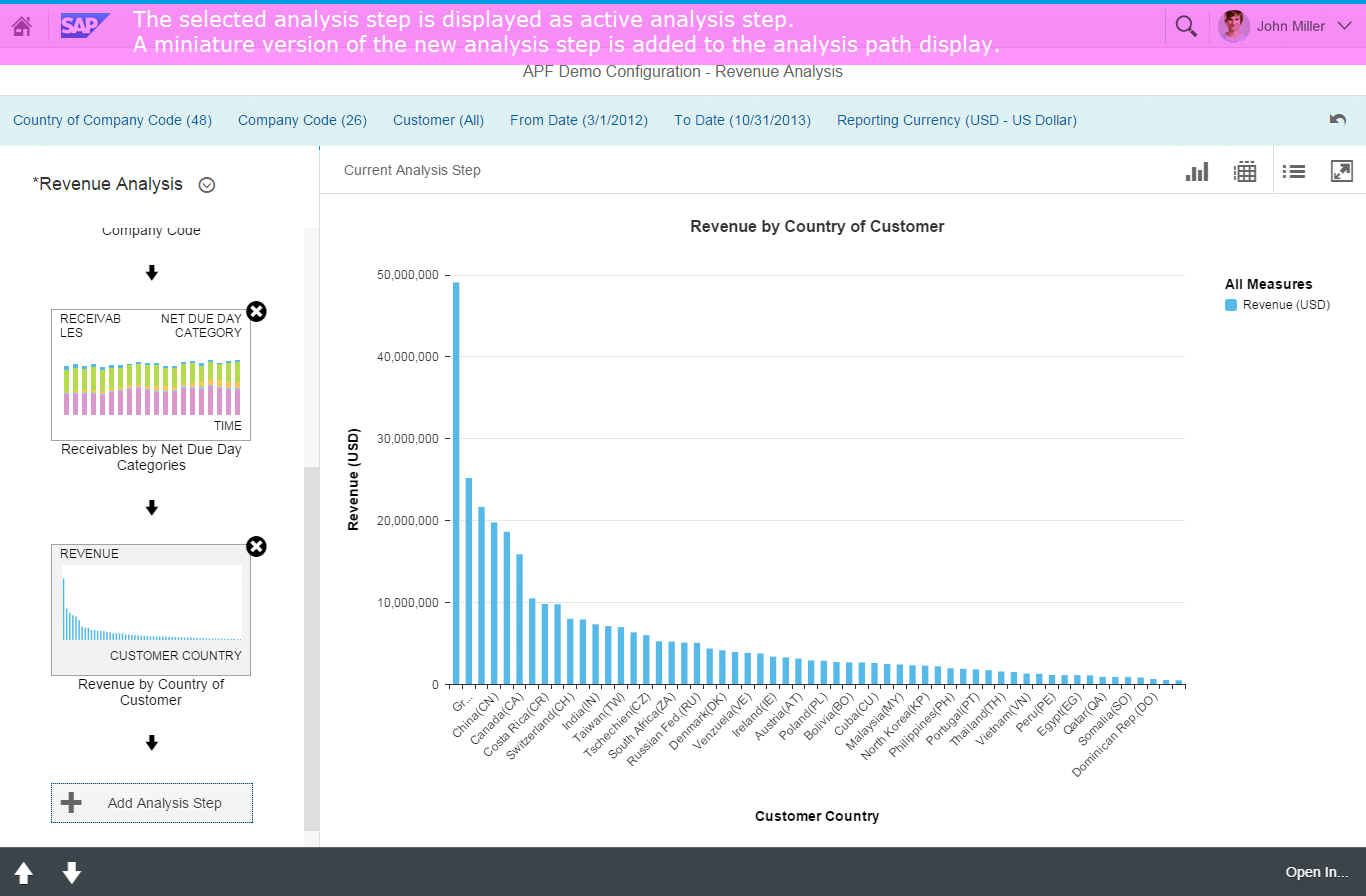
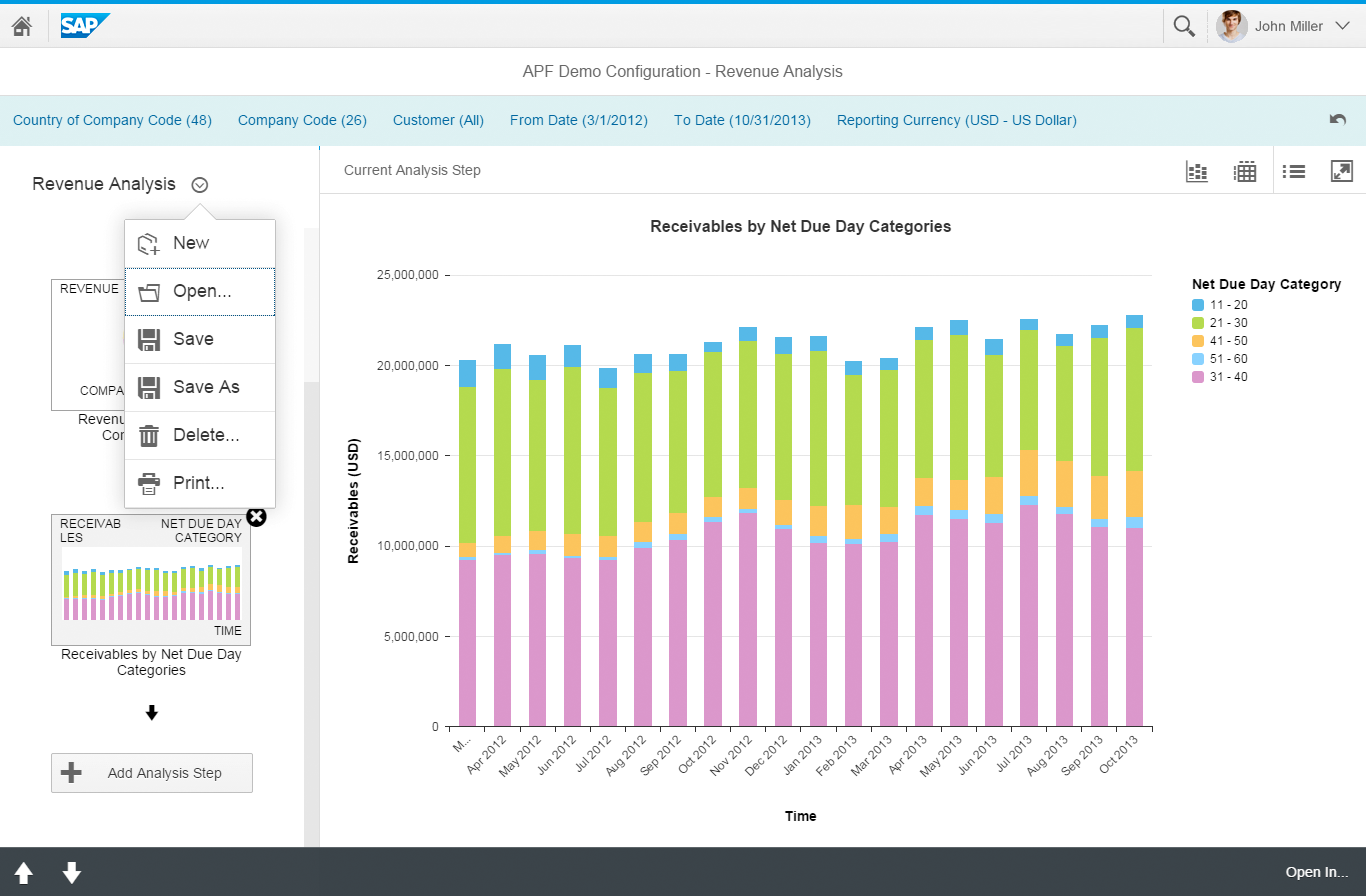
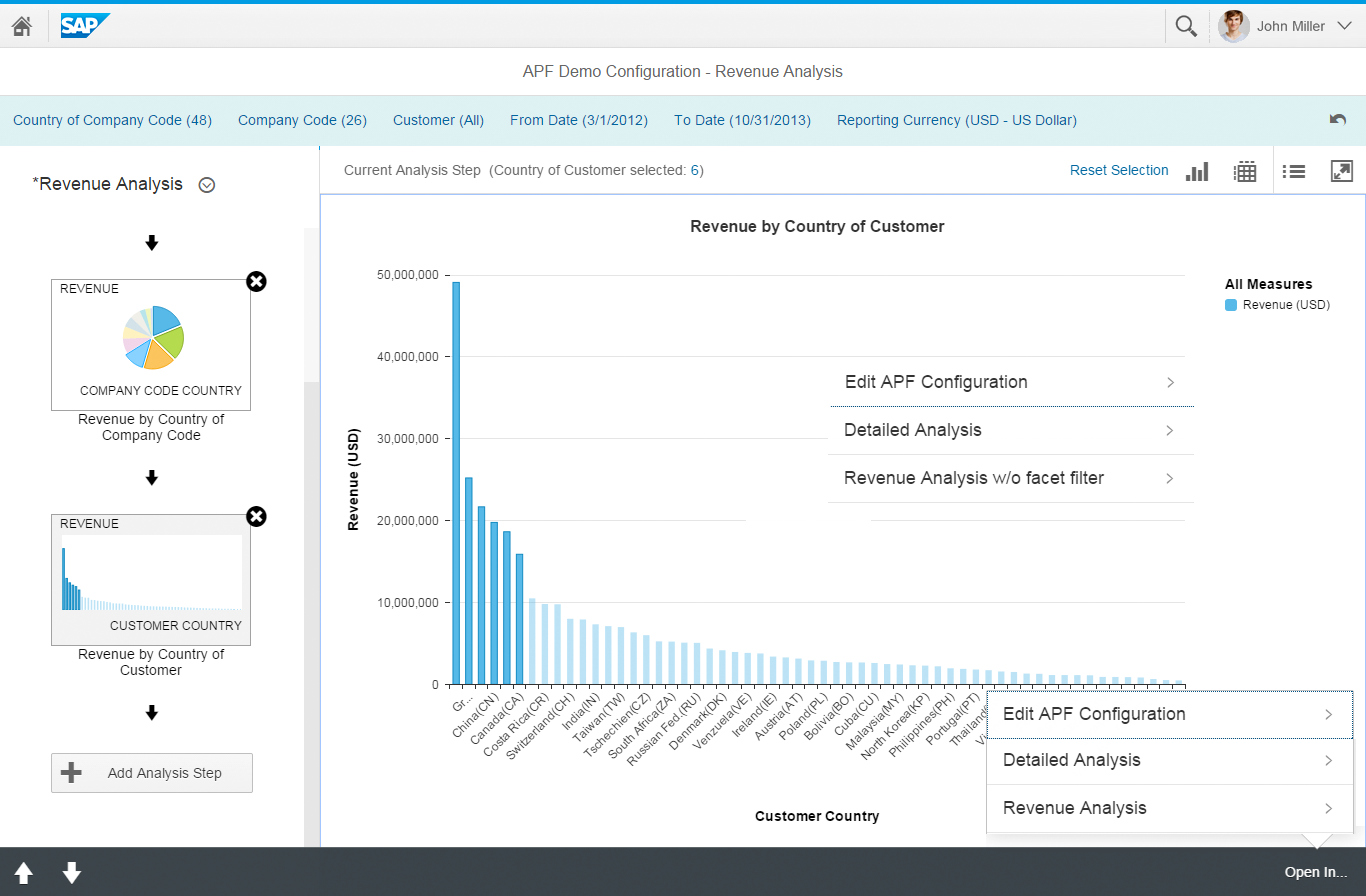
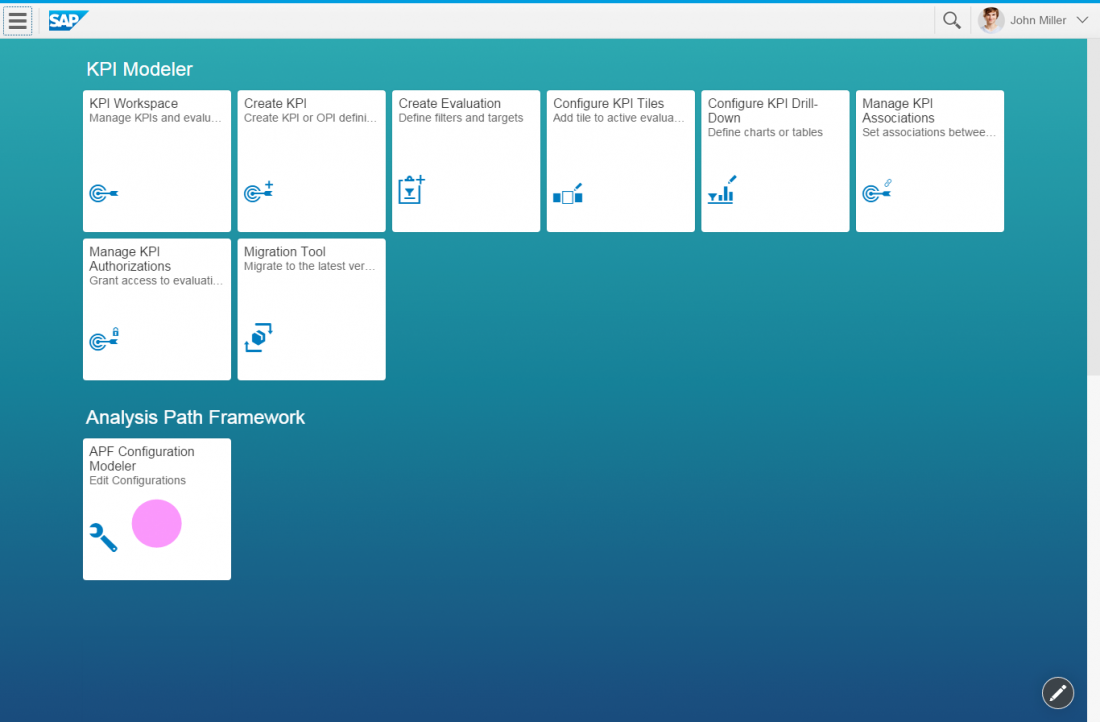
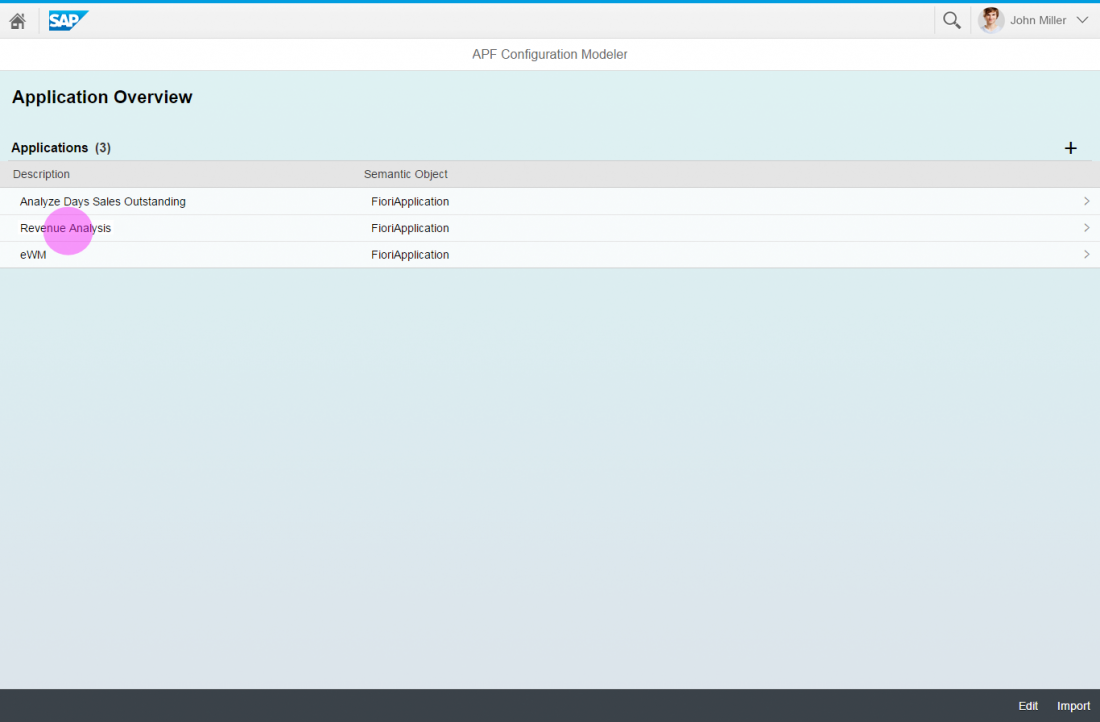
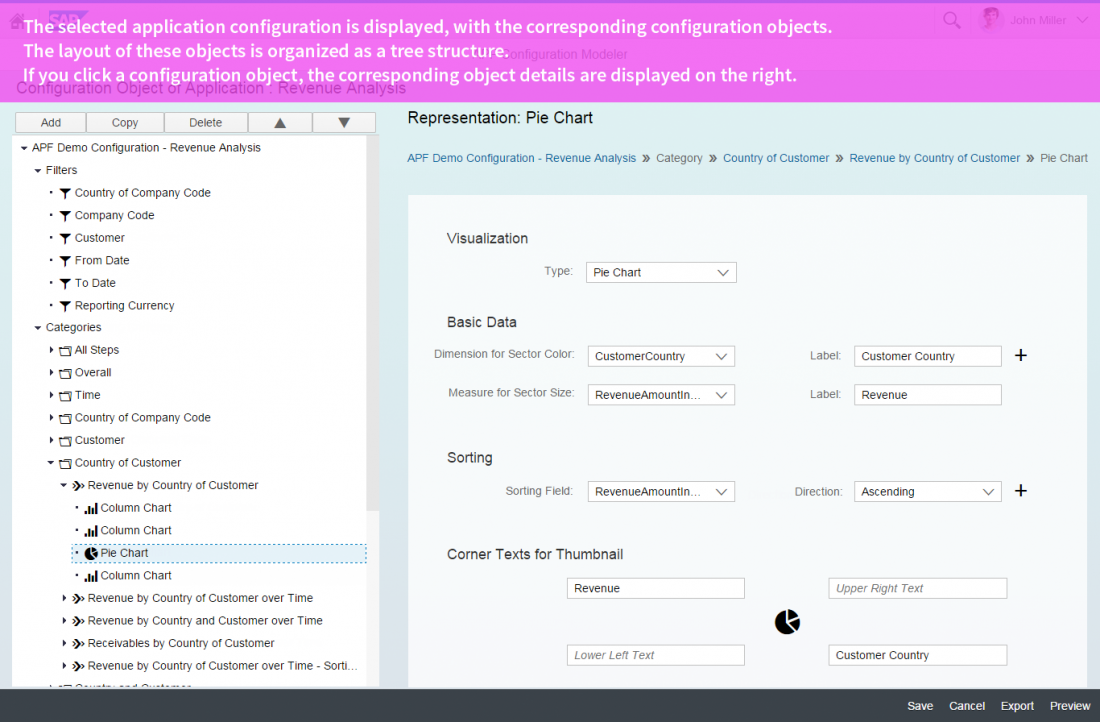
- Analysis Path Framework: For creating interactive, chart-oriented, analytical drilldown apps by configuration.
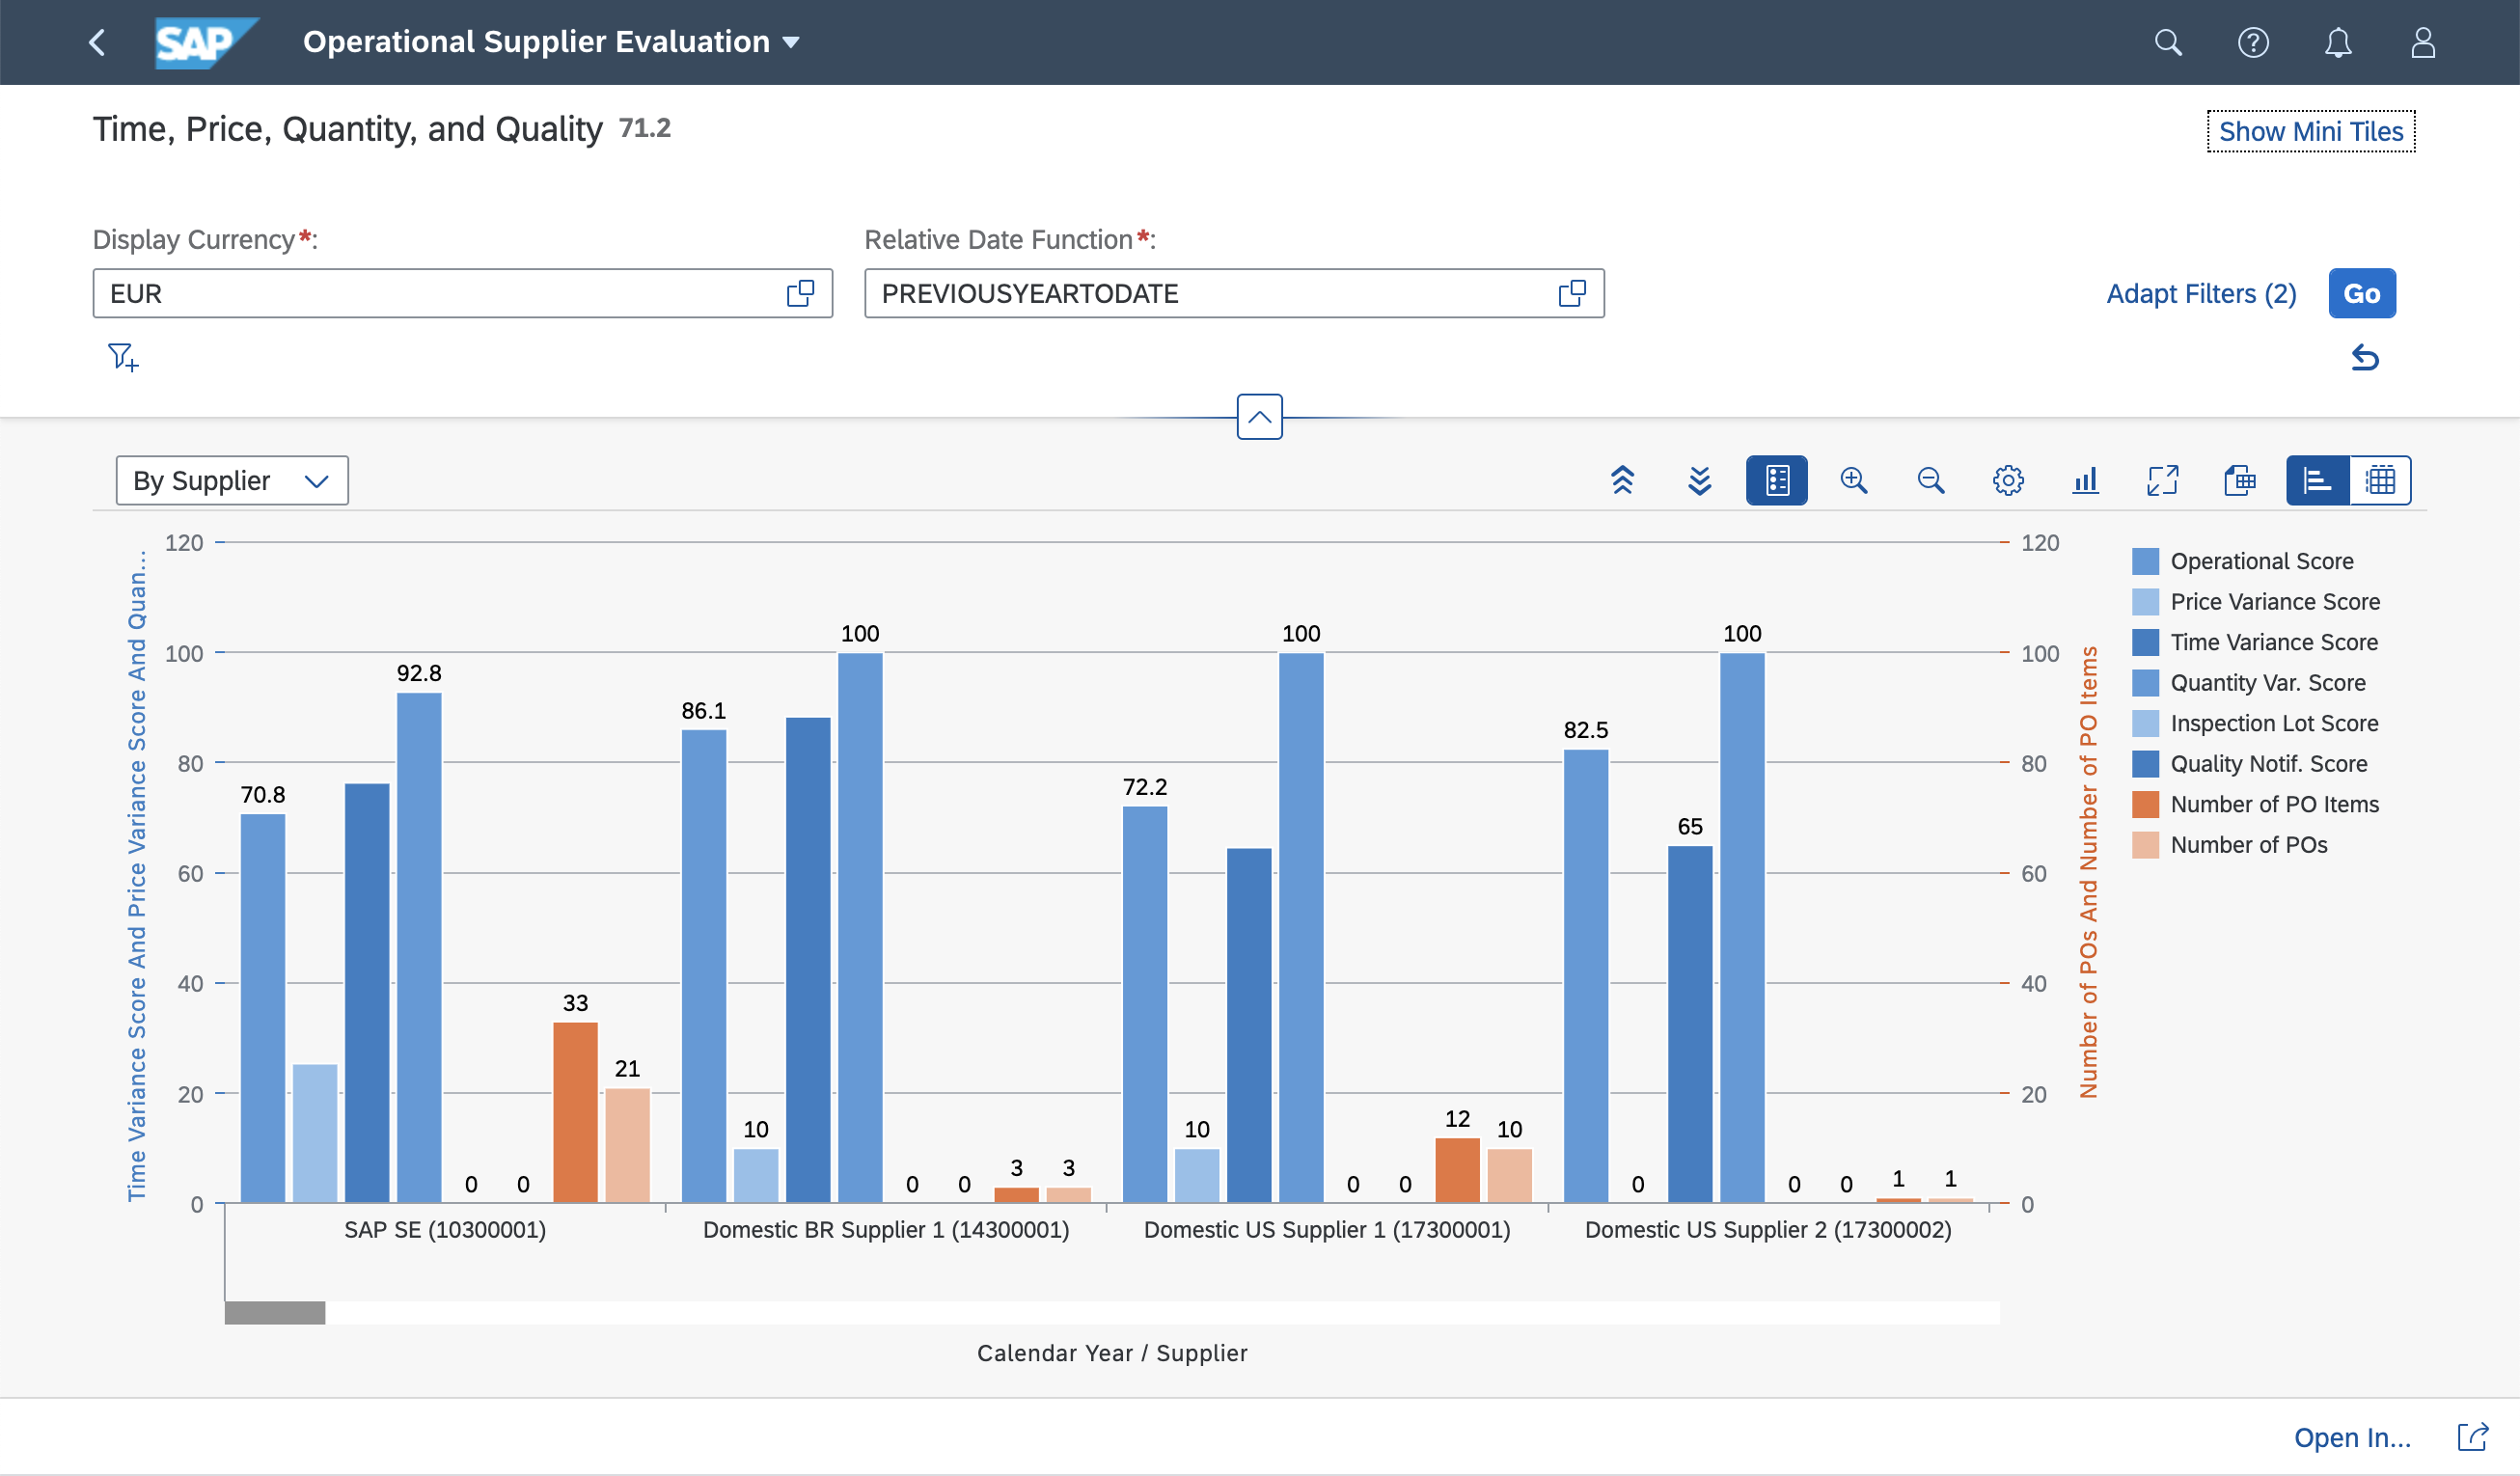
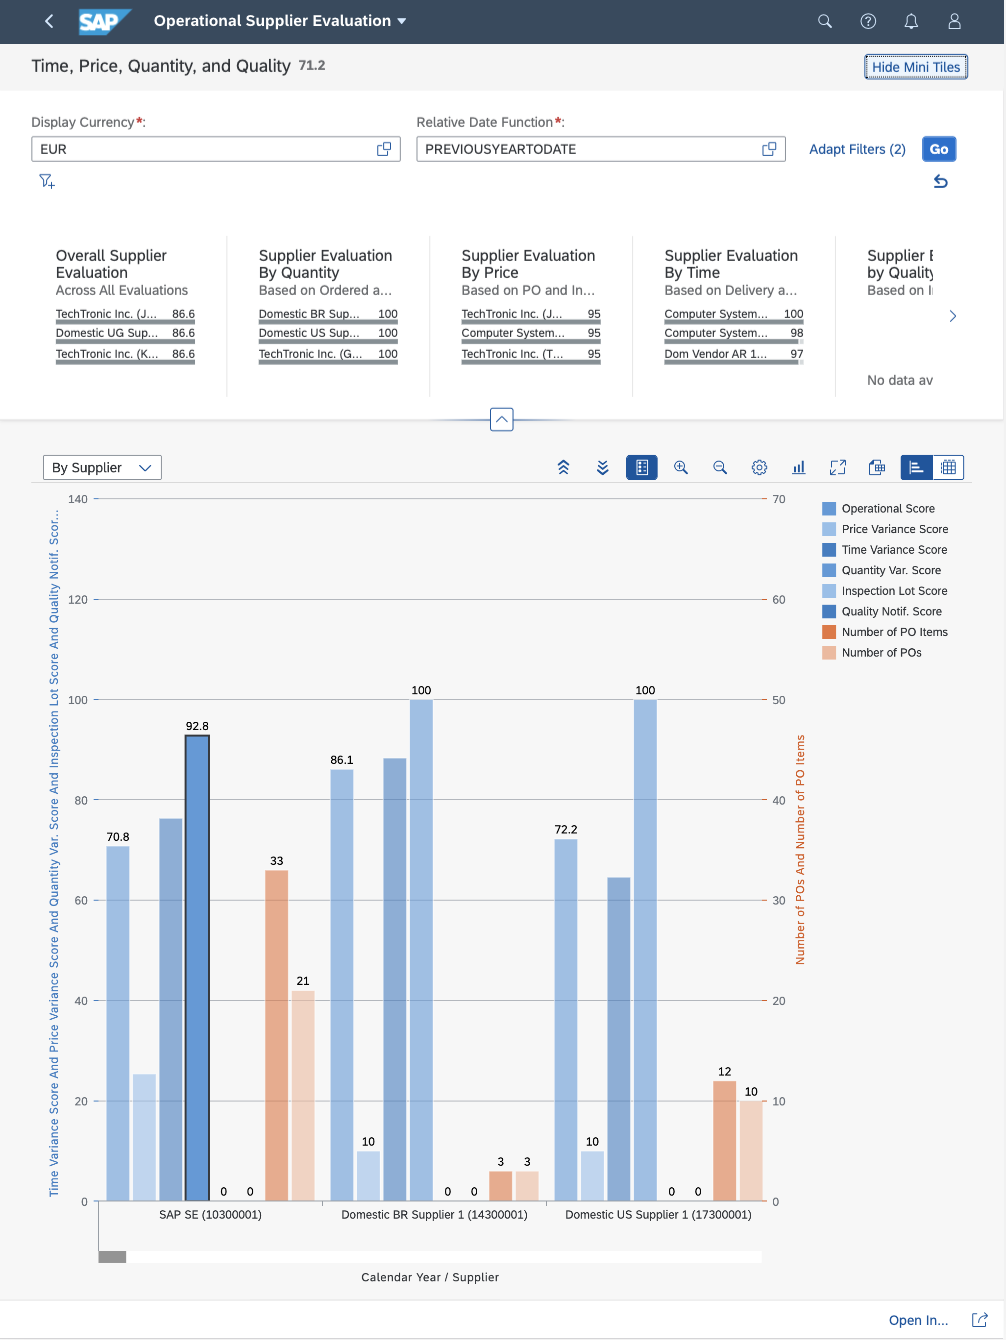
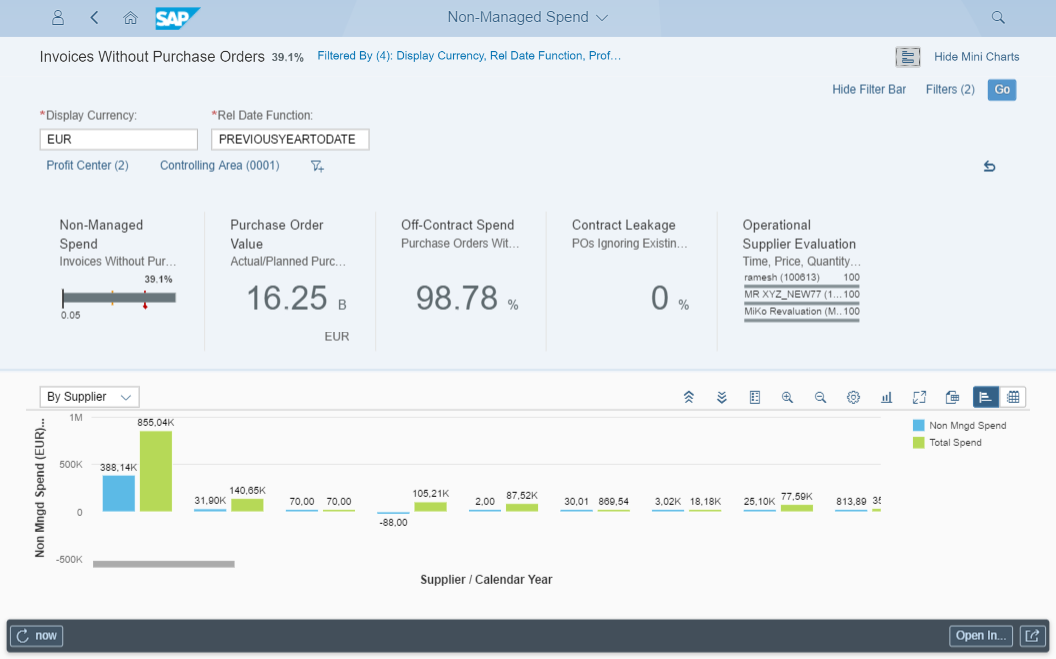
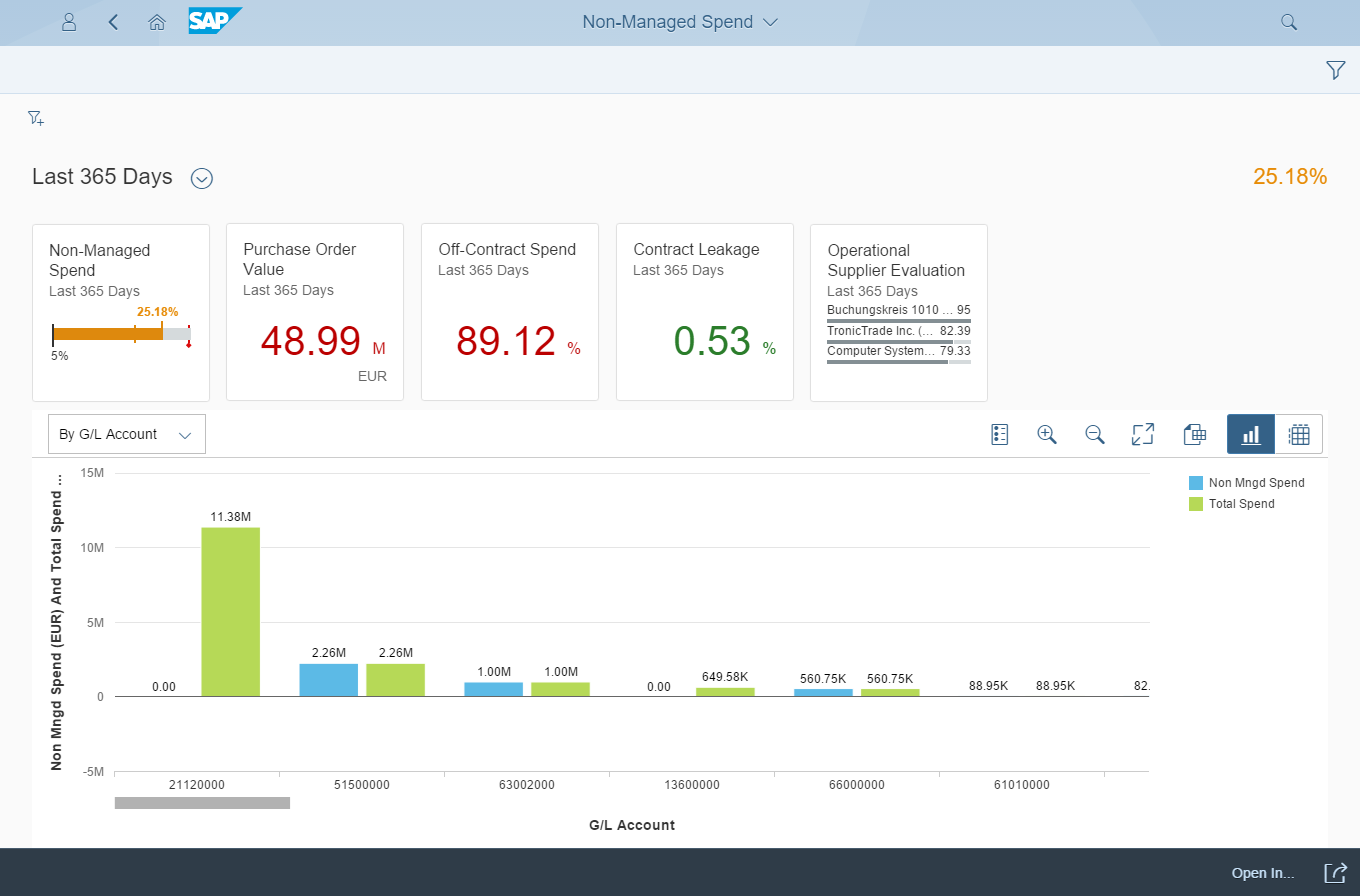
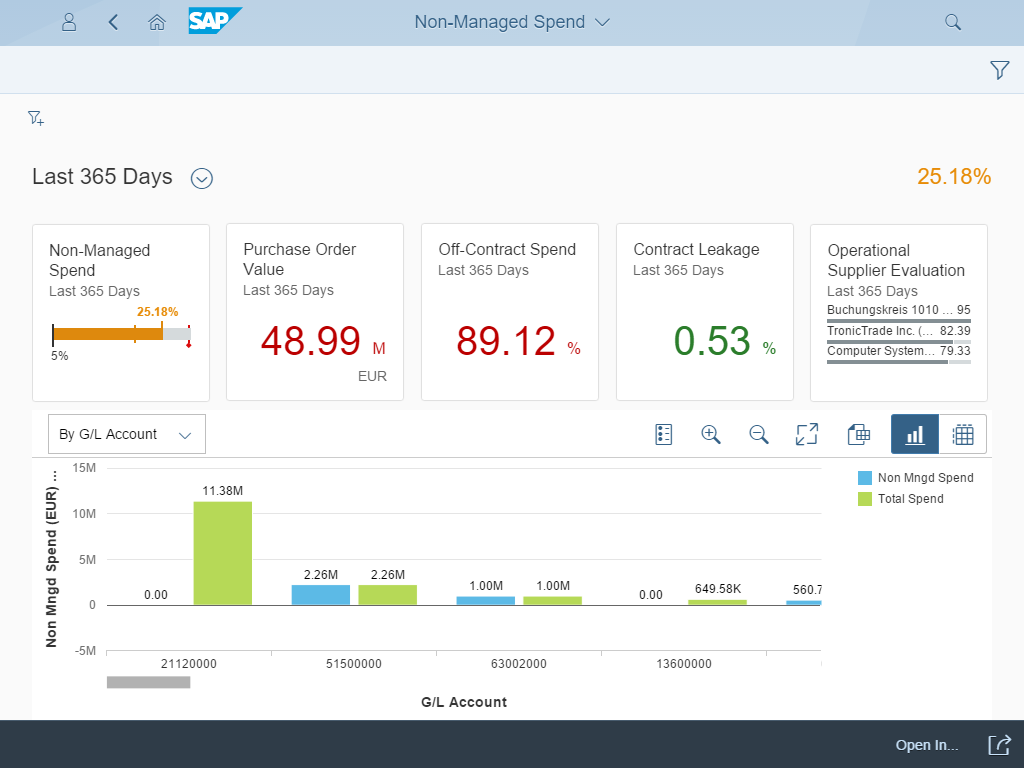
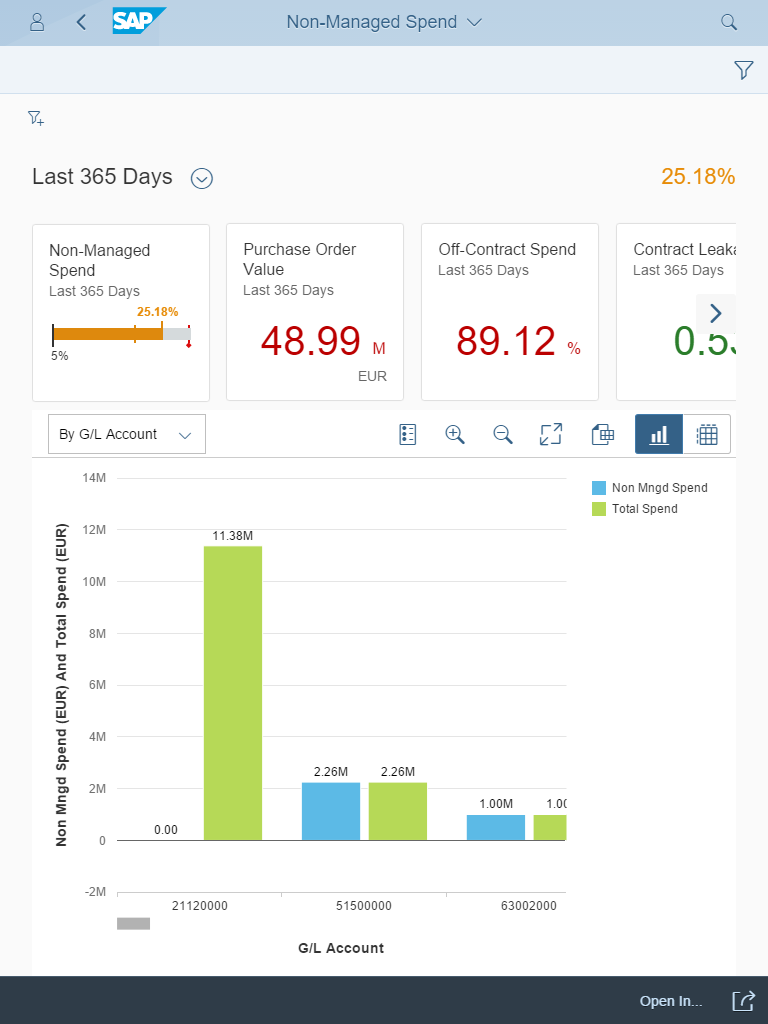
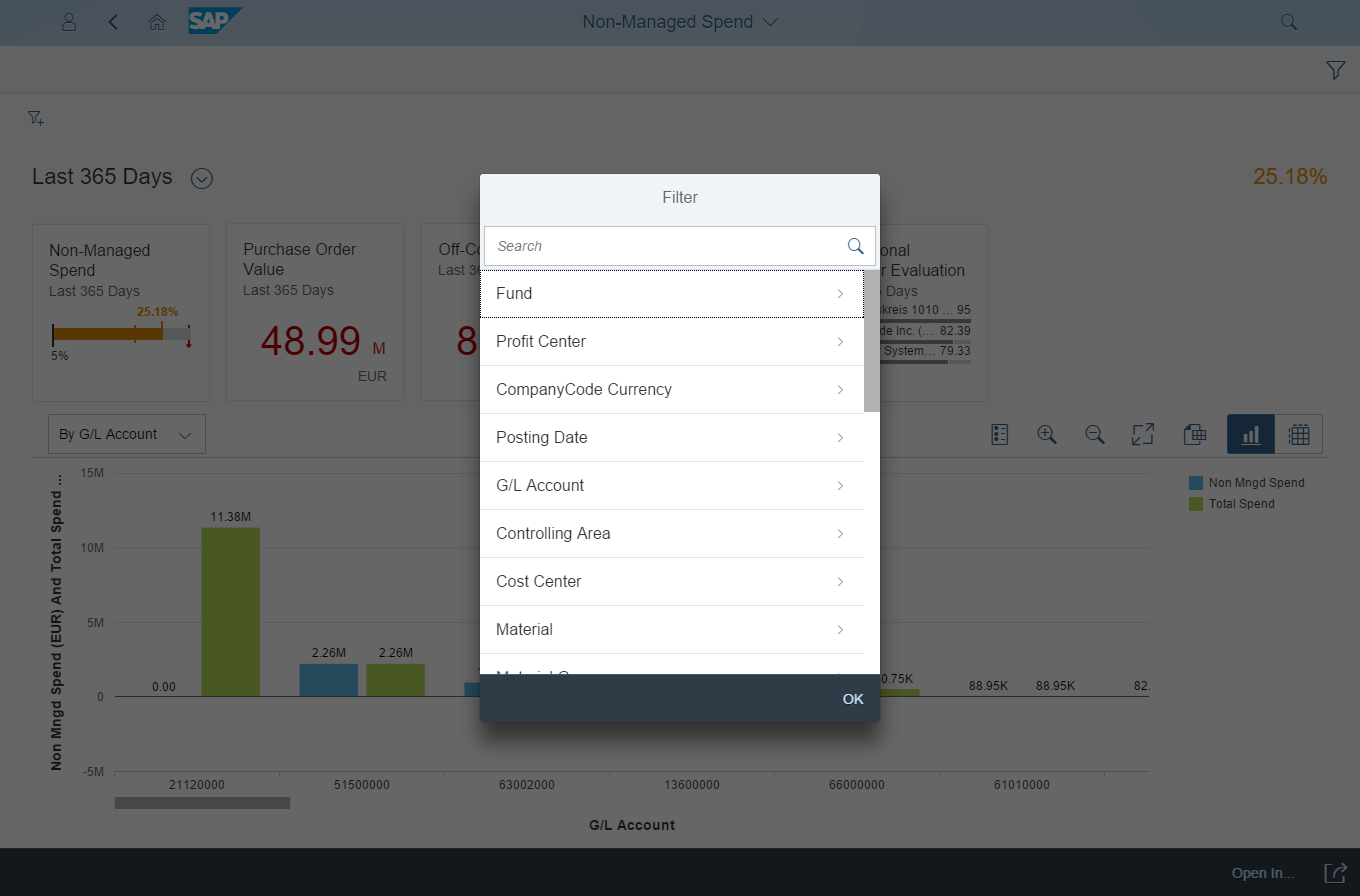
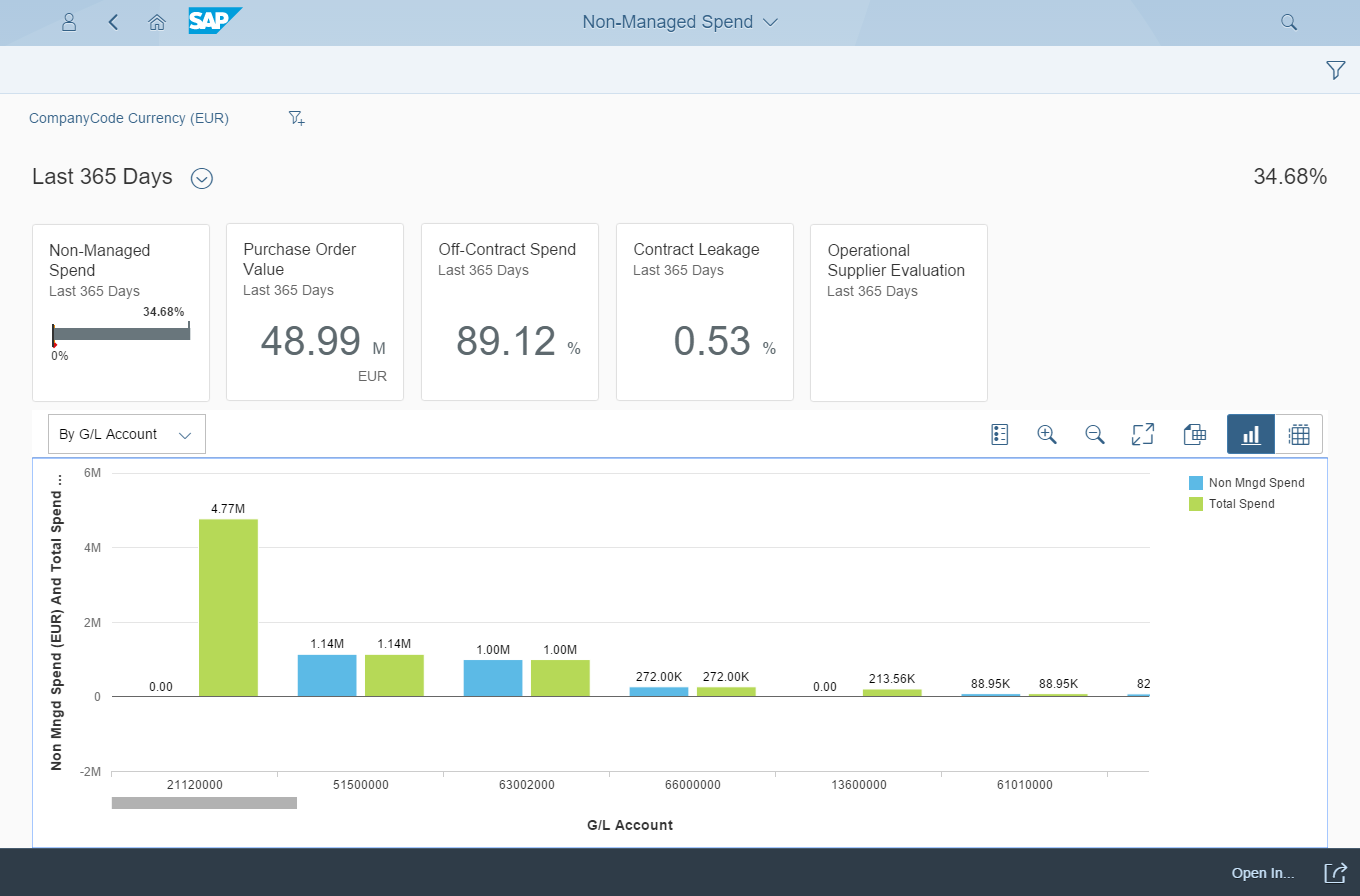
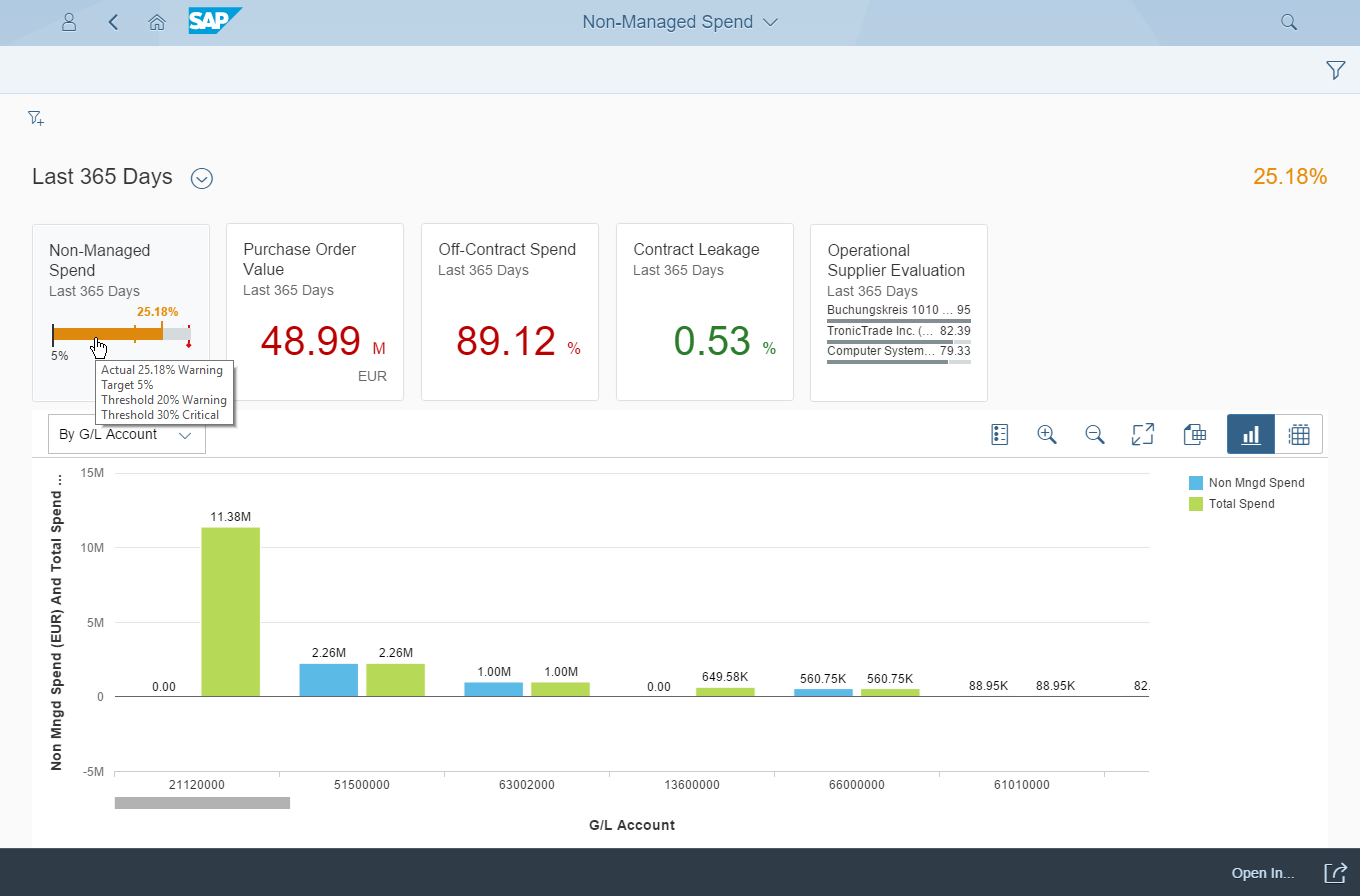
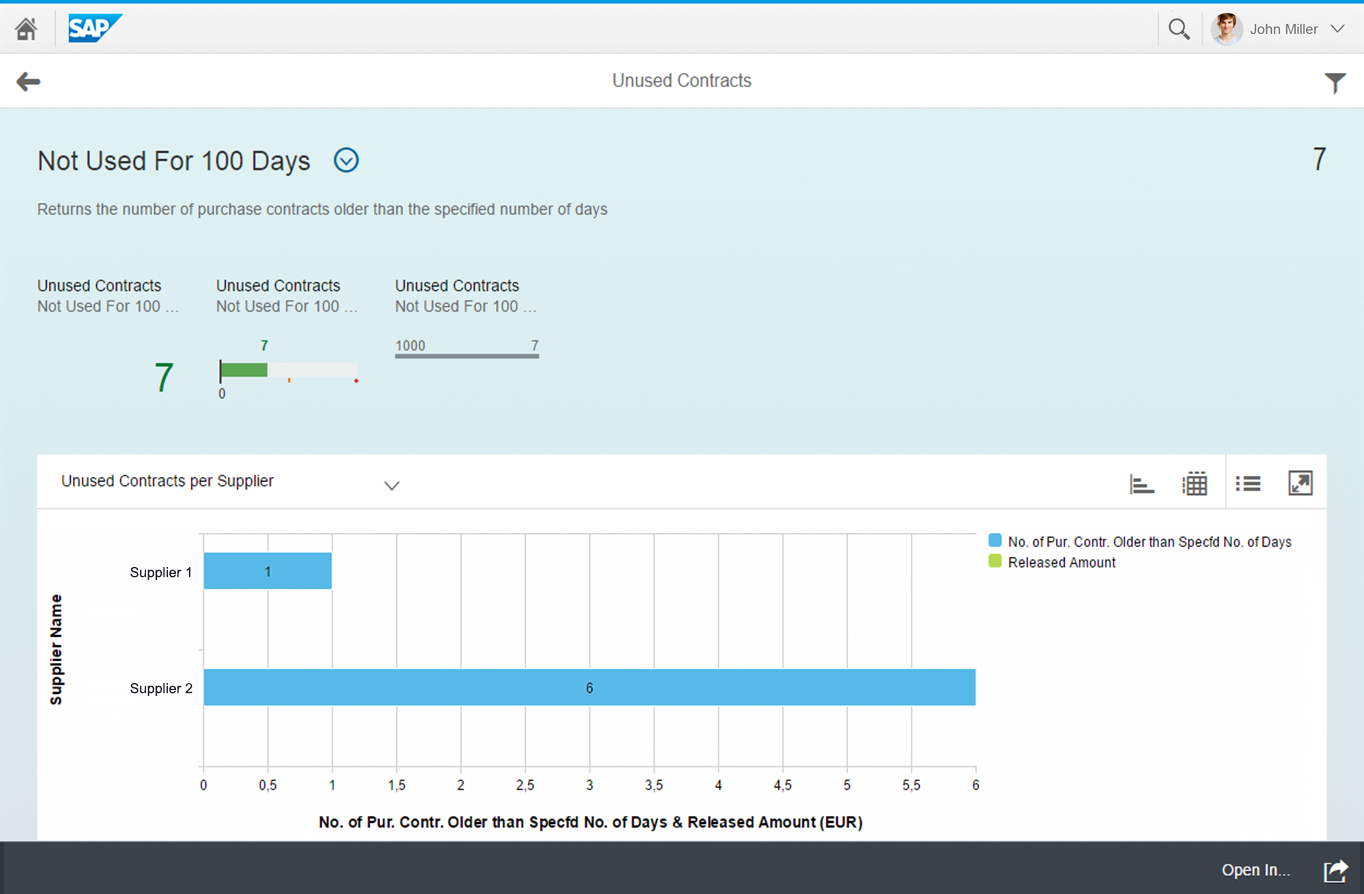
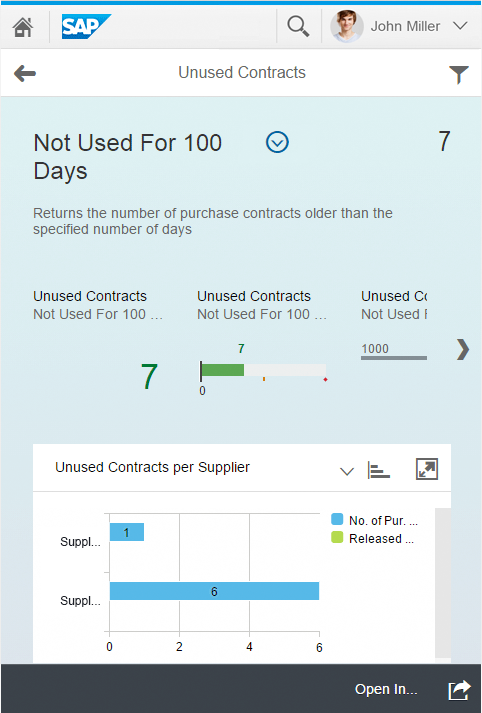
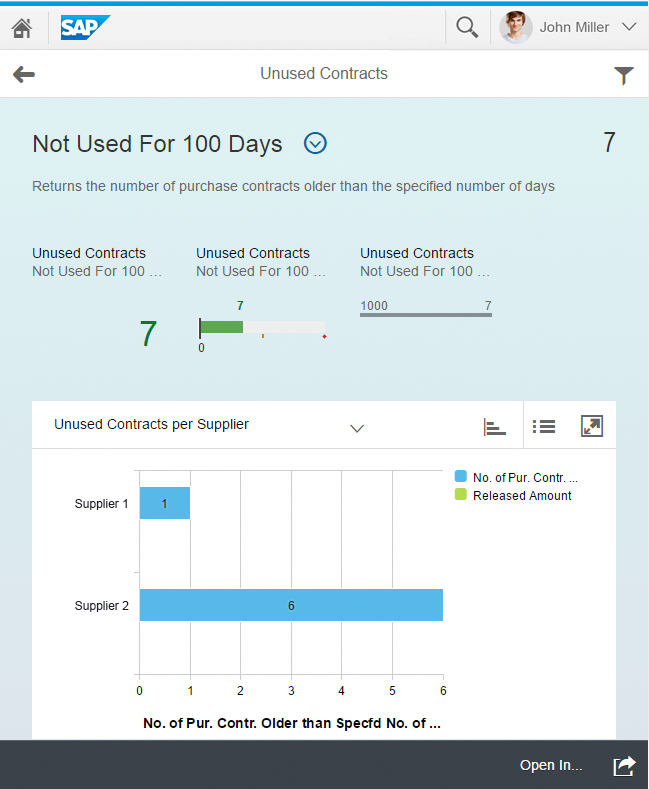
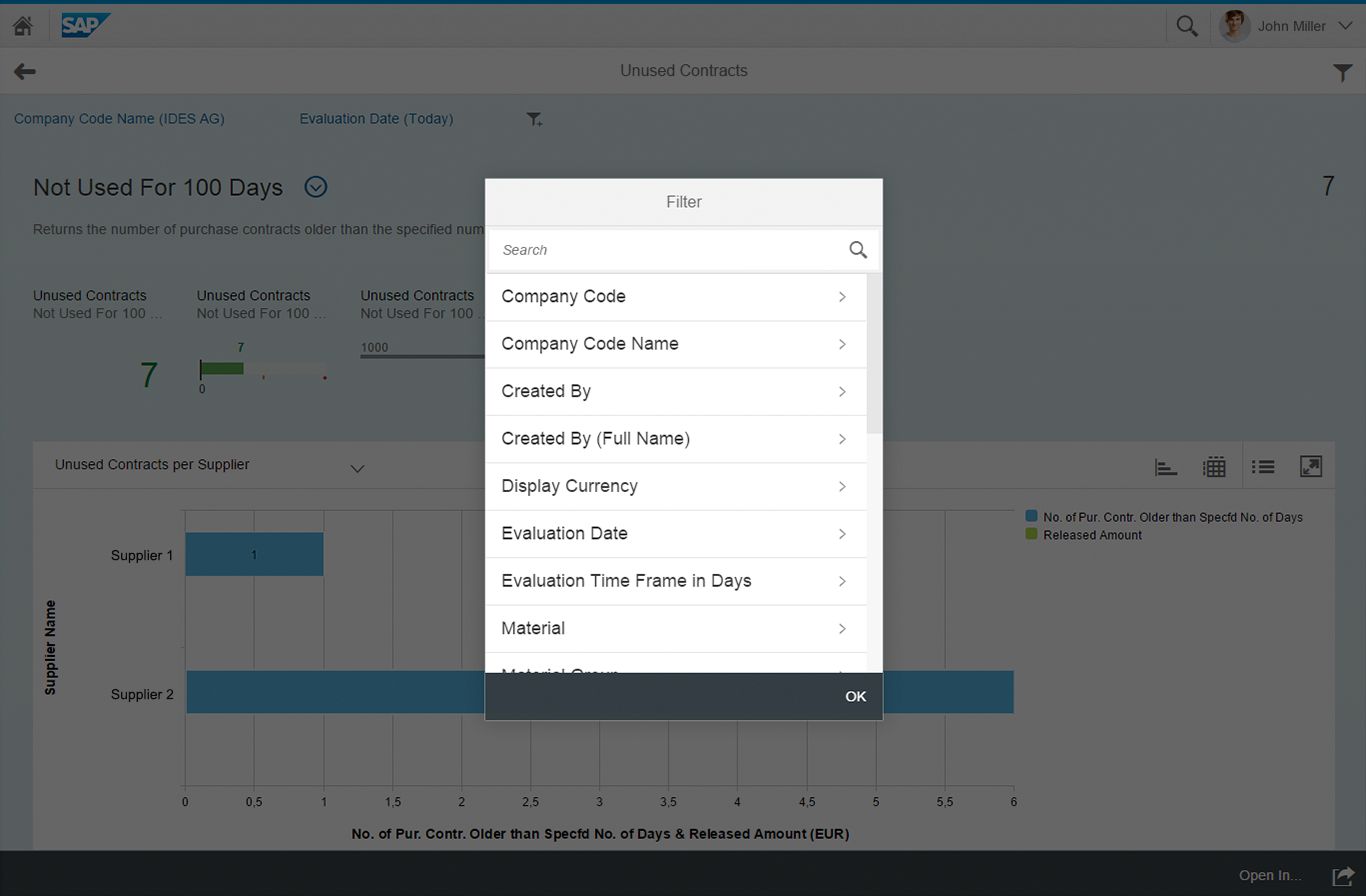
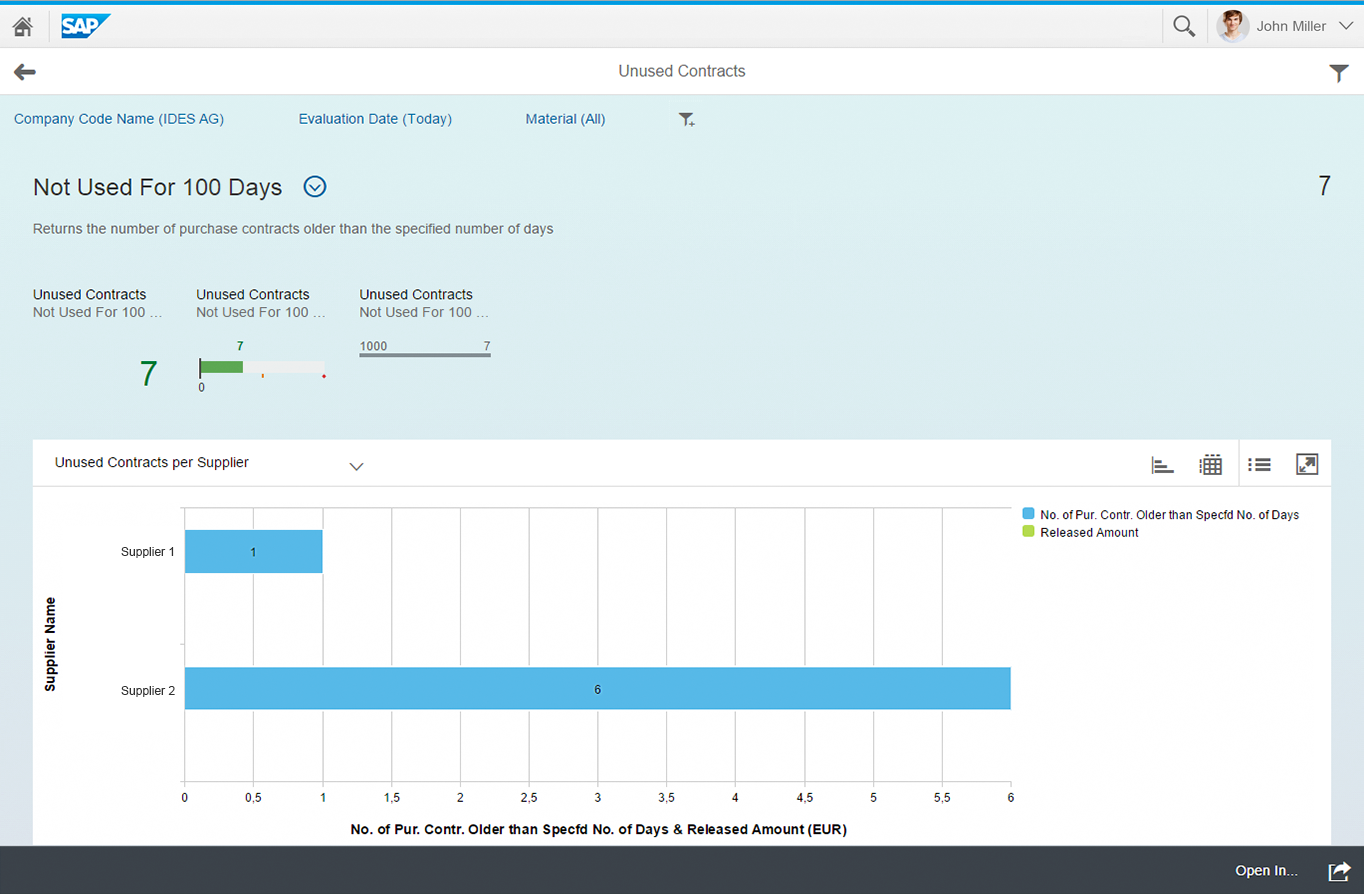
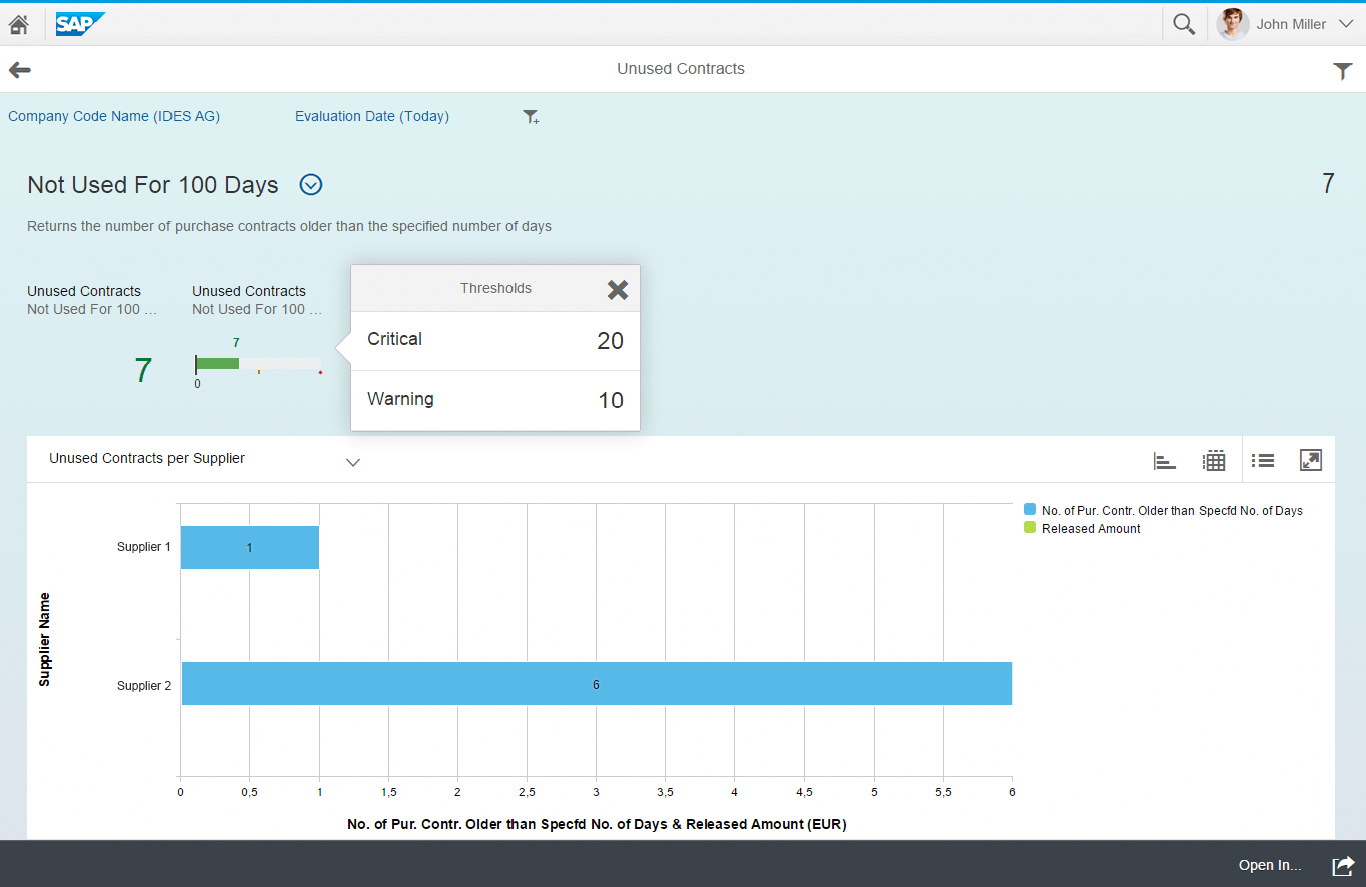
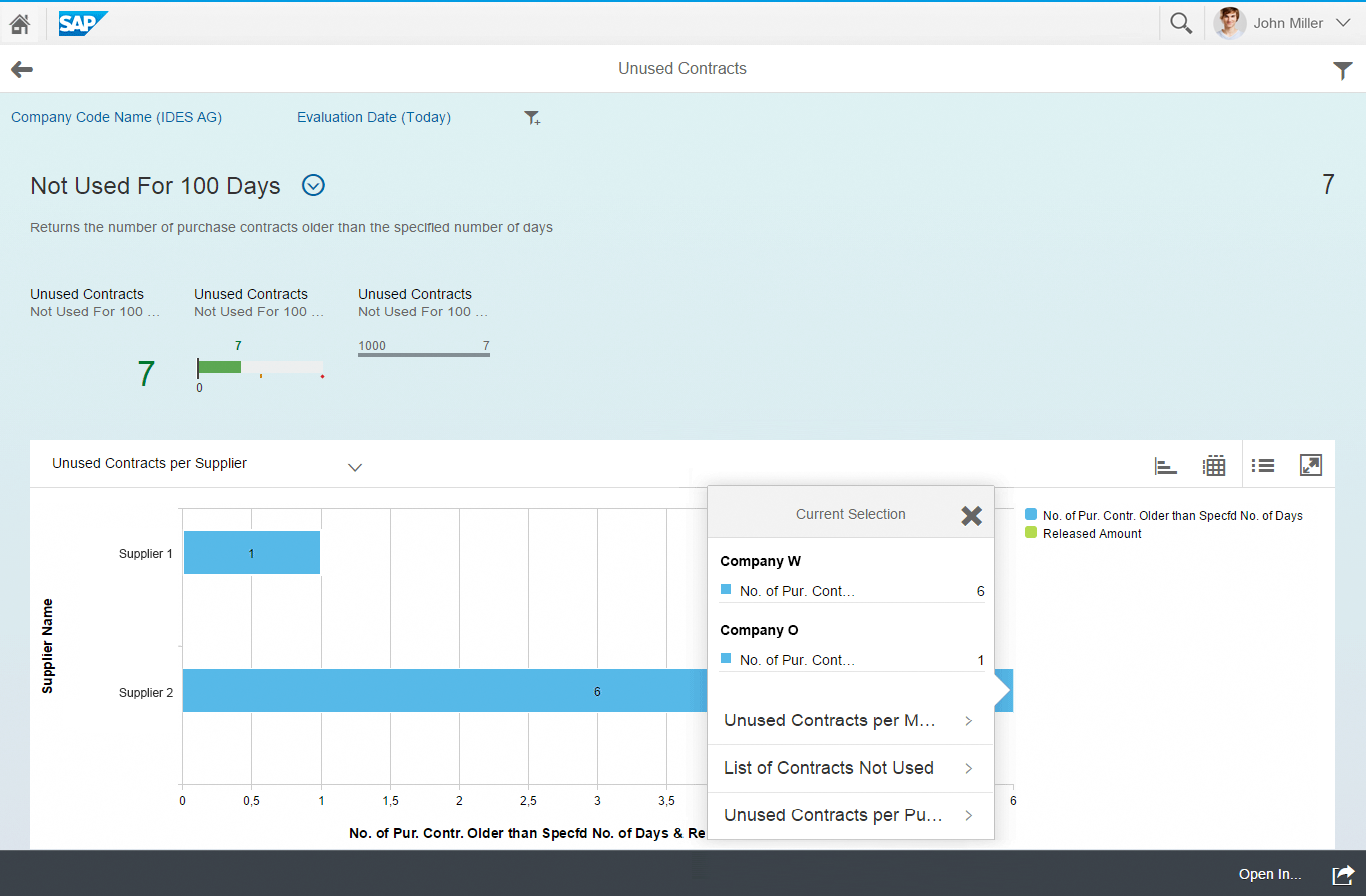
- SAP Smart Business: Analytical app that enables the user to view and analyze the data for one key performance indicator (KPI).


 Your feedback has been sent to the SAP Fiori design team.