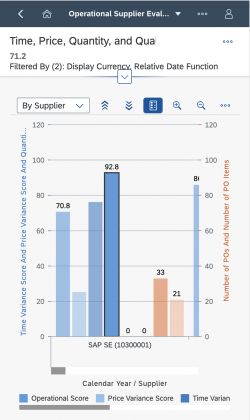
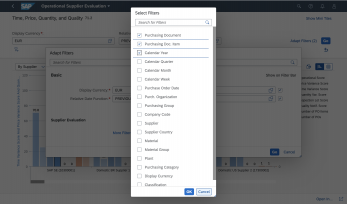
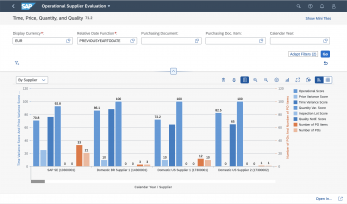
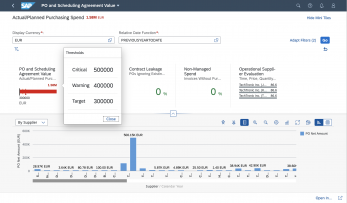
Popover

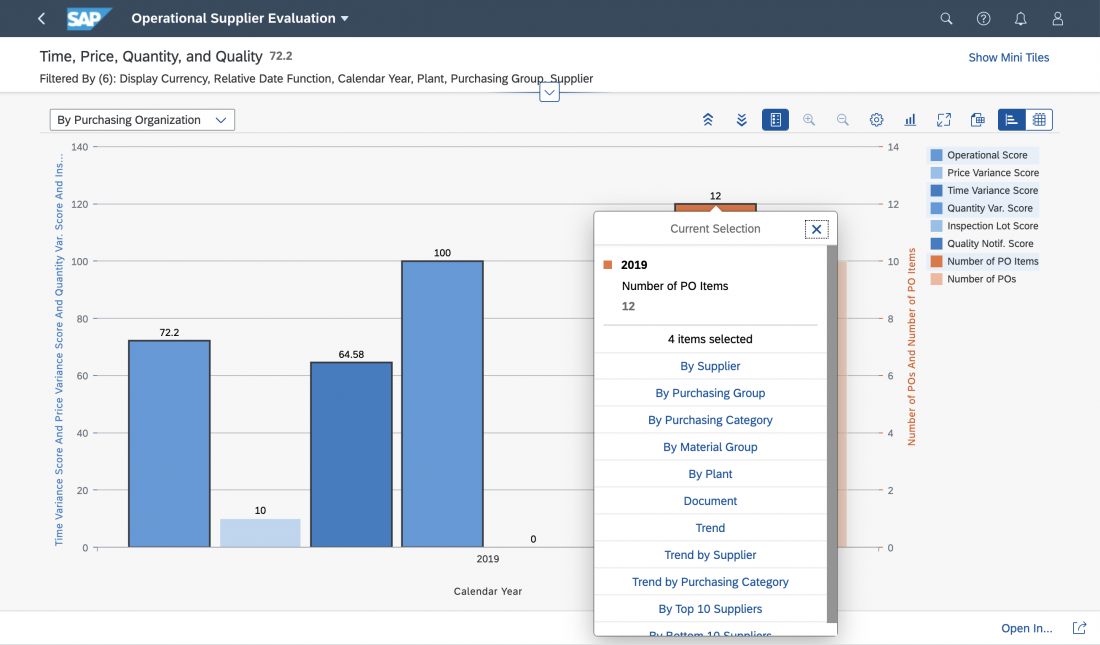
The popover displays additional information for an object in a compact way and without leaving the page. The popover can contain various UI elements such as fields, tables, images, and charts. It can also include actions in the footer.

Note: The quick view is similar to a popover, but has a predefined structure, a fixed set of UI elements, and automatic UI rendering. Check first whether the quick view is appropriate for your use case.

Usage

Use a popover if:

  • You need to define your own structure.
  • You want to show UI elements that are not available with the quick view.

Do not use a popover if:

  • The quick view is more appropriate for your use case.
  • The objects are in the list in a list-detail layout (in this case, the details are shown in the details area).

Responsiveness

The popover can be used in the following ways:

  • Responsive and adaptive: sap.m.ResponsivePopover
    Shows a dialog on smartphones (to be closed with an X) and a popover on a tablet or desktop.
  • Non-responsive: sap.m.Popover
    Always shows a popover. Only use a non-responsive popover if it has very little content. On smartphones, the popover should not use more than a third of the phone’s real estate.

Layout

Structure of Popover

The header and footer are generally optional. The other elements are as follows:

Back (1) – optional
Needs to be implemented if the user can trigger further popovers. Always show popovers in place. Never place them on top of each other.

Title (2)
We recommend that you show an app-specific title for accessibility reasons. If you do not show a title, use the invisible text control (sap.ui.core.InvisibleText) to set a text for screen reader support.

Close function (3)
This feature closes the dialog. It is available for smartphones only and is set automatically (sap.m.ResponsivePopover).

Content (4)
Ensure that the content has a basic design and shows only the most important information. We recommend the following:

  • Use no more than two groups.
  • Limit the total number of fields to eight.
  • Use single-column tables.
  • Use micro charts.

Actions (5) – optional
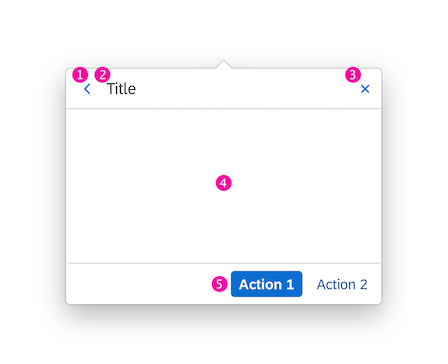
Popover – General structure
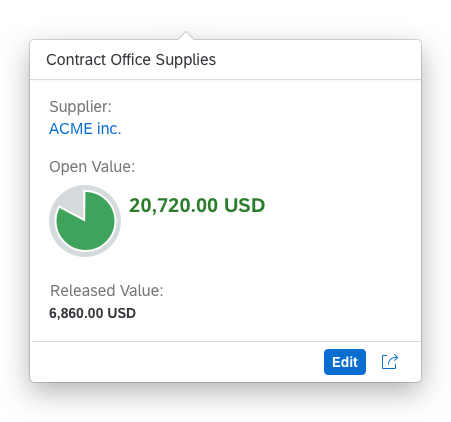
Popover – Example
Popover – Example

Placement Types

The placement type defines how the popover will be positioned on the screen in relation to its trigger. The default placement is “Right”: the popover appears to the right of the object it relates to.

If you set the placement type to “Auto”, the position of the popover in relation to the reference control is determined automatically, depending on the available space.
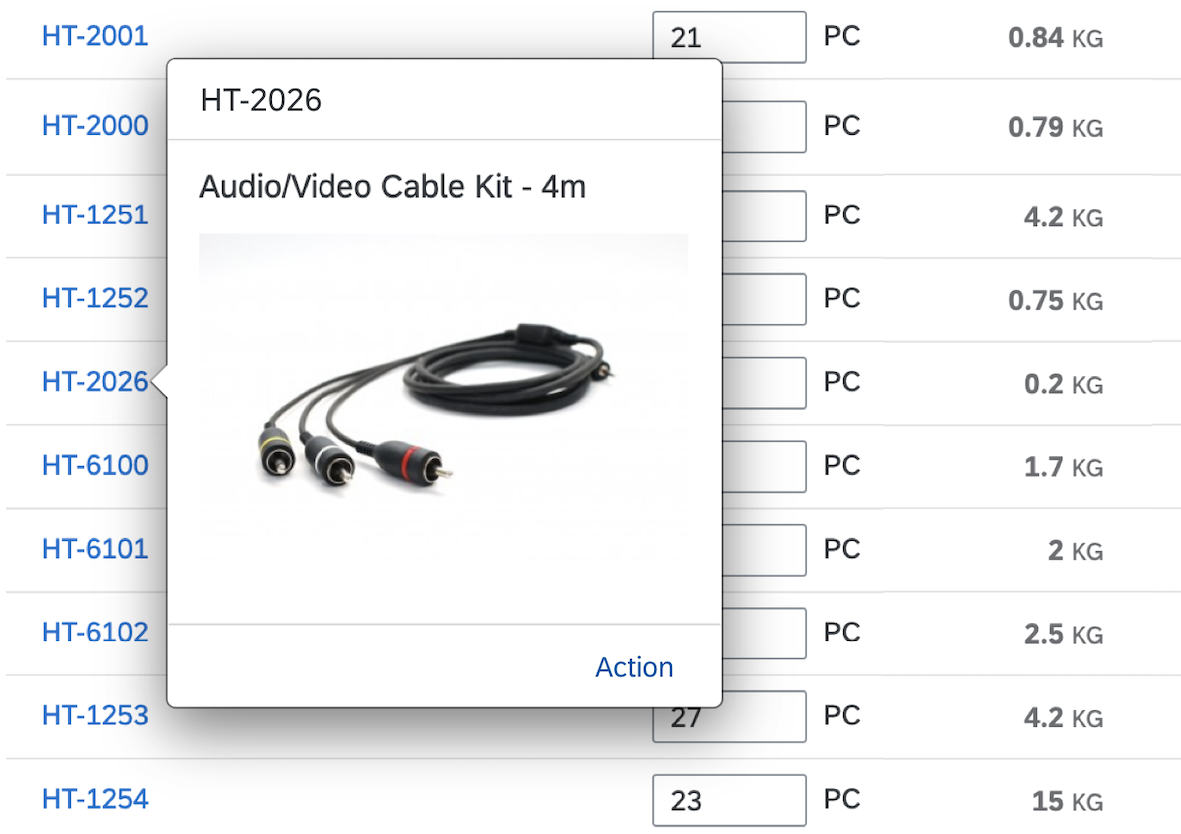
Popover with default placement type - Right
Developer Hint
More information on the different placement types can be found here.

Modal Mode

The popover in modal mode opens in a modal window, which blocks the whole screen and attracts the user’s attention.

Use the modal mode only if you want to prompt the user to make a decision or confirm an action. Ensure that the user can close the popover, either by offering an action button in the footer or a Close button in the header.
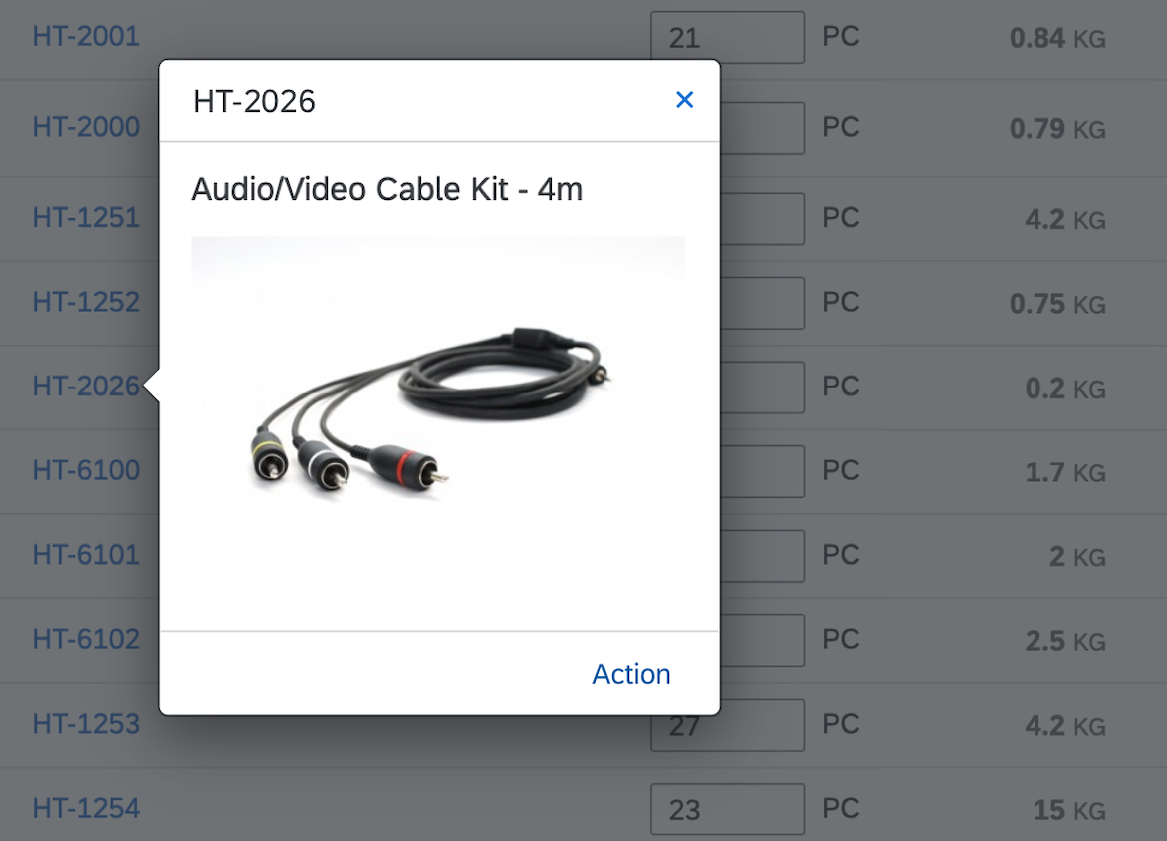
Popover – Modal
Popover – Modal

Behavior and Interaction

Opening a Popover

The user opens a popover by clicking an object represented by a text link or an icon. To improve accessibility, we recommend using texts, such as the name or ID of an object.

Closing a Popover

The popover is closed when the user clicks outside the popover or selects an action within the popover.

Guidelines

  • Show status information as text fields in a content group. You can use semantic text colors.
  • You can define a height for the popover. If the content exceeds the height, a scrollbar is displayed.

Resources

Want to dive deeper? Follow the links below to find out more about related controls, the SAPUI5 implementation, and the visual design.

Elements and Controls

Implementation

Message Popover

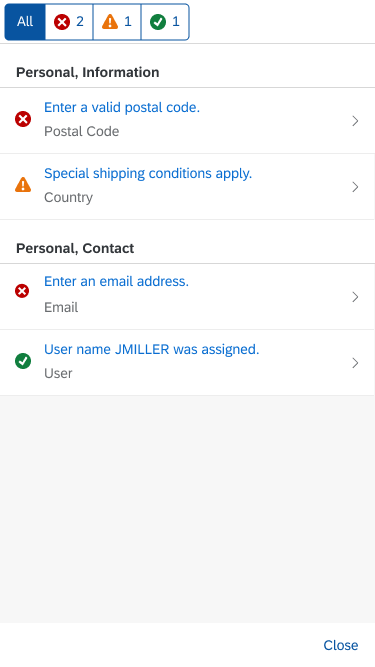
The message popover control can display multiple messages of different types in one list. For example, it might show several messages related to entries in a form, or messages triggered by a finalizing action, such as Save.

The message popover is used in conjunction with a technical message manager, which populates the message list. If an error occurs at a validation point, the corresponding message is added to message popover automatically, without interrupting the user.

Users can browse messages by type and navigate to the message details. In some cases, they can also jump directly from the message to the affected field on the UI.

Message popover
Message popover

When to Use

Use the message popover if:

  • You want to display multiple messages to the user.
  • You do not want to interrupt users while they are performing an action.
  • Form fields are hidden when scrolling and issues may not be visible otherwise.

Do not use the message popover if:

  • You need to interrupt the user. In this case, use a message box.
    (Typically, interrupting the user is only necessary for technical problems, such as network errors and connection issues.)
  • You are using a small dialog. Showing a message popover would obscure important information, such as form fields that are in focus. In this case, rely on highlighting and inline messages to show issues with content fields. For more information, see Input Field.

Components

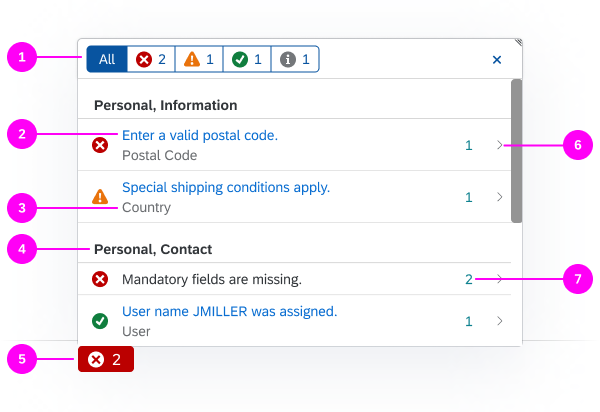
(1) Filter bar
(2) Short description
(3) Subtitle
(4) Section/subsection on the UI
(5) Message button
(6) Navigation to message details
(7) Counter for aggregated messages

Components of the message popover

Filter Bar

Initially, the filter bar shows all the different message types in the list (1).

Segmented buttons at the top of the message popover allow the user to filter the messages by type (error, warning, success, and information).

List

Short Description (2)

A simple and helpful short message text. It’s the same message as the one attached to the UI control where the issue occurred.

Subtitle (3)

You can use the subtitle to give your message an identifier. If the message relates to a specific field, show the label of the field where the error occurred. Based on the subtitle, the user should be able to identify the corresponding UI control on the UI (for example, the input field in a form).

When issues are in a table, the subtitle area can contain the identifiers of the row and column containing the issue (see Messaging for Tables).

Section/Subsection (4)

Messages in the list are grouped by the section and subsection on the UI. This helps the user to find the part of the UI that triggered the message.

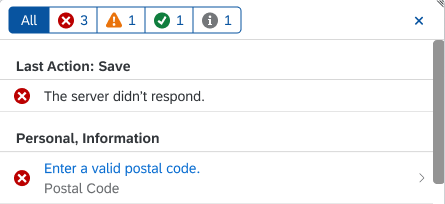
Usually, the grouping reflects the hierarchy of the page. However, some messages relate to issues that do not belong to a particular field on a page, but result from an action. In this case, the group title is as follows:

  • Last Action: <Action Label> (Example: Last Action: Save)
  • Last Action (fallback solution)

When issues are in a table, the group header can contain the table name, along with title of the page section (see Messaging for Tables).

'Last Action' group in the message list

Navigation to Message Details (6)

If message details are provided, the message popover automatically provides a chevron on the right-hand side for navigating to the message details page.

If the popover contains only one message that also has message details, the message details page is displayed by default (see Behavior and Interaction).

Aggregated Messages (7)

If you want to aggregate messages, you can use the counter property of each list item.

  • The message popover only provides the counter property. The aggregation itself must be implemented by the app team.
  • When 2 or more messages are aggregated, the message short text cannot be a link because there would be multiple targets.

Message Button

If there are messages to display, the message button indicates the most critical message status in the list (5).

For example, if the list contains error messages, the message button inherits the error icon and semantic color. If the most critical message in the list is a warning, the message button shows the warning icon and corresponding semantic color, and so on.

In addition, the button contains a count indicating the number of messages of the most critical type.

Message button types - Error, warning, success, information

If there are no messages to display, there is no message button. In this case, the footer toolbar contains only the “normal” actions for the task.

Message Details

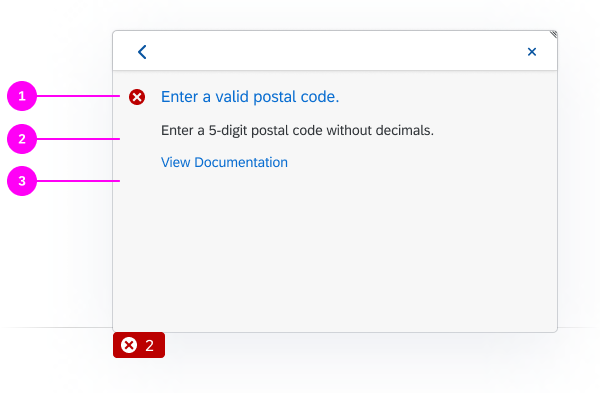
The message details page shows:

  • The message short text (1).
  • A more detailed message text to explain the issue and propose a solution (2).
  • An optional link to more information, such as app documentation (3).
Details page of the message popover

Messaging for Tables

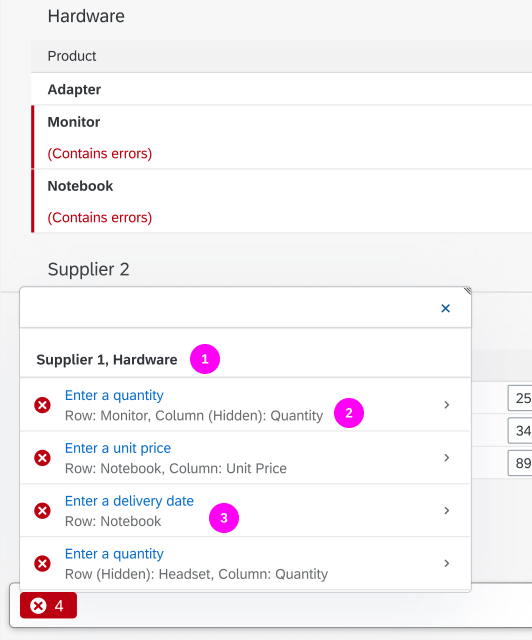
The message popover includes information for locating issues in tables.

  • The group header contains the section name and table name (1). If the issue appears in a specific view, the group header also contains the view name.
  • The subtitle shows the identifiers of the row and column containing the issue (2).
    • If the row or column is currently hidden (for example, by table personalization), a “Hidden” text is shown.
    • If the field doesn’t show in the table itself but is part of a sub-object, only the row identifier is displayed (3).
Message popover displaying messages for a table

Behavior and Interaction

When Does the Message Popover Open?

Form Field Validation

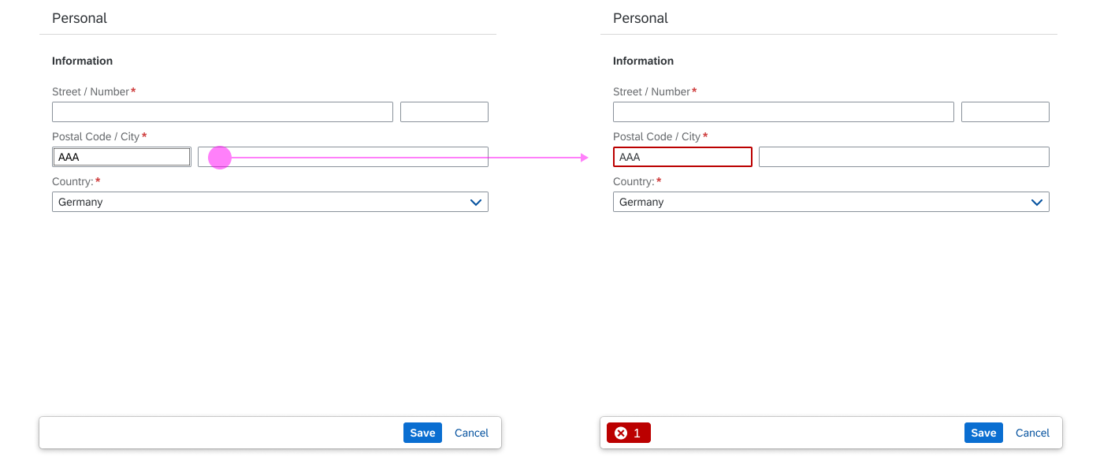
If one or more errors occur when the user fills out a form, the message button appears, indicating the message type of the most critical message. The message popover does not open automatically. For more information on the different validation points, see Form Field Validation.

Form field validation behavior

Finalizing Actions

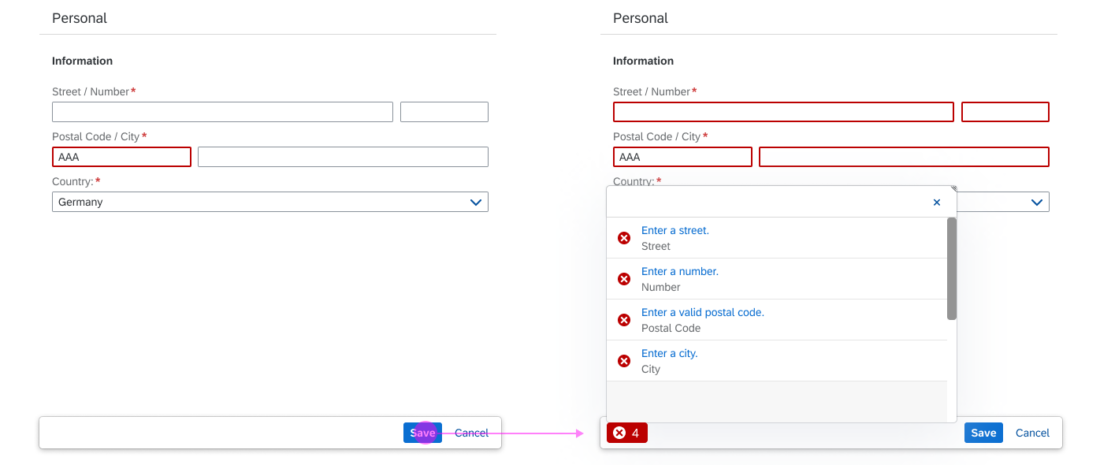
If the user activates a finalizing action (such as Create, Save, or Submit), the message popover opens automatically to inform the user about the errors on the UI that need to be resolved first.

Message popover triggered by a finalizing 'Save' action

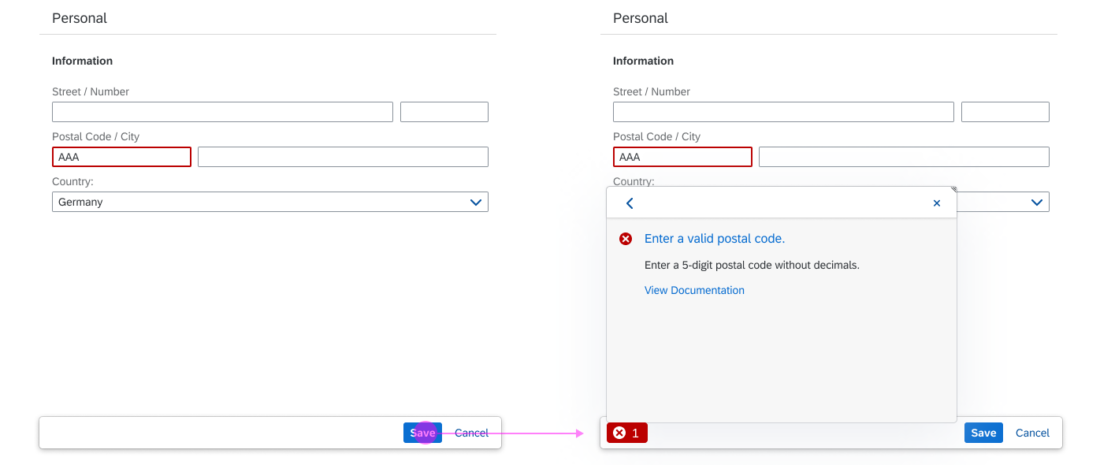
If the popover contains only one message that also has message details, the message details page is displayed by default.

Message popover detailed view triggered by a finalizing 'Save' action

Navigation to Message Details

If the message provides a long text from the back-end system, the user can navigate to the message details. There, the user will typically find more information and help.

Navigation to message details

Navigation to the Relevant Field

In-Page Navigation

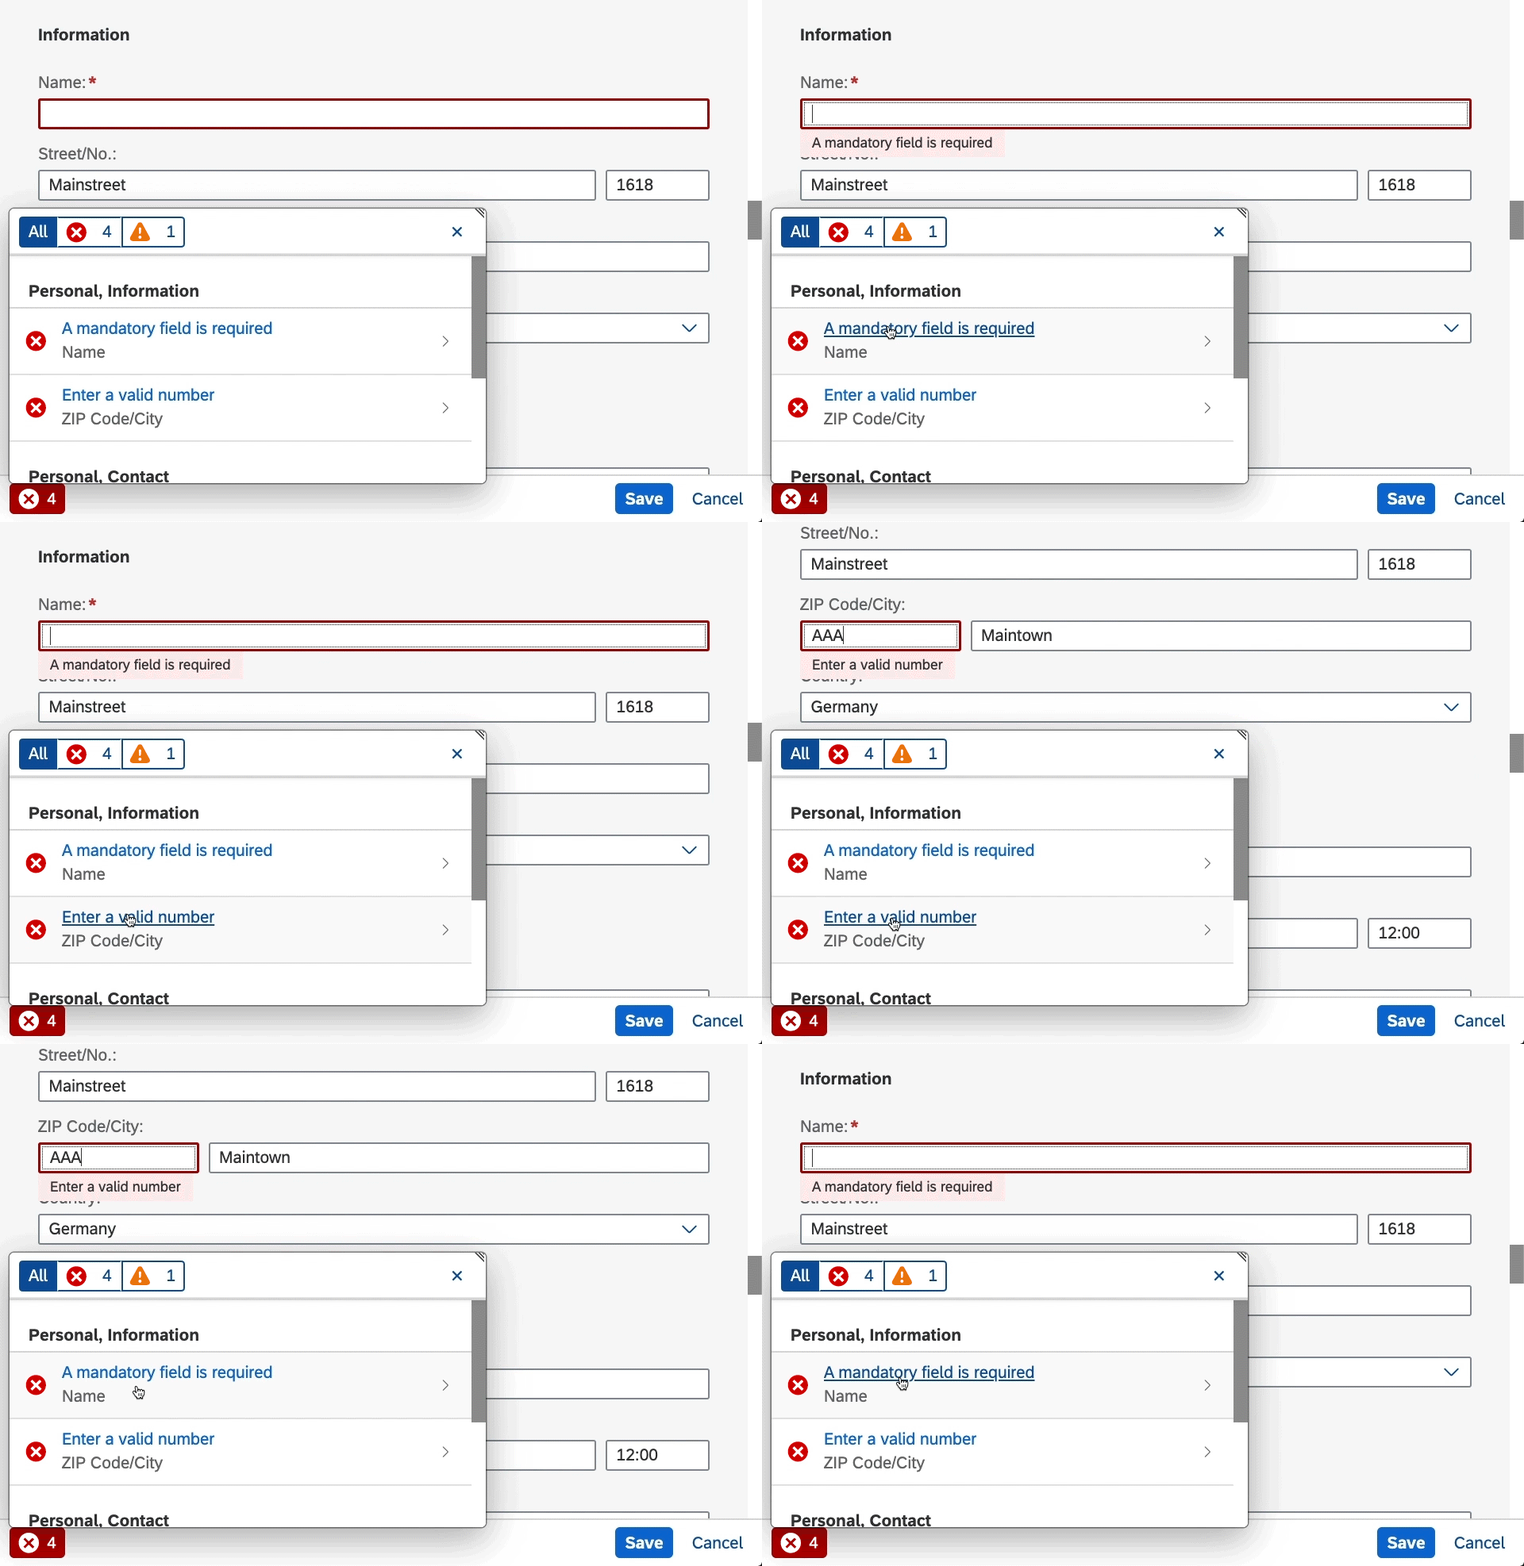
The navigation link takes users directly to the field on the UI that triggered the message. This can be a field in the visible area, a field somewhere else on the same page, or a field on another tab or screen.

Guidelines
Always add a navigation link, where possible.
Developer Hint
Set the navigation link with the activeTitlePress event. This allows users to click the message text in both the first and second page of the message popover.
Navigation from the message text to a field on the UI

Navigation to a Sub-Object or an External Page

Some errors are not visible on the page where the message popover is. They can be located on a sub-object page (an item of a table, for instance), or have a dependency in an external application.

If that’s the case, the navigation link leads to the target page with focus on the affected field.

If possible, provide a breadcrumb navigation on the target page. Also make sure that the back button of the shell bar leads back to the page where the message popover was.

Navigtion from the message text to a sub-object page

Responsiveness

Size S (Smartphone)

On smartphones, the message popover is automatically shown in full screen mode.

Full screen message popover on a smartphone

Top Tips

  • Whenever possible, provide a navigation link from the message to the relevant field on the UI.
  • Use the message subtitle to indicate the field label.
  • In forms, also highlight the individual fields, and change their value state according to the type of message. For more information, see Form Field Validation.

Related Topics

Elements and Controls

Implementation

Grid Table

A grid table contains a set of data that is structured in rows and columns. It allows users to scroll in both directions and is optimized for handling large numbers of rows and columns.

Usage

Use the grid table if:

  • The cell level and the spatial relationship between cells are more important than the line item. Examples include spreadsheet analyses and waterfall charts. Note that a grid table is not fully responsive. It is only available for desktops and tablets, so you will need to take an adaptive approach by offering an additional UI for smartphones.
  • You need a table to display large amounts of complex data. The grid table can handle higher volumes more efficiently than the responsive table.

The responsive table can handle around 200 items when data is of average complexity — more items when data is less complex and fewer when data is more complex. If your scenario exceeds these data limits, use the grid table. Factors that influence the exact limit include:

    • The number of loaded rows in the table
    • The number of displayed columns
    • The complexity of the cell content (for example, simple text vs. complex charts)
    • Other elements on the page (for example, multiple pages in a flexible column layout, or several tables/elements with more complex rendering on the page)
    • The browser used
  • Comparing items is a major use case. In this case, a grid table might be more appropriate than a responsive table. In the grid table, each cell contains only one data point. In contrast, the responsive table is more flexible regarding line items, including the ability to add more data points per cell and also the pop-in function. Both make comparisons more difficult.
  • You’re going to implement inline creation and the sequence in which the items are created is important – the grid table creates new items at the bottom of the table.
  • Your use case is for tasks performed on a desktop or tablet device. The grid table is not fully responsive.

Do not use the grid table if:

  • You expect users to work with moderate amounts of data. Note that this is about the data actually loaded — not the items in the database or the filtered results — which includes the number of items as well as the complexity of the data displayed. In these cases, consider the responsive table.

Additional use cases where you might need the responsive table include:

    • The focus is on working on line items, not on cells. The responsive table is optimized for displaying complete items on all devices, such as file browsing and a list of documents you want to act on, like purchase orders and purchase requisitions.
    • Selecting one or several items is the main use case and details are needed to choose the correct item.
    • Line items are independent of each other and no operation across columns is needed.
    • You want to have only one implementation for all devices. However, make sure you adapt the responsive table design to offer the best solution for the tasks performed on mobile devices. Sometimes, a solution without a table is more useful and usable.
  • The main use case is choosing one item from a very small number of items with no additional details. A select or combo box might be more appropriate.
  • The main use case is choosing one out of several items with only a few details per item. A list might be more appropriate. Pay attention to the layout of the list item to ensure that it has a pleasant appearance.
  • Data needs to be structured in a hierarchical manner. Use a tree table instead. Note that neither the tree table nor the grid table are responsive. You will need to take an adaptive approach by offering an additional UI for smartphones and tablets.
  • You need an overview of a large amount of data. In this case, use charts.
  • You just need it for layout reasons. In this case, use a layout container such as HBox or VBox.
  • You need read-only or editable field-value pairs. Use a form instead. The grid table is not optimized for form-like input navigation.

Responsiveness

A grid table is not fully responsive, but available for only desktops and tablets, and it supports touch interactions. For mobile use cases, you need to:​

  • Create a new Fiori application with reduced complexity, not an exact match of the desktop application.
  • With the new application, address the most important use cases for users in a mobile context. The responsive controls (responsive tablelist or tree,) or a relevant control for your use case (for example a chart or the category navigation pattern) may suffice.

Or, you could create a fallback by using a responsive table, but a completely different solution, such as showing charts in a read-only case, might be more appropriate.

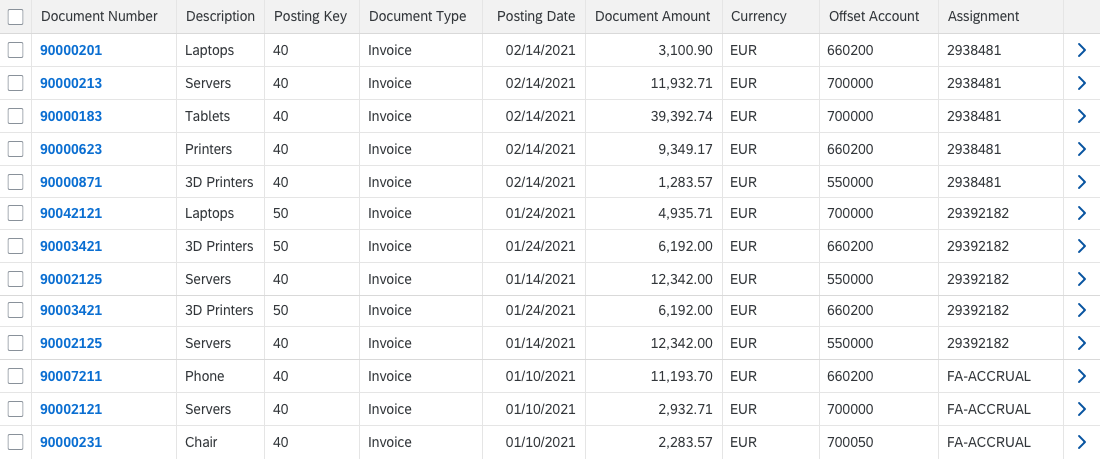
Grid table shown on a desktop
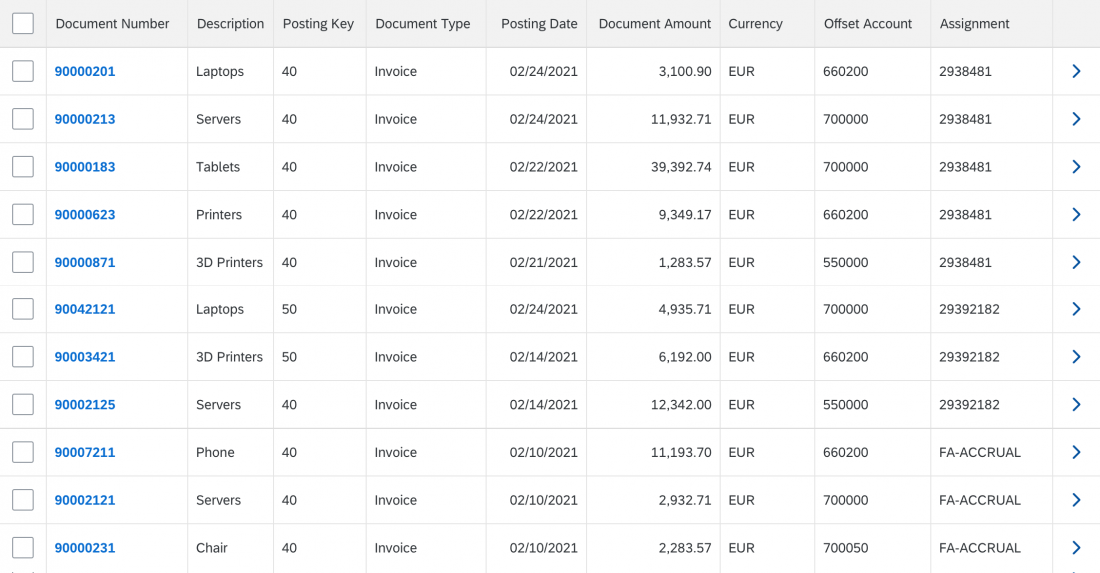
Grid table shown on a tablet

Layout

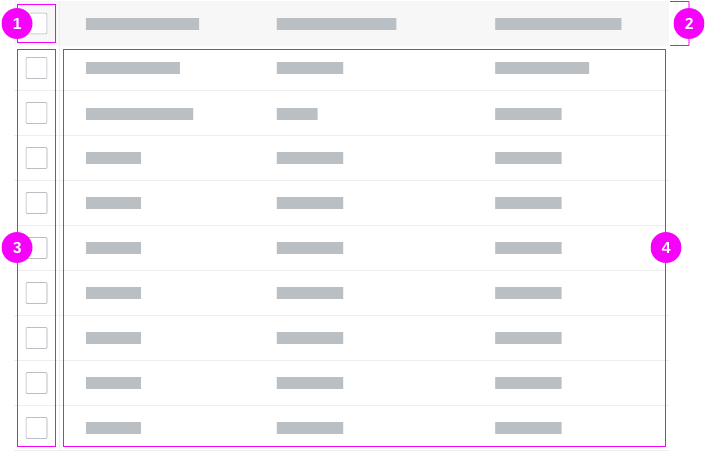
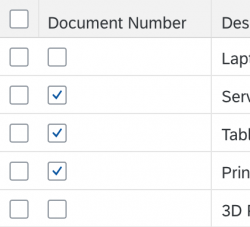
  1. Select All – The Select All checkbox selects or deselects all items.
  2. Column header – The column header allows the user to resize and rearrange columns. It also provides access to a menu with column-specific commands.
  3. Selector cells – The selector cells allow the user to select one or more items.
  4. Items – The collection of items, or rows, occupies the main part of the grid table.
Schematic visualization of the grid table

Components

A grid table does not consist of other elements. However, it is common to use a toolbar above the grid table.

The toolbar can contain entry points for the view settings dialog and the table personalization dialog or for the p13n dialog, as well as view switches in the form of a segmented button, and buttons for Add, Edit, and other actions.

Behavior and Interaction

A grid table is quite restricted in terms of its content.

Table Level

Scroll

A grid table allows horizontal and vertical scrolling (sap.ui.table.Table, property: navigationMode, value: Scrollbar).

You can add any number of line items to the grid table, which uses “lazy loading”.

To prevent adverse side effects when scrolling vertically, all line items must have the same height (sap.ui.table.Table, property: rowHeight).

The grid table is optimized to allow faster scrolling within the first 1000 items.

Scrollbar
Scrollbar

Select

Selection Mode

Selection for a grid table depends on the chosen selection mode. The following options are available:

No selection: Items cannot be selected. (property: selectionMode = None)

A non-selection grid table

Single selection: One item in the grid table can be selected. A row selector column is shown. (property: selectionMode = Single)

A single-selection grid table

Multiple selection: One or more items can be selected. The grid table provides a column with checkboxes on the left-hand side. Clicking a checkbox toggles the state of the corresponding row from deselected to selected and back. The Shift key can be used to select a range.

For multiple selection, you can choose between two variants.

  • Multi-toggle mode (property: selectionMode = MultiToggle)
  • Multi-selection plug-in (sap.ui.table.plugins.MultiSelectionPlugin)

These variants behave differently when the user selects more items than are currently loaded in the front end.

Multi-toggle

In multi-toggle mode, you can offer a Select All checkbox to the left of the column header (property: enableSelectAll). Selecting this checkbox selects or deselects all items that are currently loaded in the front end (keyboard: CTRL+A). All other items are not selected/deselected. If the application data is stored in the back end, scrolling down further can reveal additional unselected items. The same can happen with range selections if not all items in the selected range have been loaded to the front end.

Multi-selection plug-in

If you use this plug-in instead of the multi-toggle selection mode, the behavior for range selection and Select All changes:

  • By default, a dedicated Deselect All button replaces the Select All checkbox. There is no default UI element for selecting all items.
  • You can set a limit for the number of items that can be selected (sap.ui.table.plugins.MultiSelectionPlugin, property: limit). This limit has the following effect:
    • The range that can be selected using the Shift key is limited to the specified number of items (default = 200). The table automatically scrolls back to the last selected item and you can display a corresponding message (sap.ui.table.plugins.MultiSelectionPlugin, property: enableNotification). Users can select more items by selecting additional ranges (the specified limit applies each time).
    • If the selection limit is set to 0, a Select All checkbox is shown. There is also no limit on the number of items that can be selected in a range. All selected items are loaded, which can lead to performance issues for large data sets. (Keyboard: CTRL+A)
  • If selected items are not already available in the front end, they are loaded automatically by the plug-in and set as selected.
Information
When setting a limit for the number of items that can be selected, keep the following boundaries in mind:

  • The performance of your service: How many items can be loaded at once in a reasonable time? Does this also apply if an end-user shows all available columns?
  • The “minimum limit”: Internally, the grid table loads blocks of items as the user scrolls down. Because this block size (sap.ui.table.Table, property: threshold) is usually also based on the performance of the service, it should be safe to assume that the minimum selection limit is twice this size. In this case, loading the data would take as long as scrolling down and loading exactly one more block. Nevertheless, we recommend using larger limits if your service allows.

A multiselection grid table
Using the multi-selection plug-in with a limit

Selection Behavior

An item can be selected in different ways, depending on the configuration of the grid table (sap.ui.table.Table, property: selectionBehavior):

  • Row: An item is selected by clicking the checkbox or the row. Use this option for multi-selection grid tables if clicking a row or a cell is not used for anything else.
  • RowSelector: An item is selected only by clicking the checkbox in the selector cell. Use this option if clicking the row (or a cell inside the row) is used for something else, such as navigation.
  • RowOnly: An item is selected only by clicking the row, and not using checkboxes in the selector cells. Use this for single-selection grid tables if clicking a row or a cell is not used for another purpose, such as navigation.

Compact, Cozy, and Condensed

Like all SAP Fiori controls, the grid table is shown in compact mode on a desktop and in cozy mode on tablets.

For a desktop, you can also display even more rows on the same screen height by adding the condensed mode in addition to the compact mode. This renders less white space for each item.

Note that the condensed content density has always to be set in addition to compact. Do not use condensed on its own. Do not mix condensed with cozy. Doing so could lead to unpredictable and / or unwanted results, e.g. cozy sized controls in condensed sized containers, missing paddings, etc.

Note that neither compact mode nor condensed mode can be interacted with via touch. Even on a desktop with a touch screen, users will have difficulty selecting rows or using controls inside the cells when using their fingers.

Furthermore, condensed mode is not available for Internet Explorer 9. If condensed mode is to be used, please provide a fallback.

For more information on cozy and compact modes, see content density.

Column Header

The column header provides the label for the corresponding column and access to the column header menu.

Columns are resized as follows:

  • Mouse interaction: The user drags the separator line between two columns (sap.ui.table.Column, property: Resizable). Double-clicking the line optimizes the column according to the length of the currently visible data and the label of the column header (sap.ui.table.Column, property: Autoresizable).
  • Touch interaction: The user taps the column header to reveal two buttons – one to show the column header menu, and one for resizing. The user drags the latter to resize the column.
  • Keyboard interaction: The width of the focused column header can be increased via Shift+Right and decreased via Shift+Left.

After resizing a column, the adaptation of the column widths depends on how the column width is set:

  • If column widths are set in pixel-based units (px, em, rem), the corresponding column is adapted and the columns that follow are moved accordingly. The width of all other columns is not affected.
    If all the columns together take up less width than the table control, an empty space is added. In case all columns together take up more width than the table control, a scrollbar appears. (sap.ui.table.Column, property: width)
  • If all column widths are set in percentage or “auto”, resizing one column might also lead to the automatic resizing of some or all other columns. The position of the resized column might also be affected. This is done to ensure that the whole table width is used and no white space is added. A scrollbar appears only if all or most of the columns shrink significantly. To avoid the side effect of undersized columns, a minimum width can be set per column. Please be aware that this minimum width is only taken into account if columns are automatically resized. End users are still able to reduce the column width below the provided minimum. (sap.ui.table.Column, properties: width, minWidth)

Columns can be rearranged by dragging the column header to another position (sap.ui.table.Table, property: enableColumnReordering). Keyboard: the focused column header can be moved by one position in the corresponding direction via Ctrl+Left / Ctrl+Right.

Column header
Column header
Opening the column header menu on touch devices
Fewer columns than space available

Column Header Menu

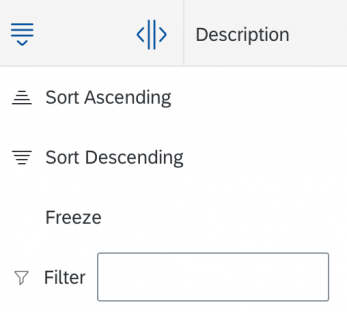
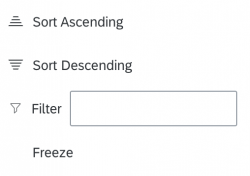
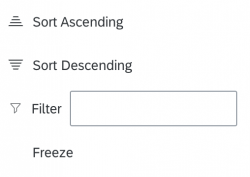
For each column, a menu can contain the following menu items (sap.ui.table.ColumnMenu, property: visible):

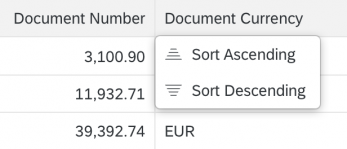
  • Sort Ascending/Descending (sap.ui.table.Column, property: showSortMenuEntries)
  • Free text filter (sap.ui.table.Column, property: showFilterMenuEntries)
  • Freeze from the first to the last specified column (sap.ui.table.Table, property: enableColumnFreeze)

For each column, the menu can be replaced by an app-specific menu.

Column header menu
Column header menu

Sort

The column header menu can provide two sort options (sap.ui.table. Column, properties: sortProperty, showSortMenuEntry):

  • Sort Ascending
  • Sort Descending

The user selects one of these options to sort the corresponding column accordingly (sap.ui.table. Column, properties: sorted, sortOrder, sortProperty).

Sort settings in column header menu

Filter

The column header menu can provide a search field for entering free text (sap.ui.table.Column, properties: filterProperty, showFilterMenuEntries).

If the user enters a term in the input field and triggers the search by pressing Enter when the focus is on the filter input field, the grid table is filtered by the corresponding column and value (sap.ui.table.Table, properties: filtered, filterProperty, filterValue, filterOperator, sap.ui.table.Column, property: filterType).

Note that the filter may return zero results, in which case, the table might be empty.

General recommendations for filtering:

  • If filtering is a main use case, choose the filter bar or any other filtering UI over the built-in free text filter.
  • Only use the free text filter if filtering is a secondary use case and if the filter bar is too heavy.
Free text filter in column header menu

Freeze Columns

The column header menu can provide the option to freeze columns (sap.ui.table.Table, property: enableColumnFreeze). Selecting Freeze freezes all columns up to the one in which the operation was triggered (sap.ui.table. Table, property: fixedColumnCount).

When Freeze is triggered, the menu item changes to Unfreeze for the corresponding column.

Freeze setting in column header menu

Line Item Level

A line item contains a set of cells and provides options for selecting the item.

To prevent adverse side effects when scrolling vertically, all line items must have the same height (sap.ui.table.Table, property: rowHeight).

Line item
Line item

Drag and Drop

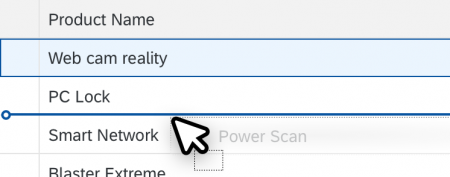
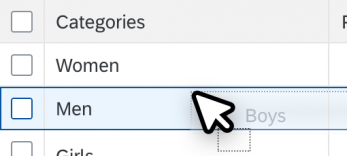
One or several items can be repositioned within a table or moved to other UI elements using drag and drop operations (sap.ui.table.Table, aggregation: dragDropConfig). While being dragged, the items are shown as ghost elements on the mouse cursor.

Drop targets can be on items, between items, or both (sap.ui.core.dnd.DropPosition). On a drop target, the mouse cursor changes to either a “copy”, “link”, “move”, or “none” cursor. “None” indicates that the dragged item cannot be dropped in the current position (sap.ui.core.dnd.DropEffect).

Drag and drop is only available on supporting browsers.

Drag and drop
Drag and drop
Whole item as drop target

Context Menu

You can attach a context menu (sap.m.Menu) to a table. The context menu gives users an alternative way to modify the focused elements by giving them access to context-specific functions.

When opened, the context menu gets the row and column context, except for special columns (such as the selection column) or special rows. Context menus can be implemented for a specific table, row, or cell (not recommended for editable cells).

Context menus are opened by right-clicking (desktop), long press (mobile), the context menu key, or Shift+F10.

Be aware that using the context menu overrides the browser context menu, which can no longer be opened.

If a control inside a table is the “click target”, and the control also provides a context menu, the control context menu “wins”.

Grid table with a context menu

Cell Level

A cell provides one data point and can contain one of the following controls:

We recommend against using other controls to prevent issues with alignment, condensed mode, screen reader support, and keyboard support.

Cell
Cell

Guidelines

Data Density vs. Complexity

The grid table can be used to display large amounts of data. Unfortunately, the grid table has a high data density and therefore conveys an immediate feeling of complexity.

Only show tables with a lot of data as a last resort. Try the following instead:

  • Break down the data into manageable chunks and allow the user to navigate or drill down between them.
  • Use charts with drilldown functionality until the amount of data is more manageable.

Try to avoid horizontal scrolling in the default delivery.

Try to minimize the number of columns, especially if there is a large number of rows.

Table Title

Implement the table title by using a title control in a toolbar.

Use a table title only if the title of the table is not indicated in the surrounding area.

Do not use a table title if it simply repeats text that is already above the table. For example:

  • A pricing conditions table is the only control on a tab labeled Pricing Conditions.
  • A section or subsection on an object page contains only one table.

Use a table title if you need the item count, table toolbar, or variant management. To avoid repeating text, feel free to use generic text as a table title, such as Items.
Exception: If the surrounding area contains the table title, and both the item count and toolbar can be added to the surrounding area, no additional table title is needed.
Example: An object page (sub-)section contains only one table. In this case, add the item count and the table toolbar to the (sub-)section header.

If you use a table title, show either a title for the table, with or without variant management, or an item count in the following format:

Items (2,534).

The item count in the table title includes all the visible items that a user can reach by scrolling.

Remove the item count in the table title if there are zero items.

Developer Hint
Assistive technologies (such as screen readers) use the title to create a hierarchical site map for faster navigation. In addition, screen readers use the title as the label for the table.

If you don’t use a title (for example, to avoid repetition), make sure that the table is connected to another meaningful on-screen text that can be used as a label for assistive technologies. You can do this using the method addAriaLabelledBy.

Selection

Single Selection

For single-selection list-detail scenarios within the flexible column layout, do not show an additional “navigated” indicator.

Multiple Selection

  • We strongly recommend using the multi-selection plug-in. This ensures that all items selected using Select All or as part of a range are included – even if some items were not initially loaded in the front end. This is not the case if you use the multi-toggle option.
  • Do not limit the range selection for the multi-selection plug-in unless you have to.
    • If the dataset is small and/or completely available in the front-end, set the limit property to 0 to enable the Select All option and allow users to select any range.
    • If you have a large dataset, set a limit on the number of selected items to avoid performance issues. Also bear in mind that some actions won’t be helpful if the dataset is too big (for example, a delete operation on 2 million database entries).
  • If you set a limit, also display the corresponding message when the user selects more items at once than the limit allows (sap.ui.table.plugins.MultiSelectionPlugin, property: enableNotification).
Information
When setting a limit for the number of items that can be selected, keep the following boundaries in mind:

  • The performance of your service: How many items can be loaded at once in a reasonable time? Does this also apply if an end-user shows all available columns?
  • The “minimum limit”: Internally, the grid table loads blocks of items as the user scrolls down. Because this block size is usually also based on the performance of the service, it should be safe to assume that the minimum selection limit is twice this size. In this case, loading the data would take as long as scrolling down and loading exactly one more block. Nevertheless, we recommend using larger limits if your service allows.

  • In multiple selection mode (multi toggle), do not show checkboxes in the first data column in the default delivery to avoid confusion.
Don't
Do not add checkboxes to the first data column in the default delivery
  • Never disable the selection checkbox. If an action can’t be performed on a specific item, inform the user after the corresponding action has been triggered. For more information, see Enabling/Disabling Actions.

Loading Data

To indicate that the table is currently loading items, use the busy state. (sap.ui.table.Table, property: busy). Do not show any items or text. As soon as the data is loaded, remove the busy state and show all items.

Grid table in busy state while loading data

Errors and Warnings

To indicate that the table contains items with errors or warnings, show a message strip above the table. On the message strip, provide information about errors or warnings. When issues are solved or when new issues appear, update the message strip accordingly.

To indicate an error in a single row, see Item States below.

For details on displaying errors, warnings, and other messages, see Message Handling.

Developer Hint
The sap.m.plugins.DataStateIndicator displays a message strip above the table, which shows binding-related messages.
Table containing errors and warnings

Columns – Best Practices

Minimize the number of columns. Avoid the need to scroll horizontally in the default delivery.

The grid table assigns the same width to each column by default. It is recommended that you overwrite this default to provide optimal space for your content (sap.ui.table.Column, property: width).

If you define the column width in pixels or rems, resizing a column affects only the width of this specific column. Reducing the browser window size results in a scrollbar. After resizing a column, a scrollbar appears if the width of the table is not enough to show all columns. If the columns use less space than available, white space appears on the right side of the last column.

If you define the column width as a percentage, resizing one column affects the width of several or all columns. Text becomes truncated when the browser window size is reduced. This is done to make sure that all columns together fill the space of the table. A scrollbar appears only in case the automatic change of the column widths is not enough for showing all columns. To avoid the side effect of undersized columns, a minimum width can be set per column. Please be aware that this minimum width is only taken into account if columns are automatically resized. End users are still able to reduce the column width below the provided minimum.

If you define the column width as “auto”, the behavior is the same as for “percentage”. In contrast to percentage, “auto” distributes the columns equally.

To decide on how to set the column width (pixel / rem / em vs. percent / auto), keep the following in mind:

  • For tables with only 2 to 3 columns, use pixel-based units. This ensures that on wide screens the values in the columns are not spread over the whole screen, which improves the readability of line items.
  • For tables with many columns, where a horizontal scrollbar is usually needed, use pixel-based units. This avoids unintended side effects when resizing columns.
  • For all other tables, use whatever fits your case better.

Be cautious with mixing columns with pixel-based and percentage-based widths. While this can be helpful in some cases, it could also cause even more unexpected side effects when resizing a column. When using percentage-based widths for one or more columns, think of the possibility to not allow end users to resize columns at all.

Optimize the column width for its initial visible content, including the column header texts. If this is not possible (for example, if showing the full texts would result in extremely wide columns), let the texts truncate. End users can change the width of the column to read the full text, as needed.

Maintain a constant column width and avoid adjusting it automatically when the content changes.

Always keep to one line of text. Do not wrap.

Don't
Don't truncate the initial visible content in the default delivery
Don't
Never wrap texts
Never wrap texts

Column Headers – Best Practices

For each column, provide a label in the column header. In the default delivery, do not truncate the column header texts. Only let the text truncate if showing the full text would make the column too wide. Never wrap the text.

Content Alignment

For alignment of cell content, follow the guidelines below.

Left-align the following: text, IDs, phone numbers, URLs, passwords, and email addresses.

Left-alignment of text

Right-align numbers (except IDs).

This ensures comparability of numbers and amounts.

Right-alignment of numbers

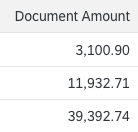
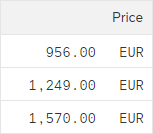
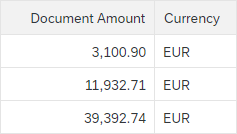
Right-align amounts with currencies to the cell and align them in terms of their respective decimal points.

This ensures that amounts with different currencies are shown correctly, whether these currencies have 0, 2, or 3 decimals.

For aligning to the decimal point, use the sap.ui.uinified.Currency control.

Alignment to decimal point

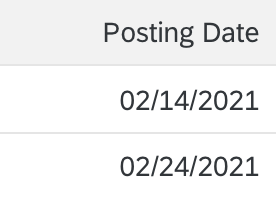
Right-align dates and times.

This ensures comparability for most formats and locales.

Right-alignment of dates

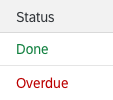
Left-align status information.

Left-align status information

Center-align icons.

Left-align micro charts.

XS micro charts in condensed mode

Content Formatting

Locale Settings

Be locale-aware: show dates, times, numbers, and so on in the format corresponding to the user’s locale settings.

Key Identifier

Use a bold label or an emphasized link as the key identifier of an item. In the default delivery, show the key identifier in the first column.

Emphasized link
Emphasized link

For strings with IDs, use one of the following options:

  • Show the ID in a separate column. Use this format if users need to sort, or if they need to filter by both the string and the ID.
  • Show the ID in parentheses after the corresponding string. In this case, you must opt for one criterion for sorting and filtering, either the string or the ID. This option is then used for all sort and filter actions and can’t be changed later by the user. Use this format only if users don’t need to sort and filter by both the string and the ID.
Text and ID in two columns – Allows users to sort and filter both separately
If displayed as a link, use only the text as the link, not the ID
Text and ID in one column – Sorting and filtering is available for either the text or the ID, but not for both
Text and ID in one column - If displaying a link, show the whole string as the link (text and ID)

Truncation

Avoid truncation of typical content in the default delivery (sap.ui.table.Column, property: width). However, since the columns are resizable, do not worry too much if truncation occurs as columns can still be enlarged if necessary.

To prevent adverse side effects when scrolling vertically, all line items must also have the same height. If you need to decide between truncation and different row heights, choose truncation. Do not wrap.

Optimize column width for typical content, not all content

Number of Links

Are there too many links? Use subtle links to avoid a wall of links. Standard links are also emphasized more if they are surrounded by subtle links.

Emphasized links, links, subtle links, and text

Missing Value

If there is no value for a cell, leave it blank. Do not display text as N/A.

Leave empty fields blank

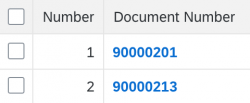
Numbering Items

In terms of numbering items:

  • If the item number is more like an ID with regard to its description, use ID formatting as described above.
  • In all other cases, use a separate column for the item number.
Add a separate column for the item number

Status

For status information, use semantic colors on the foreground elements.

For status information on text, use an object status.

Semantic colors on text

Micro Charts

Use only the following micro charts: Bulletcomparisonstacked bar. When using micro charts, use them in size XS.

Micro charts in a grid table

Empty Tables

Avoid empty grid tables. If necessary, provide instructions on how to fill the grid table with data (sap.ui.table.Table, properties: noDataText, showNoData).

Examples:

  • If a table is initially empty, provide at least a basic text:
    No items available.
    Overwrite this whenever a hint can be provided on how to fill the table with data.
  • If a table is used together with a filter bar (as in the list report), and is initially empty, use the following text:
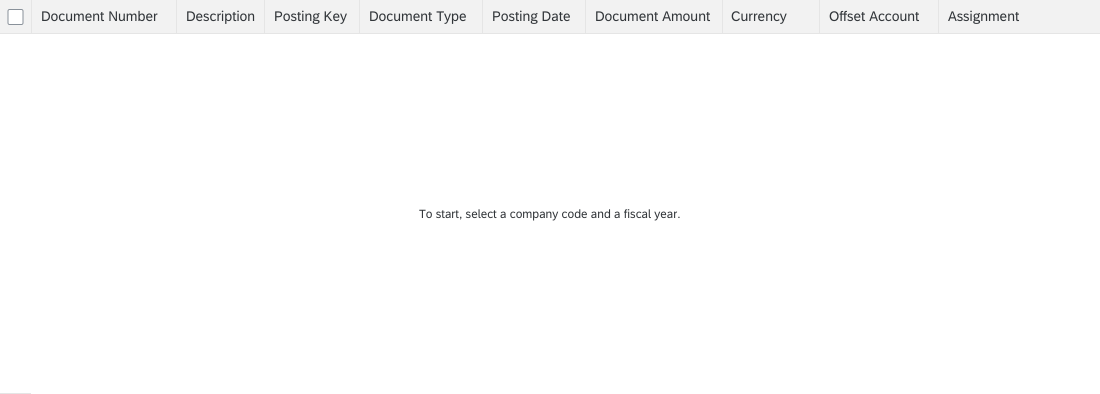
    To start, set the relevant filters.
  • If a table is used together with a filter bar and the filter does not return results, use the following text:
    No data found. Try adjusting the filter settings.

Adapt the texts above if:

  • The standard text is not precise enough for your use case (for example, a search is also offered, or only the search is offered).
  • The standard text is misleading (for example, if the data is filled based on a list-detail pattern instead of filter settings).
Provide meaningful instructions

Invalid State

To show an invalid state of the grid table within the list report floorplan, show an overlay on the grid table and the corresponding toolbar (sap.ui.table.Table, property: showOverlay). The overlay prevents user interactions.

Use this within the list report floorplan if filter settings have been changed but the grid table is has not yet been updated.

Grid table with invalid data

Item States

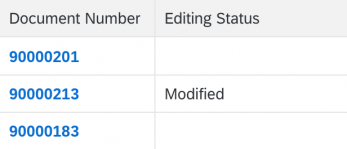
To show that an item has been modified, for example, within the global edit flow, add the string Modified in an additional column with the label Editing Status.

In the default delivery, add a column directly behind the key identifier.

A modified item
A modified item

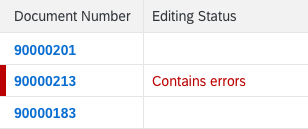
To show that a modified item contains an error, for example, within the global edit flow, add the string Contains errors in the Editing Status column and highlight the row accordingly. This string replaces the Modified string.

A row with errors should be highlighted in all use cases – for example when the field is visible in the row in edit mode.

A modified item with an error

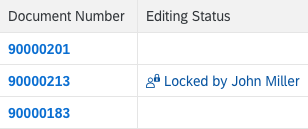
To show that an item is locked, add a transparent-style button with the corresponding icon and the text Locked by [name] in the Editing Status column.

A locked item
A locked item

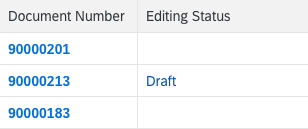
To show that an item is in draft state, add a transparent-style button with the text Draft in the Editing Status column.

Item in draft state
Item in draft state

Show only one state at a time.

Numbers and Units

Show the unit of measurement in one of the following ways:

Number and Unit in Same Cell

The number and the unit are in the same cell. Do this if sorting and filtering by the unit of measurement are not needed.

For amounts, use a currency control to display the concatenated string.

Number and unit of measurement in one cell

Number and Unit in Separate Columns

The number and unit are in separate columns. Do this if sorting and filtering by the unit of measurement are a common use case.

Note that this column can be hidden or moved independently of the column containing the corresponding number. Therefore, be sure to have clear labels for both columns to communicate the dependency.

Number and unit of measurement in two columns

Show the unit of measurment on the column header, if the unit of measurement is the same for all rows. If not, show the unit of measurement within the row.

Drag and Drop

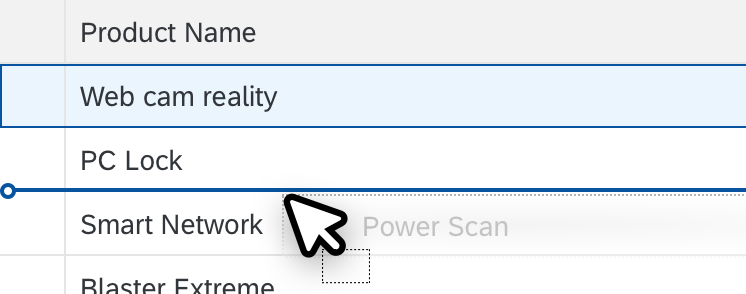
If you offer drag and drop for rearranging items within the table, use drop targets that are between items (sap.ui.core.dnd.DropPosition.Between). This provides better feedback on where the item will be inserted. Show the “move” mouse cursor (sap.ui.core.dnd.DropEffect.Move).

Drop targets in between items

Do not combine rearranging items and sorting. If you really need to do so, make sure that there is a dedicated sort criterion for the user-defined sort order, and only offer options for rearranging items if this sort order is set.

Don't
Do not combine rearranging items with sorting

Drag and drop is “invisible” on the UI: users can’t see where dragging is available and where it isn’t. In addition, there is no generic keyboard interaction. Drag and drop is also not available on all browsers. For these reasons, provide it only in addition to existing (and visible) UI elements that fulfill the same purpose. For example, offer (toolbar) buttons for moving or for copying and pasting items. These are keyboard operable and available on all browsers.

Use drag and drop only in addition to existing visible UI elements

Context Menu

Use the context menu only as a quick way of accessing functions that are already available elsewhere (for example, as buttons in the toolbar). Don’t just offer actions in the context menu itself, as users might not realize that these actions are available at all.

The context menu can be triggered for the table, row, or cell. However, we do not recommend using context menus for cells: because the content of a cell is a different touch target than the cell itself, opening a cell context menu via touch is quite hard, even in cozy mode.

Do not combine context menus with condensed mode: editable controls fill the entire space inside a cell. Because of this, context menus cannot be opened at all with touch or mouse interaction.

Actions

Multiple Items

To trigger actions on multiple items, use a mutliselection grid table (sap.ui.table.Table, property: selectionMode, value: MultiToggle). Offer the corresponding actions in the table toolbar.

Do not offer action triggering on multiple items if the table is generally expected to have fewer than 10 items. In this case, try to use the responsive table instead of the grid table.

Single Item

To trigger actions on a single item (sap.ui.table. Table, property: selectionMode, value: Single):

  • Show the actions on the table toolbar.
  • In rare cases, show the actions within the line item. One example would be an Add to Cart button in a shopping application. Since these actions are repeated in every line and thus use a lot of screen real estate, do this only for a maximum of one or two actions. Provide a separate column per action. Use a button, unless the action trigger belongs to a link. Hide the action in rows for which it is not applicable.

To trigger navigation on line item level, choose one of the following options:

  • Use a link for the attribute that identifies the row. Clicking the link triggers the navigation.
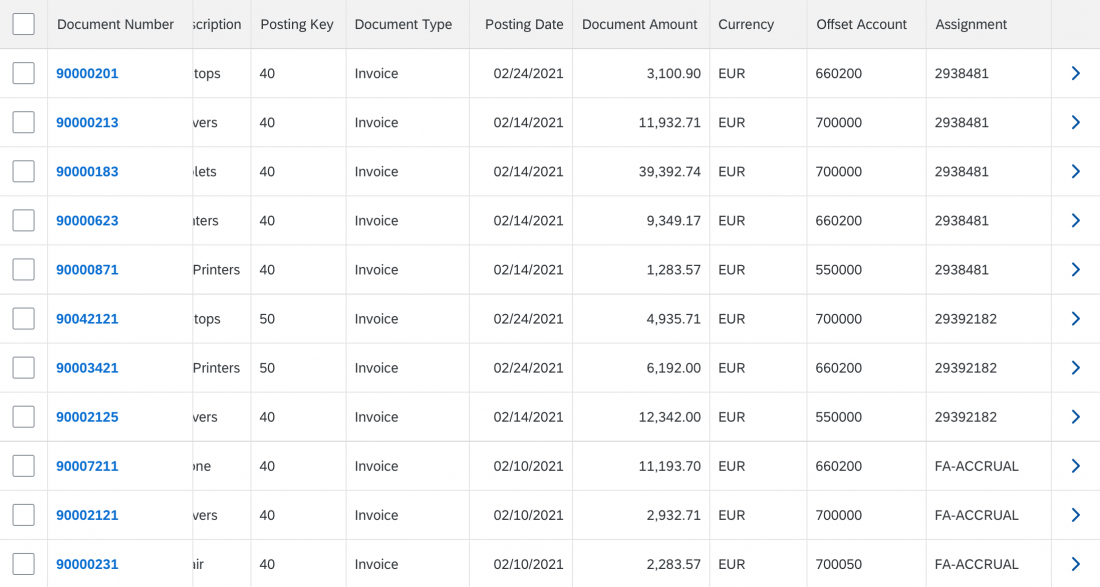
  • Add the RowActions column and show the navigation indicator (  ) at the end of the row. The navigation arrow triggers the navigation.

Special case: Multi-selection in a list-detail scenario
When a multi-selection table is used in a list-detail scenario, it is not clear which item was last opened (for example, which item is currently shown in the second column of a flexible column layout). In this case, you can display a “navigated” indicator to show which item is currently open.

Use the RowActions column only for one or both of the following actions:

  • Navigate to details page ( )
  • Delete ( )

The RowActions column does not provide a column header text. It is fixed and will not scroll away. Users also cannot personalize this column.

Navigate to details page

Single Cell

To trigger actions on a single cell, create the corresponding click event. Do not use the cell click event if the cell contains interactive controls, such as links.

Add Items

For adding items, place an Add or Create text button on the table toolbar.

  • Use Create if the button adds a brand new item that doesn’t yet exist on the database.
  • Use Add if the item already exists and is merely added or assigned to the current object.

Show new items as the first item of the table, with a visual highlight at the beginning of the row.

Enable the shortcut Ctrl+Enter (and ideally Enter in addition) to trigger the Add or Create button.

There are three options for adding an item. In order of priority (most recommended first), these are:

  1. Add the item inline. Create an empty, editable row as the first item of the table. Show the Save button on the table toolbar. This option is recommended for simple scenarios with just a few columns and no option to hide columns.
  2. Open a dialog for larger tables with up to 8 editable columns. Save the new item at dialog level.
  3. Navigate to a new page. This behavior should only be used for very complex scenarios that cannot be handled by a dialog (for example, tables with more than 8 columns). When the user presses Save in the footer toolbar of the create page, navigate back to the table.

Depending on the flow, an item can be in one of three different states:

  • New: The item was just created inline and is in edit mode (for example, after pressing the Create button). It is highlighted with a visual indicator (information state).
  • Recent: The item was just created and is in read-only mode (for example, if Create leads to a dialog, and Save was triggered within the dialog). In this case, keep the item highlighted and display it as the first item of the table. Ignore current sort and filter criteria to keep the item visible.
  • Added: The item has been fully added. It follows the sort and filter settings and also loses the visual highlight. This state is used after:
    • Inline creation: After Save was triggered on the table toolbar or at page level.
    • Create with dialog: A table showing one or several items with the state “Recent” gets updated (for example, after sorting or filtering, or when the browser is refreshed).

In the context of draft handling, new items are not saved at table level, but rather with the entire draft.

For more details, see the guidelines for managing objects (including subarticles).

Editable Content

For editable content, only use the following controls, and only one control per cell:

Only these controls are optimized for all viewing modes of the grid table.

If you need edit mode, change your text controls, such as label, text, link, object status, icons, and currencies, to editable controls as soon as you switch to edit mode, but not before. You can do this by exchanging the controls, for example, from sap.m.Text to sap.m.Input.

For mass editing items:

  • Provide multiselection.
  • Provide an Edit button.
  • If several items are selected, clicking the Edit button opens a dialog in which the user edits the corresponding fields for all selected items.

For more information, see Mass Editing.

Interactive controls – In line

View Settings

There are several ways to show Sort and/or Filter settings:

  • Column header menu: In all cases, show the corresponding settings in the column header menu.
  • View settings dialog: Simple and more flexible with regard to filter settings. No advantage for sorting.
  • Table personalization dialog: Provides complex options for sorting items by several levels. It also provides a query-builder-like approach for filter settings. The complexity of the options is also its downside. Use the table personalization dialog for tables with a large number of items.
  • If filtering is a main use case, use the filter bar. In this case, avoid offering additional filter settings on the table. If you do, the filter settings on the grid table work only on the result set provided by the filter bar.

Always be careful when synchronizing the settings in the dialog with the settings from the column header menu.

Trigger the dialogs in one of the following ways:

  • View settings dialog: Provide several buttons, one for each of these view settings. Each button opens the view settings dialog on the corresponding page.
  • P13nDialog: Provide a settings button, which opens the table personalization dialog containing all pages.

Use only the view settings you really need.

Column header menu with view settings
Table toolbar with triggers for view settings dialog
Table toolbar with trigger for table personalization dialog

Persist the user settings: When reopening the app, show the grid table with the same sort and filter settings as last defined by this user.

Sort

Always sort the table in a meaningful way when it first loads. In most cases, this means sorting by the column that identifies the row. This is usually the first column in the default delivery.

To display the current sort state, an icon is shown in the column header of the most recently sorted column. This icon indicates the sort direction (sap.ui.table.Column, properties: sorted, sortOrder, sortProperty).

For the default sort settings, sort by the column that identifies the row, which is usually the first column in default delivery.

Column, sorted ascending
Column, sorted descending

The descending sort order must always be the exact reverse of the ascending sort order. For each column, provide a meaningful sort order. For example:

  • Sort text alphabetically
  • Sort numbers by their value
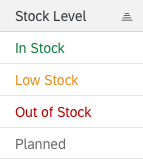
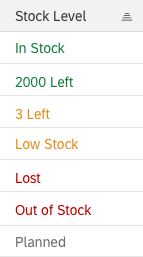
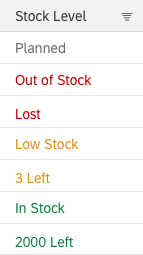
  • Sort status information by the severity of the status:
    • Ascending: Sort status information from positive to negative, with neutral last.
    • Descending: Sort status information from negative to positive, with neutral first.
Object status sorted ascending, with neutral status last
Object status sorted descending, with neutral status first
    • Ascending with different values per severity level: Sort status information from positive to negative, with neutral last. Sort different values within a severity level (semantic color) alphabetically.
    • Descending with different values per severity level: Sort status information from negative to positive, with neutral first. Sort different values within a severity level (semantic color) alphabetically.
Object status sorted ascending and alphabetically, from positive to negative with neutral last
Object status sorted descending and alphabetically, from negative to positive with neutral first

Filter

To display the current filter state, an icon is shown in the column header of the filtered column (sap.ui.table.Column, properties: filtered, filterProperty, filterValue, filterOperator, defaultFilterOperator, filterType).

Column, filtered
Column, filtered

Personalization

Only offer personalization if you need more columns than those that fit on a tablet screen, which is usually five, to fulfill 80% of your main use cases.

Persist the column layout. When a user reopens the app, show the grid table with the same column layout settings as last defined by this user.

Add, Remove, and Rearrange Columns

To add, remove, or rearrange columns, use one of the following:

  • The table personalization dialog: It offers some simple settings for column layout. Use this if you have only a few columns to choose from and/or you use the view settings dialog.
  • The p13n dialog: Besides various complex view settings, it also provides settings for column layout. Use this if you have a large number of columns to choose from and/or you use this dialog anyway for view settings.

In both cases, trigger the dialog via the settings button in the table toolbar. As short cut, use Ctrl+comma.

You can also use drag and drop to rearrange columns (sap.ui.table.Table, property: enableColumnReordering). If you allow rearranging via drag and drop as well as via a dialog, keep both places in sync.

Resize Columns

Resizing columns works differently on touch and non-touch devices.

  • Non-touch devices: Drag and drop the column separator on the right side of the column. Double-clicking the column separator optimizes the width of the column to the data currently loaded into the front end, which is usually about 100 rows.
  • Touch devices: Clicking the column header reveals two buttons: one for opening the column header menu, another one for resizing the column. Drag and drop this second button to resize the column.

Freeze Columns

To freeze columns, offer the setting in the column header menu (sap.ui.table.Table, property: enableColumnFreeze). Selecing Freeze on a column freezes all columns from the first one to the one where Freeze is selected. On this column, the menu entry changes from Freeze to Unfreeze.

Frozen column
Frozen column

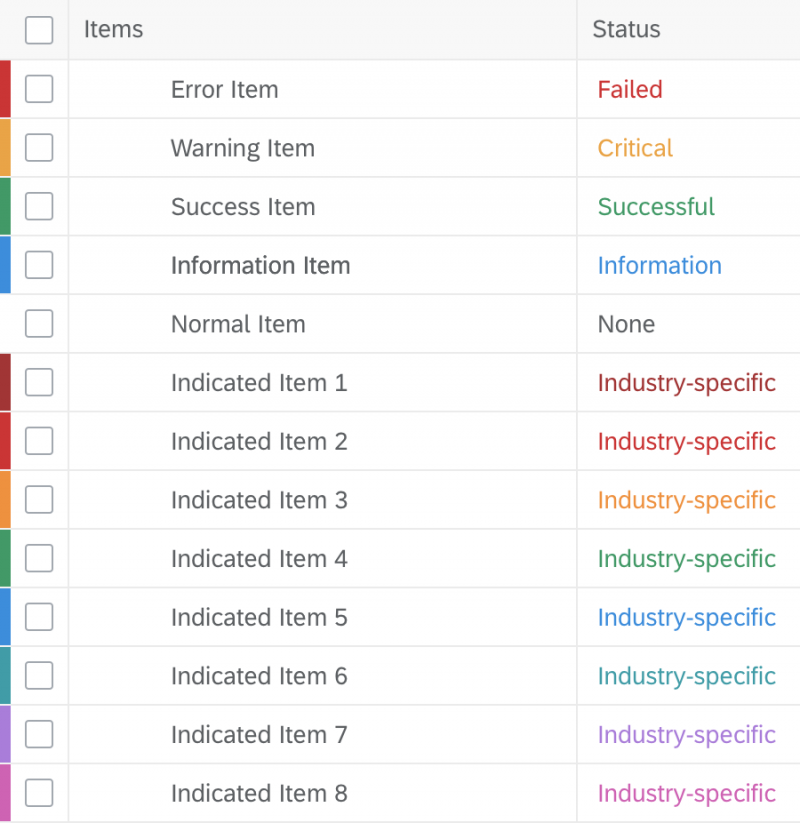
Highlight Items

To show that an item needs attention, a highlight indicator can be shown in front of the item. The highlight indicator can be used to indicate:

  • A semantic state, such as red or orange for an error or warning. In this case, use semantic colors.
  • Additional information, such as blue to highlight newly added items. In this case, use semantic colors.
  • Industry-specific or process-specific states, such as “out of stock” or “excess of inventory”. In this case, use indication colors.

Be aware that the highlight is just an indication. It does not tell users exactly what is wrong. Make sure that you provide this information within the table row, ideally in the same color.

For details on the use of highlight colors, see How To Use Semantic Colors / Industry-Specific Colors.

(sap.ui.table.Table, aggregation: rowSettingsTemplate)

Highlighted items
Highlighted items

Tables in Object Pages

In the object page, you can use a responsive table or grid table and offer navigation to a list report with the table types mentioned above. In the object page, we advise using the analytical and tree tables  in tab mode.

For more information on the use of tables within the object page, see the Tables section of the Object Page article.

Export to Spreadsheet

On the table toolbar, apps can provide a menu button for exporting table data to a spreadsheet. For the export, use the export to spreadsheet function.

'Export to Spreadsheet' menu button

Paste

The browser paste function can be used to paste data from the clipboard to the table if the focus is on an editable control within the table. The browser paste is triggered with the Ctrl + V keyboard shortcut, the table toolbar action, or actions in either the browser context menu or the table generic context menu.

The pasting of a new row or cell follows the grid table inline creation paradigm, where new items are created at the bottom of the table. The same happens when the data is pasted and a cell is unselected or focused.

Note

Pasting via the browser context menu is unavailable if the table has its own context menu because table context menu takes precedence over the browser context menu.

Paste (Overwrite)

Pasting overwrites data present in the table only when a cell with data is selected prior to pasting. When a single cell is selected, all the data in the clipboard is pasted into the table, extending from that cell. The paste will overwrite the data contained in those additional cells, too.

Note

If a user has selected multiple cells to overwrite, but the focus is placed outside of the selection, pasting will follow the guidelines for inline creation as above. This can happen, for example, when the user uses the arrow keys on the keyboard to move the focus.

Clipboard Selection Behaviour

If the clipboard has larger data set than the range selected for the paste, only the cells contained within the selection are updated.

On the other hand, if the clipboard has a dataset too small to fill all the cells selected for the paste, the pasted data updates only the selected cells for which there is data.

Read-Only

The paste action does not update read-only cells, even if there is data in the clipboard corresponding to those cells, but does update surrounding write cells.

Example

If the clipboard contains a range of four columns, and that data is pasted into a table, where column 2 is read-only, only the cells in column 1, 3, and 4 are updated.

Properties

sap.ui.table.Table

The following additional properties are available for the grid table:

  • The property: width defines the width of the grid table.
  • The property: rowHeight defines the height of each row in the grid table. Since the height required is calculated automatically by the grid table, this property is only needed rarely.
  • The property: columnHeaderHeight defines the height of the column headers. Since the height required is calculated automatically by the grid table, this property is only needed rarely.
  • The property: columnHeaderVisible can be used to hide the column headers. Always show the column headers.
  • The property: showColumnVisibilityMenu provides an additional entry in the column header menu that allows columns to be shown or hidden. In SAP Fiori, columns are shown and hidden via the table personalization dialog or via the table personalization dialog. Do not use this property.
  • The property: visibleRowCount defines the height of the grid table. Show as many rows as fit on the screen.
  • The property: visibleRowCountMode defines whether the height of the grid table is fixed or automatically calculated based on the space provided by the underlying container. For automatic calculation, make sure that all rows have the same height.
  • The property: minAutoRowCount defines the minimum number of rows that must be shown if the property: visibleRowCountMode is set to “auto”. Show at least three to five rows.
  • The property: firstVisibleRow defines the first row shown in the visible area of the grid table. The grid table is scrolled accordingly.
  • The property: allowColumnReordering is deprecated. Do not use it. Use the property: enableColumnReordering instead.
  • The property: editable does not have a visible effect. Do not use it.
  • The property: enableCustomFilter changes the filter entry in the column header menu from an edit box to Filter…. Selecting this entry throws an event to which apps can react, for example, by opening a dialog. In general, you should choose the built-in filter over your own implementation. Specifically, keep filtering via the column header menu simple, while offering more advanced options via the table personalization dialog.
  • The property: enableBusyIndicator has not yet been fully implemented. Do not use it.
  • The property: title adds a line of text on top of the grid table. Do not use this. To add a title to the table, use a toolbar.
  • The property: footer adds a short text at the bottom of the table.
  • The property: Busy sets the grid table to busy state. While in busy state, the whole table cannot be used and items cannot be read due to an overlay.
  • The property: Tooltip does not have an effect. Do not use it.
  • The property: alternateRowColors displays the rows with alternating background colors (“banded rows”). Do not use it.

sap.ui.table.Column

The following additional properties are available for the column:

  • The property: visible defines whether a column is shown or hidden.
  • The property: name defines the name shown in the column header menu for showing and hiding columns. In SAP Fiori, columns are shown and hidden via the table personalization dialog or via the table personalization dialog. Do not use this property.
  • The property: headerSpan defines whether one column header is used for one or several columns. To prevent adverse side effects, always use one column header for only one single column. Do not use this property.
  • The property: Tooltip does not have an effect. Do not use it.

Resources

Want to dive deeper? Follow the links below to find out more about related controls, the SAPUI5 implementation, and the visual design.

Elements and Controls

Implementation

Process Flow

The process flow control allows you to show flows of multiple types of objects, such as documents and approvals. Document flows can split into numerous branches, while approval flows are usually straightforward.

Usage

Use the process flow if:

  • You need to display document flows.
  • You need to display approval flows.
  • You need to display other kinds of flows with linear and/or branching paths.

Do not use the process flow if:

  • You want to display the process flow header in combination with something other than the flow map. In this case, use the icon tab bar (style: process) instead.

Responsiveness

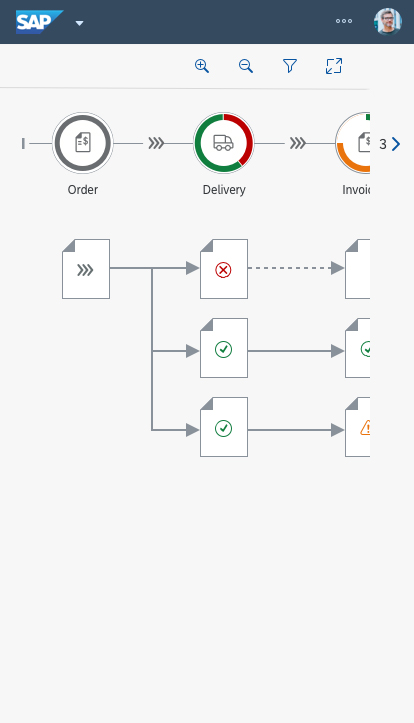
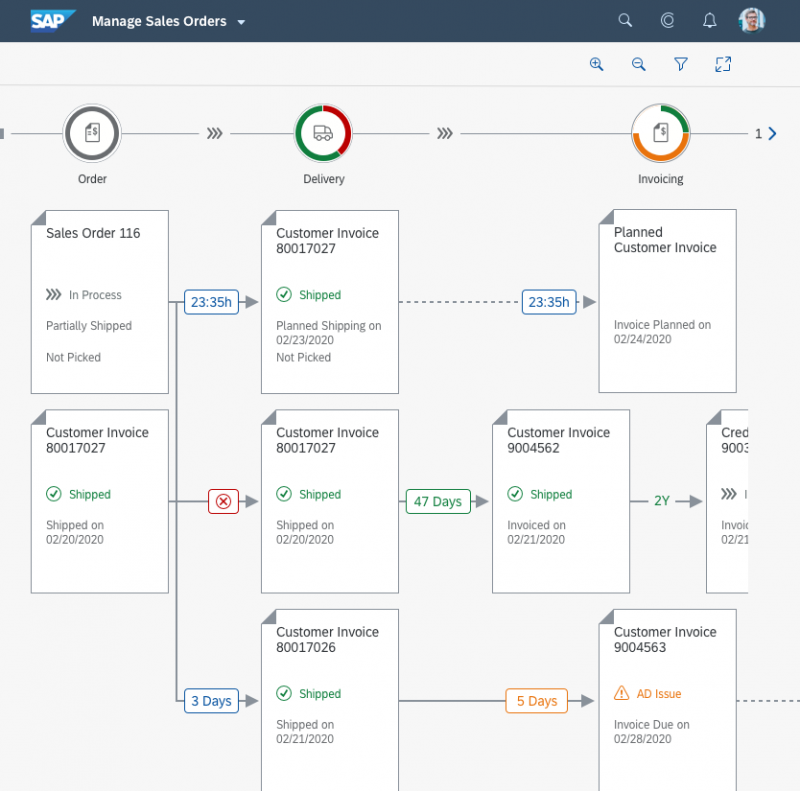
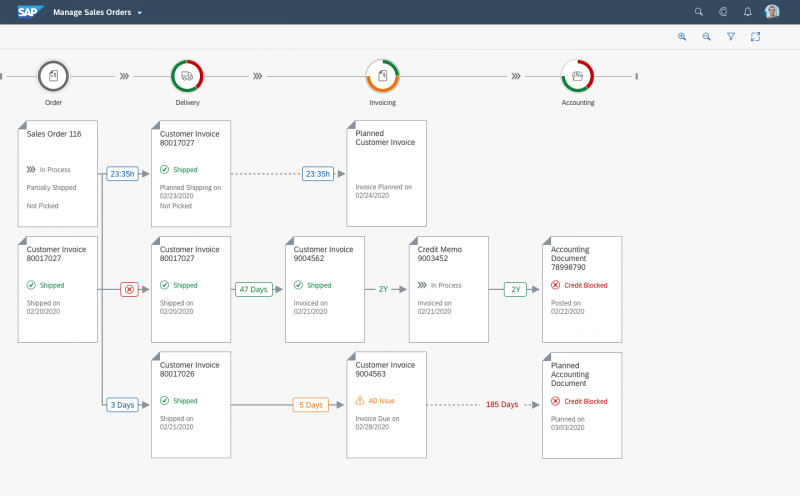
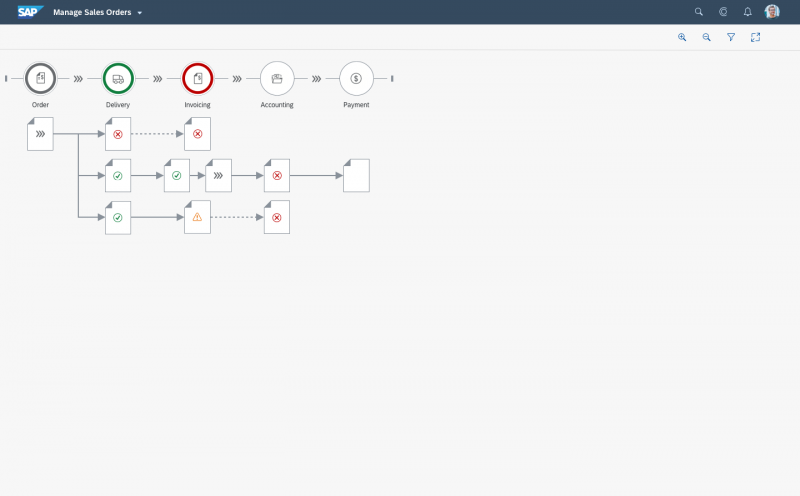
The process flow reacts to the size of the container it is put into. It has four zoom levels, with level 1 being the largest and level 4 the smallest. In containers wider than 1024 px, level 2 is chosen automatically. For containers from 600 to 1023 px, level 3 is set, and below 600 px, it is level 4. For more information, see Behavior and Interaction.

Process flow – Size S
Process flow – Size M
Process flow – Size L

Layout

The process flow enables different layout forms within the nodes:

  • The default layout contains fixed sections that can easily be filled with content.
  • The freestyle layout comprises an empty container that can be filled with different controls.

Default (Fixed) Layout

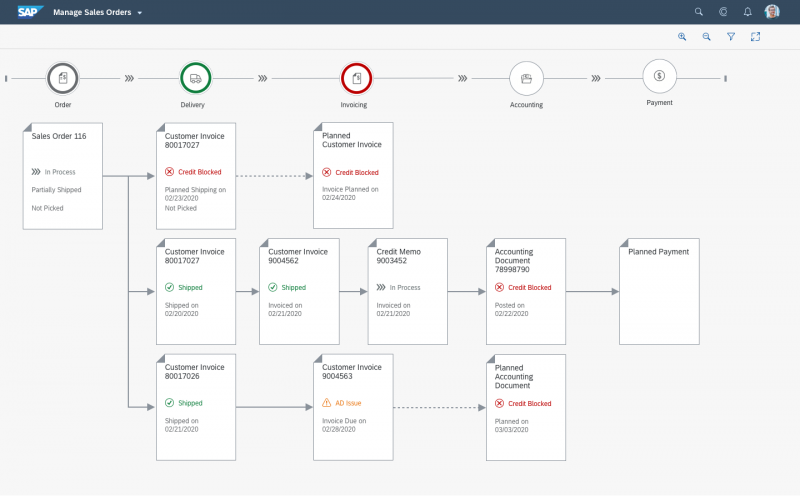
At the top of the control is a bar, with the zoom buttons on the left and the full screen toggle on the right.

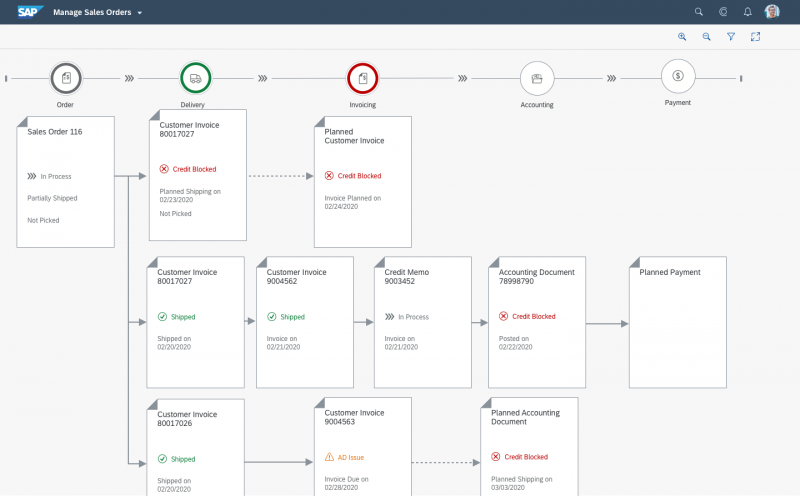
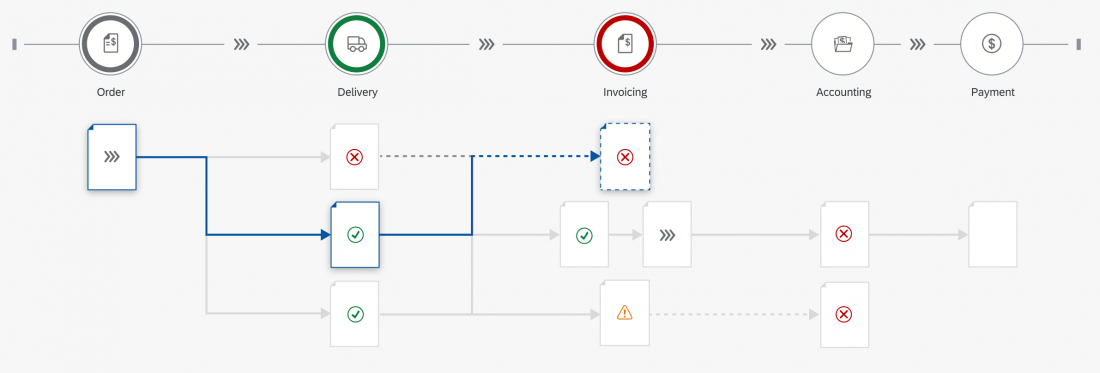
Below the bar is the process flow header, which can also be used on its own if the complex visualization of nodes is not required. The header consists of multiple steps, each of which is visualized by a circled icon. Each icon is surrounded by a circular chart to indicate the distribution of statuses per column.

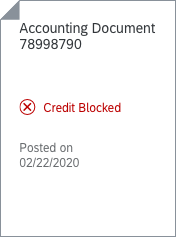
The flow map lies beneath the header. The elements belonging to a certain step are vertically aligned beneath one another. Arrows point to the next (follow-up) element or multiple elements. Dotted arrows pointing to semi-transparent elements indicate planned or pending elements.

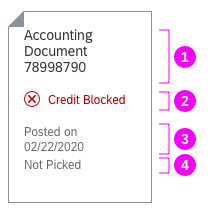
In turn, each element comprises different sections:

  1. Header (mandatory) – Wraps twice before truncation.
  2. Status (optional) – With semantic color and icon; can wrap once.
  3. Attribute 1 (optional) – Wraps once before truncation.
  4. Attribute 2 (optional) – Wraps once before truncation.
Layout – Sections
Layout – Sections

Naturally, the header information is mandatory because it is the key identifier of an object. The header should contain a brief but meaningful description and, if necessary, an ID in brackets.

Although the status is optional, an icon appears on an item without a status at the smallest zoom level. When the user zooms out completely, only the status icon remains visible on an item. Without it, the element looks broken and does not provide any information.

There are two options to filter the nodes for certain types or attributes. For simple filtering, you can use a filter button in the toolbar to trigger a filter dialog. For more complex filtering, the filter bar control can be placed on top of the process flow.

Freestyle Layout

The freestyle layout gives you the most freedom within the borders of each node. Inside this empty container, you can structure your content as your use case requires. Of course, you still need to conform to the guidelines for each control you use in your layout. The next sections show two examples of freestyle layouts with texts and images.

If text is the main focus of a node, we recommend using the “dog ear” visualization (property FoldedCorners = true, see Styles section for further details). If an image is the most notable content of a node, we advise against using the “dog ear” visualization.

Regardless of the controls you use inside the nodes, ensure that users can easily identify the item or meaning behind a node without having to click it. Users should only have to click to retrieve additional information or to perform an action, but not to identify an item. An exception to this rule is the lowest zoom level, which only shows the most basic information.

What should be displayed at the lowest zoom (level 4) depends on the context and use case of your application. If an image is the centerpiece of the node, a down-sampled version of this image can help users to identify each individual node. In other instances, an icon might be more appropriate to show the status of a node or hint at its content. In both cases, it is mandatory for applications to supply an icon (such as  to indicate that the object is in process, or   to show that the item contains textual information). You can also use status icons with semantic colors if they support the use case.

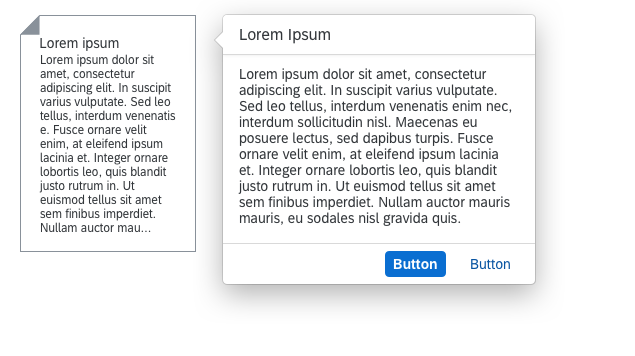
You can offer actions on the popover or quick view that is triggered to show additional information. If no additional information is required, you can also use the node’s click event to trigger an action sheet. However, use this latter option with caution; for most use cases, you will need to show additional information, especially at the lowest zoom level.

Freestyle Example: Text

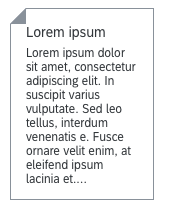
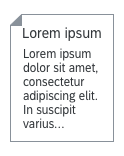
If you need to display text inside a node, you can use the built-in click event to show a popover with the full text and any additional actions. While zooming out, less and less text is shown until the smallest zoom level is reached. Since text cannot be previewed in such a small container, use the icon   to indicate that the item contains textual information.

Layout – Freestyle – Level 1
Layout – Freestyle – Level 2
Layout – Freestyle – Level 3
Layout – Freestyle – Level 4

Freestyle Example: Image

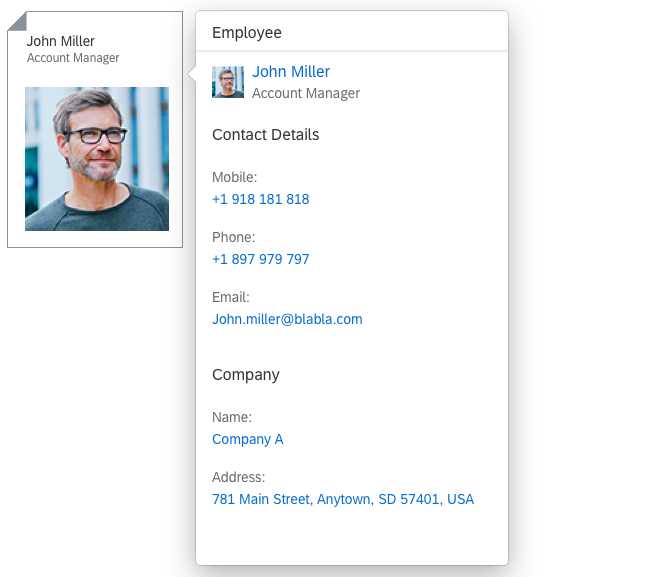
The following examples show how images can be displayed inside the process flow nodes – in this case to represent an employee. Additional information, such as the employee’s profile and contact information, can be shown in a quick view. As the node gets smaller with each zoom level, some information needs to be omitted. On the lowest zoom level, only the image is shown.

Layout – Freestyle Image - Level 1
Layout – Freestyle Image - Level 2
Layout – Freestyle Image - Level 3
LLayout – Freestyle Image - Level 4

Components

The process flow control consists of the process flow header and the flow map.

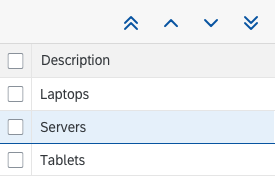
For better usability, it is highly recommended to add a toolbar with zooming controls (    ).

A full-screen switch is optional and can also be put in the toolbar (  ).

Behavior and Interaction

Navigation and Zoom

User can move the whole flow with the left mouse button held down, just like they would move a street map in a browser.

To zoom in or out, the user can use the mouse wheel or, if implemented, click the respective buttons on the bar on top of the flow line. The zoom is semantic: detailed information is added or removed depending on the zoom level.

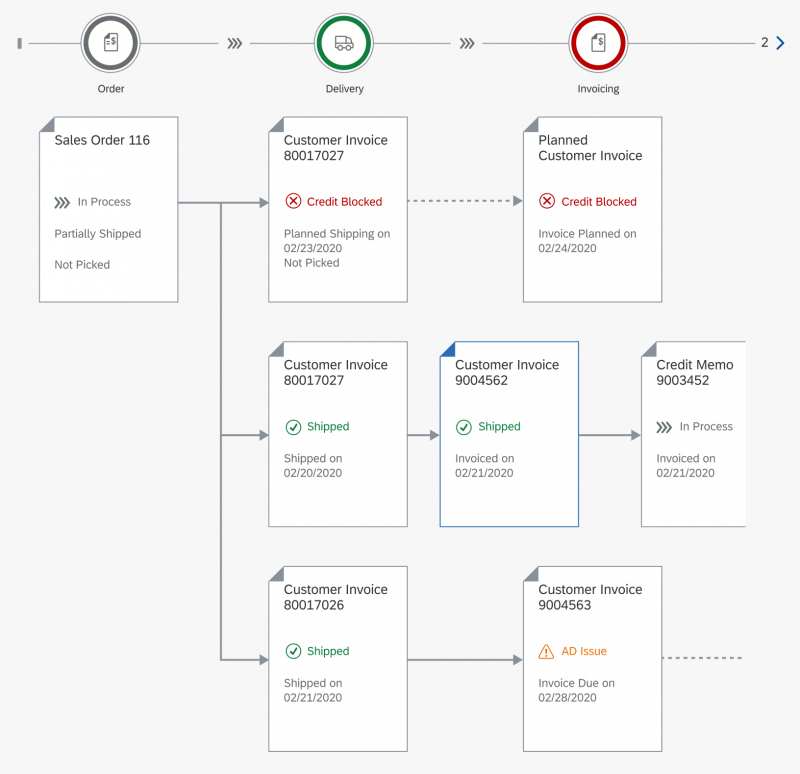
If the process flow is wider than the available space, a chevron (< or >) appears on the side where the flow extends beyond the visible area. A number also indicates how many process steps lie outside, such as < 2 or 5 >.

Level 1

Larger elements provide the most space for
textual information. However, fewer elements
fit on the screen.

Zoom in (node)
Zoom in (node)
Zoom in (process flow)

Level 2 (automatic preset for screens wider than 1024 px)

The standard size provides the best combination
of content information and overview.

Zoom in – Standard size

Level 3 (automatic preset for screen widths from 600 px to 1023 px)

Elements are reduced to header and status
information to provide a better overview for
large flows.

Zoom in – Elements are reduced to a header and status information

Level 4 (automatic preset for screens below 600 px width)

The smallest zoom level provides a maximum
overview of the flow while the information about
each element is reduced to a status icon.

Zoom in – Element is reduced to a status icon
Zoom in – Elements are reduced to a status icon

When a node is clicked, applications should provide a popover with additional details about this element. It should give users a deeper insight into the status or, in the event of an issue, a way to solve the problem. From the quick overview, users should be able to navigate to the element’s fact sheet.

If no additional information needs to be displayed, an action sheet can be triggered instead of the popover to allow users to perform actions on the item.

Labels on Connections

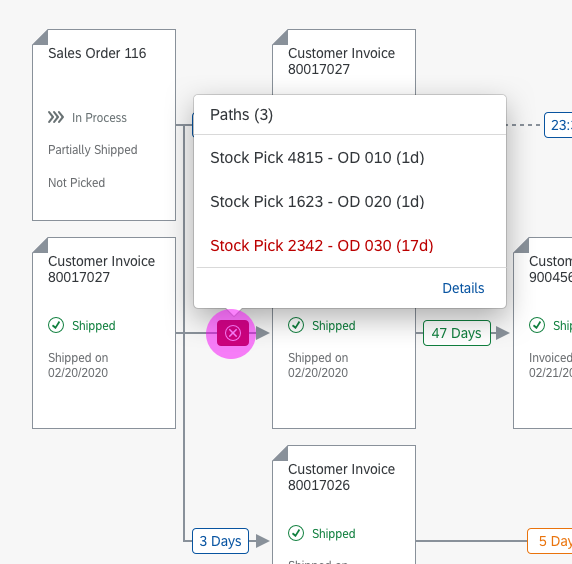
Some use cases focus on the connections between the nodes as much as on the nodes themselves. For these cases, we provide labels that can be displayed on each connection which, in turn, provide the user with the necessary information.

If multiple paths overlap, applications need to aggregate the respective labels and show the ‘worst’ status.

Labels
Labels
Process flow – Labels (1)

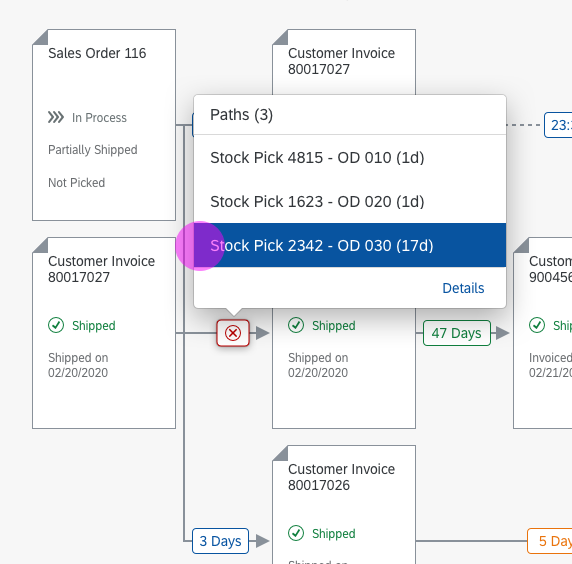
When the user clicks an aggregated label, app developers need to provide a popover showing a list of connection paths for the user to select from.

Process flow – Labels (2)

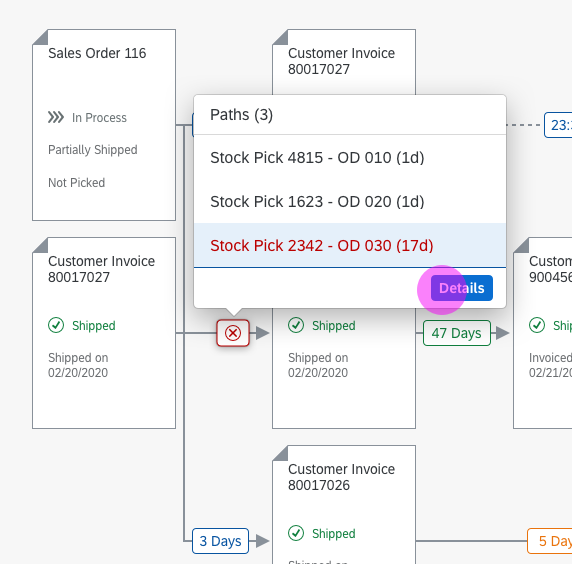
In the popover, the user should now be able to browse through the paths, while the process flow is updated accordingly.

Process flow – Labels (3)

To give the user more information, a Details button needs to be shown in the footer.

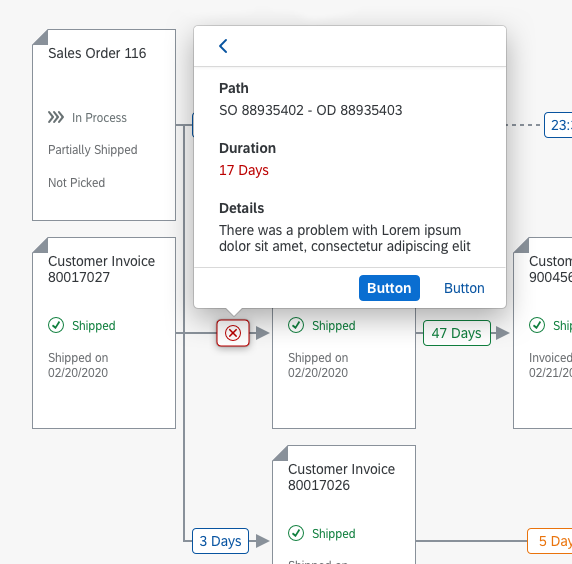
The details must be shown in the same popover, and a back button must be offered that allows the user to return to the path overview.

The footer of the details overview can contain up to two actions.

Labels - Process flow

Highlighted Path

The “highlighted path” feature allows users to focus on specific nodes and their path through the process flow, for example by highlighting a search or filter result.

Example: A user searches for a specific item inside an order. The nodes containing or exclusively representing this item are highlighted, while the rest of the flow is dimmed.

Attention: Do not combine a highlighted path with a selected path. When you set one path type, make sure that the other is deactivated.

Highlight path
Highlight path

Business Focus

The business focus is a rarely used feature. It allows applications to put a visual focus on a node that is separate from (and not to be confused with) the selection or keyboard focus.

If, for example, the process flow is used next to another control (such as the timeline), the business focus can be used to highlight a node that corresponds to a selection in the other control:

  1. The timeline shows an automated post “There is an invoicing problem with Item 0815 from Order 4711.”
  2. The user clicks the post (not onto a specific link).
  3. The respective node in the lane Invoice is highlighted.

If you use the business focus, make sure that only one node is selected at a time.

Business focus
Business focus

Editing

If users can edit a node’s content, offer an Edit button. Place the button on whatever is triggered when the user clicks a node (action sheet, popover, quick view). The editing itself can be handled in a small dialog. The information structure depends on the controls used inside the node. Usually, a form and/or text areas will cover most use cases.

Styles

Two visualizations are available for the nodes inside the flow: a specific visualization for documents, and one for general objects (basically everything except documents). App teams can use the FoldedCorners property to choose the type of objects that the process flow represents.

FoldedCorners = true: This style gives the node a “dog ear”, which makes it very recognizable as a document.

FoldedCorners = false (default): This setting has no specific visual style and is therefore suitable for all object types.

The property affects the entire flow; in other words, it cannot be applied solely to individual nodes. Therefore, it should only be set to true if all the nodes represent documents (or document-like objects). If some or all of the elements are better visualized with the general style, FoldedCorners should be set to false.

Styles – FoldedCorners – True
Styles – FoldedCorners – False

Aggregation

Some flows can be arranged more clearly by using aggregation. Nodes that belong to the same lane (column) can be displayed as a stack by setting the property Type to Aggregated. This means that nodes that would usually be displayed one below the other are shown as a stack of nodes.

The interaction for these stacks is identical to the regular nodes: the control provides a single click event that app developers can use to show a popover with more detailed information.

The description on these stacks should be helpful to users, for example, by telling them how many nodes are in the stack. Aggregated amounts can also be shown.
Use the following format to describe the stack and the number of nodes it contains: <Object Type> (<Counter>). For example, Invoices (8) or Sales Orders (42).

The statuses in the stacks can be heterogeneous. However, it is imperative to show the ‘worst’ status(es) at the top so that users know whether they have to take action.

In the upper example on the right-hand side, the nodes under Delivery and Invoice are shown as stacks instead of individual nodes.
The lower example on the right shows the same stacks when zoomed out (level 4).

Aggregation
Aggregation
Aggregation (zoom)
Aggregation (zoom)

Guidelines

The process flow header is not a substitution for the icon tab bar. For more details, see the Usage section at the top of this article.

Keep the amount of information inside each node to a minimum. Reveal more information via a popover.

Although technically possible, the node titles should not be turned into links. The IsTitleClickable property should be left in its default state (“false”). Titles that the user can click may lead to usability issues. Handle every action or interaction via a popover and/or navigation to a subsequent page.

UI Texts

Use a noun to describe the process phase.
Example: Accounting

If the process and a business object have the same name, add Processing to the process name.
Example: Order Processing (in this case, “Order” is used for the business object)

Resources

Want to dive deeper? Follow the links below to find out more about related controls, the SAPUI5 implementation, and the visual design.

Elements and Controls

Implementation

Chart – Zoom

x

The user can change the scale of an axis on a chart by using the zoom function. This function spreads or shrinks the scale of the horizontal or vertical axis. Both the categorical and continuous axes can be zoomed.

Example of zoom on a horizontal categorical axis
Example of zoom on a horizontal continuous axis

This type of zoom is called scale zoom (as opposed to optical zoom) because when the user zooms, only the scale and the encoding objects, such as bars, bubbles, and lines are changed, but all the text, the axis line, the legend, and icons remain identical.

Note that semantic zoom is not yet supported. Semantic zoom is only applicable if one dimension is hierarchical. It changes the level of the hierarchy currently displayed and aggregates data accordingly.

Zooming Direction

The zooming direction depends on the scrolling direction of the chart. The zooming direction cannot be changed since it is defined individually for each chart type.

For charts that scroll horizontally, the zoom changes the scale of the horizontal axis.

Zoom of a chart that scrolls horizontally

For charts that scroll vertically, the zoom changes the scale of the vertical axis.

Zoom of a chart that scrolls vertically

For charts that do not have a specific scrolling direction, the zoom changes the scale of both axes.

Zoom of a chart that scrolls in both directions

How To Zoom

There are four ways of zooming:

  • Toolbar: Use the zoom icons in the chart toolbar.
  • Mouse wheel: Use Ctrl plus the mouse wheel to zoom in and out.
  • Gesture: On a touch screen, use the pinch and spread gesture.
  • Keyboard: Use the [+] and [-] keys to zoom in and out.

Toolbar Zoom Icons

The charts cannot be zoomed by default. This must be defined explicitly.

If you define the chart as zoomable, you must also declare the two zoom icons in the chart toolbar. These icons are correctly positioned in the toolbar and automatically pilot the zooming feature in the chart.

Zoom icons in the chart toolbar

Zoom Settings

The user can control the zoom scale by defining the following settings:

  • Whether the zoom is enabled (property:interaction.zoom.enablement).
  • The initial range to be displayed (property:plotArea.window.start and property:plotArea.window.end).

No Initial Range

Zoomable Chart

This is the default setting of the charts.

The display starts with the first data point of the dataset, and the initial scale is calculated to avoid data points that are too small. A scrollbar is used if necessary. The user can zoom in to see more details or zoom out to see an overview of the dataset.


Non-Zoomable Chart

The first data point of the dataset is displayed. The scale is fixed and cannot be changed. A scrollbar is used if necessary.

Chart with no initial range

Initial Range = Entire Dataset

Zoomable Chart

The chart is initialized to display the entire dataset, but the user can zoom in to see more details of the data points.


Non-Zoomable Chart

The chart always displays the entire overview of the dataset even when the chart is resized. The user cannot zoom the chart manually.

Chart with no initial range

Initial Range = Subset of Dataset

Zoomable Chart

The chart is initialized to display the defined range. A scrollbar appears.

The user can zoom in to see more details of the data points or zoom out to see an overview of the dataset.


Non-Zoomable Chart

The chart is initialized to display the range. A scrollbar appears. As the user cannot zoom, the scale cannot be changed.

You must ensure that the data points are large enough to work on a touch screen. Therefore, this setting is only recommended if you know the size of the chart container in advance.

Chart with no initial range

Resources

Want to dive deeper? Follow the links below to find out more about related controls, the SAPUI5 implementation, and the visual design.

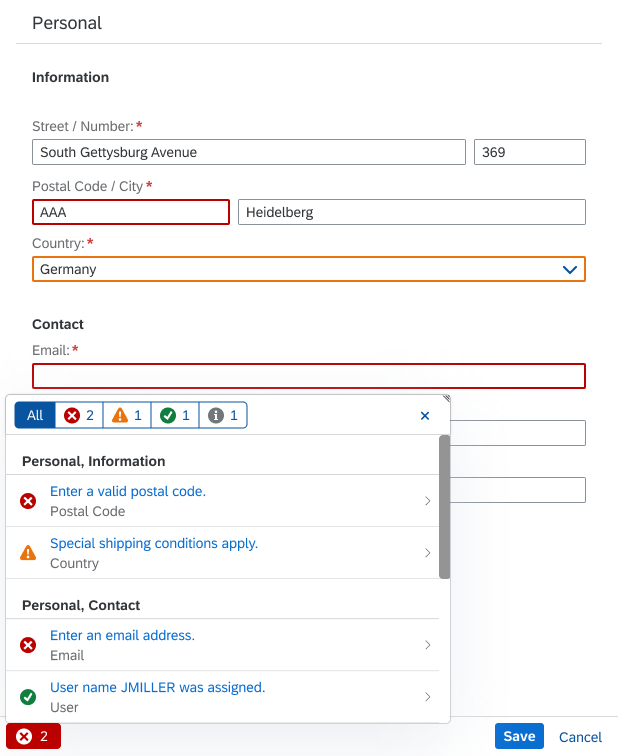
Elements and Controls

Implementation

No links.

Design Principles

SAP Fiori provides a consistent and holistic user experience for SAP software. By creating visually pleasing designs with a strong focus on ease of use, the experience is intuitive and simple, across all devices. With effortless interaction patterns, the SAP Fiori UX is designed for a powerful impact across your enterprise.

Design Principles

The design philosophy of SAP Fiori is based on five core principles. SAP Fiori user experience is role-based, adaptive, simple, coherent, and delightful.

ROLE-BASED

SAP Fiori is designed for your business, your needs, and how you work. It draws from our broad insights on the multifaceted roles of today’s workforce. SAP Fiori provides the right information at the right time and reflects the way you actually work.

DELIGHTFUL

Apart from making you work smarter, SAP Fiori also enriches your work experience by allowing you to simply do your job.

COHERENT

Whether you fulfill a sales order, review your latest KPIs, or manage leave requests – SAP Fiori adheres to a consistent interaction and visual design language. Across the enterprise, you enjoy the same intuitive and consistent experience.

SIMPLE

With SAP Fiori, you can complete your job intuitively and quickly. SAP Fiori helps you focus on what is important – essential functions are easy to use and you can personalize the experience to focus on your relevant tasks and activities.

ADAPTIVE

SAP Fiori enables you to work how and where you want, regardless of the device you use. And, it provides relevant information that allows for instant insight.

Analysis Path Framework

Analysis Path Framework (APF) is a framework for creating interactive, chart-oriented analytical drilldown apps by configuration. APF-based apps enable the user to view and analyze the data of several key performance indicators (KPIs) from different data sources. Users can interactively explore data step by step from different perspectives to analyze and investigate root causes. In each analysis step, you can investigate KPIs/measures and select relevant data to filter the information provided in subsequent steps. By combining different analysis steps and applying filters, you interactively create your own flexible analysis path.
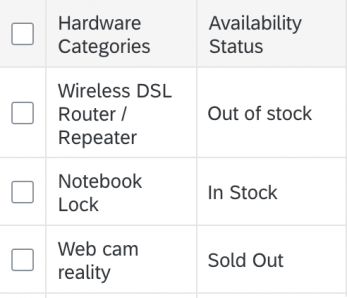
Analysis Path Framework-based app

APF can consume OData services that are based on the following data sources:

  • Calculation views
  • ABAP CDS views
  • BW OData queries

APF is integrated into SAP Smart Business as an advanced KPI drilldown option.
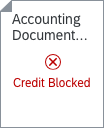
Responsiveness

APF-based apps are responsive and ensure a consistent user experience for desktop or tablet devices.
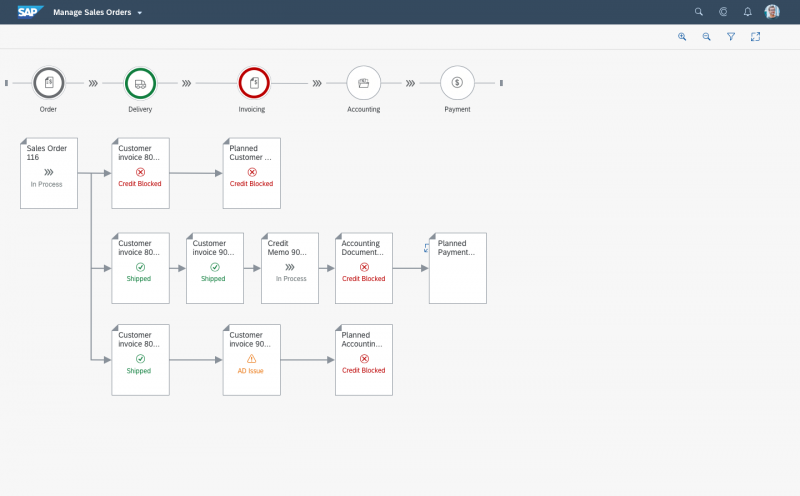
APF-based app on desktop
APF-based app on iPad

Layout

The page consists of the following:

  • A header area
  • An overview area (the analysis path display), where all analysis steps that have been added can be viewed at a glance
  • A details area (the analysis step display), where charts or tables can be analyzed
  • The footer toolbar

Behavior and Interaction

The header area contains the app title as well as global filters. Selections made in global filters are applied to all analysis steps of an analysis.

When designing, you can either configure each filter individually or use the smart filter bar.

Header area with global filters

The analysis path display is the UI area where thumbnails of all analysis steps of the current analysis path are displayed. It allows you to work flexibly with your analysis path. You can add, delete, and rearrange analysis steps. To add analysis steps, click the Add Analysis Step button at the bottom of the analysis path. This opens the “analysis step gallery”, where you can choose the analysis step you want to add to your analysis.

You can also capture the analysis findings by saving the analysis path, open saved analysis paths to revisit your findings at a later point in time, and you can print the analysis path. To do so, click the icon next to the analysis path name. This opens the actions menu with the options to Open, Save, and Print analysis paths.

Actions menu
Actions menu

When you choose a thumbnail in the analysis path display, the details of this step are shown in the analysis step display.

For further analysis, you can select and filter relevant data directly in the chart or in the table. You can also view and select hierarchical data in a tree table, where data is structured in rows and columns and grouped into nodes.
Furthermore, the chart toolbar provides standard interactions. For example, you can switch to different chart types and a table view, and you can filter and sort tabular data. You can also enlarge the chart to full-screen size.

Chart with selected values

You can change the order of the analysis steps in an analysis path by clicking the arrows in the footer toolbar to move up or down a step. To navigate to other apps, click the Open In… button.

Footer toolbar
Footer toolbar

Configuration

Creating APF-based apps is simple. The APF Configuration Modeler app allows you to define and edit APF-based apps without programming.

The context-sensitive user assistance enables the user to get help when needed and to find all relevant information easily and directly within the application.

Resources

Want to dive deeper? Follow the links below to find out more about Analysis Path Framework.

Elements and Controls

No links.

Implementation

SAP Smart Business Framework

SAP Smart Business drilldown is an analytical app. It enables the user to view and analyze the data of one key performance indicator (KPI).

SAP Smart Business drilldown

Responsiveness

SAP Smart Business pages are responsive, but work best on either desktop or tablet devices.

SAP Smart Business drilldown on desktop
SAP Smart Business drilldown on tablet
SAP Smart Business drilldown on phone

Layout

The page consists of a header and a chart area.

Behavior and Interaction

The header area (light blue bar) at the top contains a smart filter bar with KPI information and the facet filters. The facet filters act as a cross filter secondary to smart filters providing multiple dimensions. By clicking on the blue bar, you can open or close the filter area.

SAP Smart Business drilldown - Filter selection
SAP Smart Business drilldown after filter selection

If the user clicks on the Show Mini Tiles button in the top right corner, the header expands and displays a set of tiles that contain KPIs and their corresponding micro charts. Tiles of the same KPI open a popover with KPI details as well as tiles with associated KPIs when clicked navigate to another dashboard.

SAP Smart Business drilldown with message popover on a KPI tile

When the header is collapsed and all the filters are set, maximum real estate is available for analysis of the content in the chart area below. The chart toolbar provides a number of standard interactions. You can switch between different views, chart types, and a table view. The chart can also be enlarged to full screen size.

 SAP Smart Business drilldown with one selected data point
SAP Smart Business drilldown with one selected data point
 SAP Smart Business drilldown with two selected data points
SAP Smart Business drilldown with two selected data points

Resources

Elements and Controls

Implementation

Checkbox

A checkbox lets the user set a binary value (such as “true/false”). When the user clicks the checkbox, it toggles between checked and unchecked. Checked means that the state described by the checkbox text applies, or that the item has been chosen.

The checkbox text describes the positive action (as in “true” or “yes”). The text can be either a label control to the left of the checkbox, or a checkbox text that appears to the right of the box.

  • If there is only one checkbox, you can use a label or text depending on the form format.
  • If there is more than one checkbox, the label describes the whole group of checkboxes. In this case, use the text property of the checkbox to describe the individual checkboxes.

Within a group of checkboxes, each checkbox can be checked or unchecked. The user can check multiple options.

A checkbox does not apply a setting right away; the changes take effect after user confirmation via a triggering action button (such as Save).

Checkbox enabled/disabled

Usage

Use the checkbox control if:

  • Only one option can be selected or deselected, for example to accept terms of use. Use it only if the meaning is obvious (single checkbox).
  • You have a group or a list of options that can be selected independently of each other (checkbox group).
  • Your use case requires all available options to be displayed right away without any user interaction (also in read-only cases).
  • The values of the option list are primary information and need to be displayed right away.
  • Changes to the settings need to be confirmed and reviewed by the user before they are submitted. This helps prevent users from changing settings accidentally.
  • You want to group multiple suboptions under a parent option, and require an intermediate selection state (tri-state). The tri-state indicates that some (but not all) suboptions are selected.

Do not use the checkbox control if:

  • The user needs to choose multiple options from a large list. Use a multi-combo box instead.
  • The user can choose only one option from a list. For a small list, use a radio button group instead. For a large list, use the select control or a list with multi-selection functionality.
  • You want to offer two options for a “yes/no” or “on/off” type of decision. Consider using a switch control instead.
  • The user needs to perform instantaneous actions that do not need reviewing or confirming. Consider using the switch control instead.
  • There is not enough space available on the screen. Use the combo box control instead.

Responsiveness

A checkbox can appear in two different sizes. In cozy mode, it is bigger than it is in compact mode. This makes the checkbox easier to select on touch devices. For more information on cozy and compact modes, see the article on content density.

Compact and cozy mode

In both sizes, the touch/click area around the checkbox is bigger than the checkbox itself, making the checkbox easier to select. Clicking inside this area toggles the checkbox.

Note: Because the touch/click area does not include the label on the left, clicking the label will not toggle the checkbox.

Checkbox touch/click area without label
Checkbox touch/click area with label

Layout

The checkbox control consists of a box and a text that describes the purpose of the checkbox.

If the checkbox is checked, an indicator is shown inside the box.

Although the clickable area to select/deselect a checkbox covers a wider area than the box (see the Responsiveness section), the focus is indicated by a dotted line that surrounds only the box.

If the checkbox appears alone inside a form, the text can be omitted if the label in front of the checkbox takes over its function.

Note: Because the touch/click area does not include the label on the left, clicking the label does not toggle the checkbox.

If there are several options to choose from in a form, the label describes the entire checkbox group, and the texts describe the individual checkboxes.

Since checkbox texts are also a type of label, use title case to be consistent with other labels. If the label is long, it can wrap in order to fit the text into the visible area of the content holder. There is no limit on the number of lines a text can wrap.

Exception: If one or several of the checkbox texts is very long, or is formulated as a phrase, use sentence case and appropriate ending punctuation.

For forms with labels above the fields, place the label above the checkbox group, or do not use a label. For a single checkbox, use only a checkbox text.

For forms with labels to the left of the field, place the label next to the group, aligned with the first checkbox field, or do not use a label. For a single checkbox, use only a label, or only a checkbox text.

Developer Hint
Do not use empty labels to arrange the checkboxes. Creating a label in front of each checkbox and leaving the text empty looks fine – nobody sees the label, and the checkboxes are aligned correctly underneath each other. However, the screen reader will notice these labels and read each of them as “label”. Instead, use the layout data property (layoutData) for the checkbox. In this property, force a line break (linebreak) and set the value of the indents in sizes L and M (indentL, indentM) according to the value of the label span in the simple form (labelSpanL, labelSpanM).
Checkbox layout
Checkbox layout
Short checkbox text in title case; Long checkbox text in sentence case
Checkbox text wrap
Checkbox text wrap
Checkbox group with label aligned to the left or on top
Checkbox group without label
Single checkbox with label or with text

Behavior and Interaction

Clicking a checkbox toggles the state of the checkbox between checked and unchecked.

Tri-State

The main purpose of this state is to represent the mixed selection states of dependent input fields. If some (but not all) of the dependent fields are selected, the checkbox shows a partially selected state. This is only a visual state and can’t be achieved by a direct user interaction.

Checkbox interaction states

Properties

You can set the width of the element containing the checkbox and the text manually (property: width).

If the text exceeds the available width, it can wrap. The touchable area for toggling the checkbox ends where the text ends.

If the width allows more space than the text requires, white space is added. The touchable area for toggling the checkbox is increased according to the manually-set width.

The text can be positioned manually in this space (property: textAlign). However, we do not recommend using the right-align option, which can result in a large amount of white space between the checkbox and the checkbox text.

States

If a checkbox is part of an editable form, it can be edited in when the form is in edit mode. In display mode, the checkbox uses its “display-only” state (property: displayOnly), and two icons replace it to represent the checked and unchecked states.

If the checkbox appears in a read-only form, set the checkbox to read-only (property editable = “false”).

Do not combine the settings “disabled” and “read-only”. This is technically possible, but does not make any sense.

The checkbox can represent a mixed selection state, or tri-state (property: partiallySelected). The visual state depends on the value of the selected property.

Don't
Checkbox text - Don't format the checkbox incorrectly
Checkbox interaction value states

Resources

Elements and Controls

Implementation