
- SAPUI5 Version 1.122
- SAPUI5 Version 1.120
- SAPUI5 Version 1.118
- SAPUI5 Version 1.116
- SAPUI5 Version 1.114
- SAPUI5 Version 1.112
- SAPUI5 Version 1.110
- SAPUI5 Version 1.108
- SAPUI5 Version 1.106
- SAPUI5 Version 1.104
- SAPUI5 Version 1.102
- SAPUI5 Version 1.100
- SAPUI5 Version 1.98
- SAPUI5 Version 1.96
- SAPUI5 Version 1.94
- SAPUI5 Version 1.92
- SAPUI5 Version 1.90
- SAPUI5 Version 1.88
- SAPUI5 Version 1.86
- SAPUI5 Version 1.84
- SAPUI5 Version 1.82
- SAPUI5 Version 1.80
- SAPUI5 Version 1.78
- SAPUI5 Version 1.76
- SAPUI5 Version 1.74
- SAPUI5 Version 1.72
- SAPUI5 Version 1.70
- SAPUI5 Version 1.68
- SAPUI5 Version 1.66
- SAPUI5 Version 1.64
- SAPUI5 Version 1.62
- SAPUI5 Version 1.60
- SAPUI5 Version 1.58
- SAPUI5 Version 1.56
- SAPUI5 Version 1.54
- SAPUI5 Version 1.52
- SAPUI5 Version 1.50
- SAPUI5 Version 1.48
- SAPUI5 Version 1.46
- SAPUI5 Version 1.44
- SAPUI5 Version 1.42
- SAPUI5 Version 1.40
- SAPUI5 Version 1.38
- SAPUI5 Version 1.36
- SAPUI5 Version 1.34
- SAPUI5 Version 1.32
- SAPUI5 Version 1.30
- SAPUI5 Version 1.28
- SAPUI5 Version 1.26
- Latest SAPUI Version 1.124
- SAPUI5 Version 1.122
- SAPUI5 Version 1.120
- SAPUI5 Version 1.118
- SAPUI5 Version 1.116
- SAPUI5 Version 1.114
- SAPUI5 Version 1.112
- SAPUI5 Version 1.110
- SAPUI5 Version 1.108
- SAPUI5 Version 1.106
- SAPUI5 Version 1.104
- SAPUI5 Version 1.102
- SAPUI5 Version 1.100
- SAPUI5 Version 1.98
- SAPUI5 Version 1.96
- SAPUI5 Version 1.94
- SAPUI5 Version 1.92
- SAPUI5 Version 1.90
- SAPUI5 Version 1.88
- SAPUI5 Version 1.86
- SAPUI5 Version 1.84
- SAPUI5 Version 1.82
- SAPUI5 Version 1.80
- SAPUI5 Version 1.78
- SAPUI5 Version 1.76
- SAPUI5 Version 1.74
- SAPUI5 Version 1.72
- SAPUI5 Version 1.70
- SAPUI5 Version 1.68
- SAPUI5 Version 1.66
- SAPUI5 Version 1.64
- SAPUI5 Version 1.62
- SAPUI5 Version 1.60
- SAPUI5 Version 1.58
- SAPUI5 Version 1.56
- SAPUI5 Version 1.54
- SAPUI5 Version 1.52
- SAPUI5 Version 1.50
- SAPUI5 Version 1.48
- SAPUI5 Version 1.46
- SAPUI5 Version 1.44
- SAPUI5 Version 1.42
- SAPUI5 Version 1.40
- SAPUI5 Version 1.38
- SAPUI5 Version 1.36
- SAPUI5 Version 1.34
- SAPUI5 Version 1.32
- SAPUI5 Version 1.30
- SAPUI5 Version 1.28
- SAPUI5 Version 1.26
Comparison Micro Chart
sap.suite.ui.microchart.ComparisonMicroChart
Intro
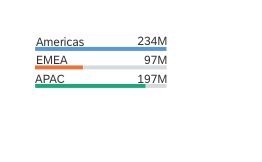
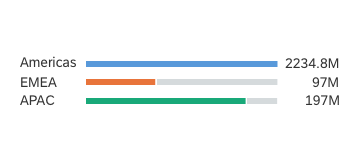
The comparison micro chart is a bar chart. It compares entries in a top N list. Depending on the width of the parent container, it can have two different layouts: normal view and wide view. You can use either the semantic chart palette or the qualitative chart palette.
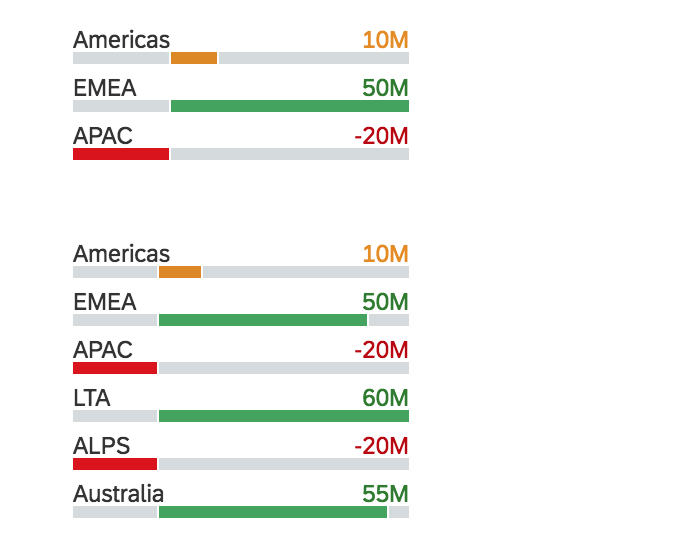
Comparison micro charts in normal view
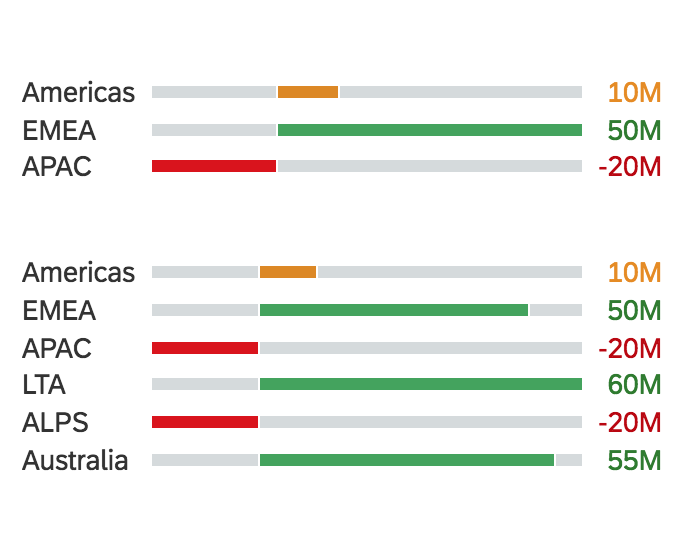
Comparison micro charts in wide view
Responsiveness
The comparison micro chart is fully responsive. The size adjusts dynamically based on the dimensions of the parent container. In addition, there are also four fixed sizes – L, M, S and XS. Each fixed size is a snapshot of the fully responsive micro chart for specific dimensions.
Comparison micro chart with 3 bars - Size L
Comparison micro chart with 3 bars - Size M
Comparison micro chart with 3 bars - Size S

Comparison micro chart with 3 bars - Size XS
You can use the smallest XS size to embed the comparison micro chart in the table cells of the grid table, analytical table, or tree table (also in condensed mode). Left-align the comparison micro chart in the table cell.
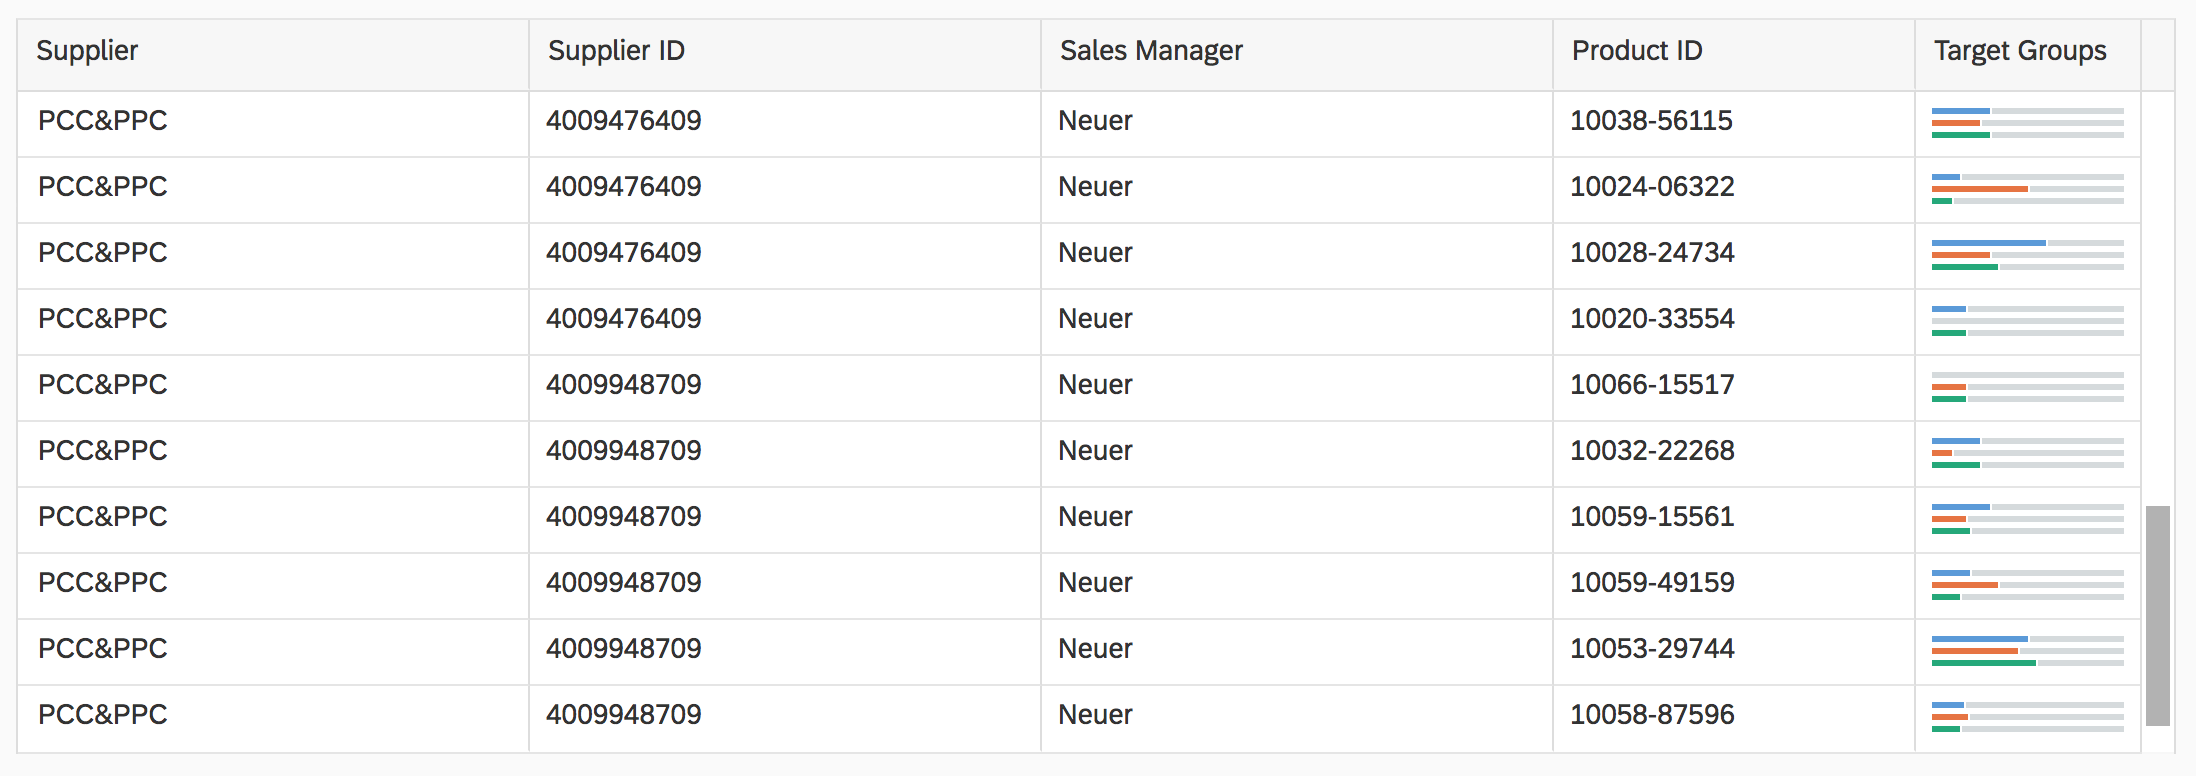
Comparison micro chart with 3 bars in XS size in the grid table
Maximum and Minimum Sizes
The column micro chart can have the following dimensions:
| Width | Height | |
| Maximum | 320 px | 94 px |
| Minimum | 64 px | 18 px |
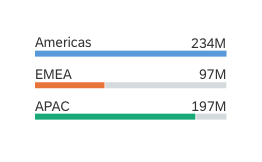
In normal view, the labels for the bars are positioned on top of each bar.
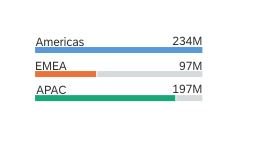
If the chart width exceeds 192 px, the chart goes into wide view and the labels for the bars are positioned on both sides of the bar.
If the chart width is 96 px or less, the labels are hidden.
Comparison micro chart with 3 bars and labels on both sides
Comparison micro chart with 3 bars and labels above
Comparison micro chart with 3 bars without labels
Guidelines
- Use a maximum of 12 bars in a single comparison micro chart.
- We strongly recommended using at least 2 bars in a single chart to visualize a comparison.
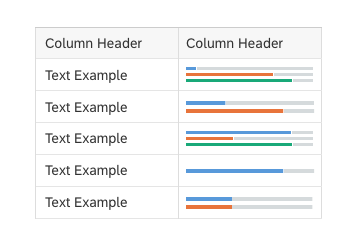
- When embedding comparison charts in tables, use the same number of bars for all the charts in a given table column. This makes the data comparable and avoids misleading the user. Use a suitable column header to describe the embedded charts.
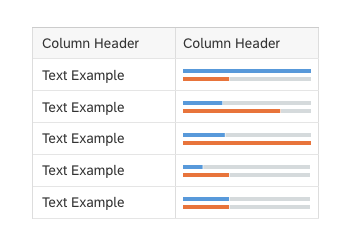
Use comparison charts with the same number of bars in a table column
Do not use comparison charts with different numbers of bars in the same table column
Resources
Want to dive deeper? Follow the links below to find out more about related controls, the SAPUI5 implementation, and the visual design.
Implementation
- Comparison Micro Chart (SAPUI5 samples)
- Comparison Micro Chart (SAPUI5 API reference)
 Your feedback has been sent to the SAP Fiori design team.