Chart Color Palettes

SAP Fiori uses qualitative, sequential, and semantic color palettes for chart visualization.

This article explains what the three color palettes are designed to do and how you can leverage their unique properties.

Palette Overview

For color names and HEX values, see Chart Color Palettes – Values and Names.

Qualitative Color Palette

Designed to provide visual differentiation between data points using a specific order of colors.

Qualitative colors
Qualitative colors

Sequential Color Palette

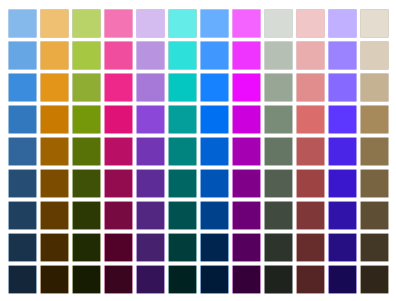
There are 12 colors with 9 tints and shades for each, which are designed to visualize high to low values.
Guidelines
It is not recommended to use more than six sequential tints and shades for different measures.
Sequential chart colors

Semantic Color Palette

Designed to communicate good (positive), bad (negative), critical and neutral values. The naming of the semantic values is generic and application teams determine the contextual usage of semantics within the charts.
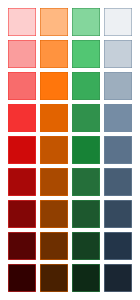
Semantic colors
Semantic colors

Rules

  1. Only use colors contained in the SAP chart palettes.
    To ensure that we maintain visual design consistency across all charts used in all SAP applications, you should only use colors from the SAP color palettes.
  2. Only use one palette per chart.
    Don’t combine colors from different palettes in the same chart. Each palette has been carefully designed to serve a distinct purpose.
  3. Ensure chart color token names are referenced in the code – not HEX values!
    To support consistent color implementation across SAP UI technologies, as well as our theming capabilities, colors are defined by token names. This means that the HEX values of the colors may not be exactly the same in past, present, and future SAP visual design themes. This flexibility is made possible by the fact that the color token names will stay the same across all past, present and future SAP themes. You can get the color names and corresponding HEX values from the article on color palette values and names.
  4. Don’t use color to distinguish between forecast, actual, and target values.
    Use semantic patterns instead.

Default Colors

By default, every chart type comes with built-in colors that are applied automatically, based on your dataset. Here are three examples:

1. When only one series is displayed, the first color from the qualitative palette is automatically applied to each item.
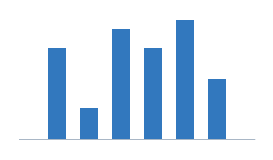
Column chart: One series

2. When multiple series are displayed, more colors from the qualitative palette are automatically applied to each item in the predetermined sequence.
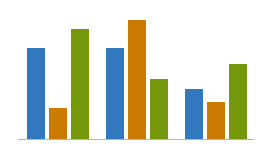
Column chart: Three series

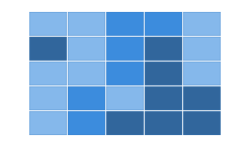
3. Colors from the sequential palette are automatically applied to the heatmap.

Default colors in a heatmap

Changing the Colors

There are three ways to change the colors in charts:

By Category Item

In the example below, one category has been highlighted using the second color from the qualitative palette.

Column chart with a highlighted category

By Series

In the example below, the series use different shade of the same color because one series must be more visible than the other.
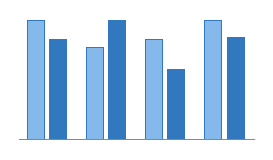
Column chart: Two series

Based on Value

In the semantic color example below, the data points are red if their value is below a certain threshold, green if their value is above another threshold, and orange if their value is between the two.
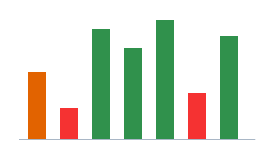
Column chart with encoded values
Developer Hint

  • You can customize chart colors using the property: plotArea.dataPointStyle.
  • When you customize the colors, you must define colors for all your data points.
  • If no color has been assigned to a particular data point, the chart component automatically assigns the color black to indicate that no color has been assigned.
  • If for some reason multiple colors are assigned to the same data point, the last assigned color is applied.
  • You must manually define the labels that are associated with the colors in the legend. The chart components can’t do this automatically.

Qualitative Palette

The colors in the qualitative palette don’t carry semantic meaning. The palette has been designed to provide visual differentiation between data points by virtue of the fact that each color is visually distinct.

Guidelines

  • We recommend using the colors in the sequence illustrated, as opposed to using any colors simply because you prefer them.
  • It is not recommended to overload charts with additional colors. Nevertheless, for edge cases, you can apply darker shades of the same colors using the sequence palette, as shown in this example.

Qualitative palette
Qualitative palette
Qualitative palette - additional colors

For color names and HEX values, see Chart Color Palettes – Values and Names. Darker shades shown are taken from the sequence palette. Example: sapChart_Sequence_1_Minus2, sapChart_Sequence_2_Minus2,  sapChart_Sequence_3_Minus2, etc.

Highlight Category Items

By default, all the categories use the first color from the qualitative palette. However, you can use other colors from the qualitative palette if you want to highlight category items.

Using the qualitative palette to focus on a category item

Group Items by Color

You can use the qualitative palette to group items into categories. In this example, we use green for Europe, blue for America, and orange for Asia.

Using the qualitative palette to show a hierarchy

Semantic Palette

The semantic palette is designed to communicate bad (negative), critical, good (positive), and neutral values.

To maximize flexibility for chart design application teams, the semantic palette contains a selection of 9 tints and shades in each of the 4 main semantic colors.

Guidelines
We recommend reducing the number of colors to five or six shades to visualize each semantic level.
Semantic palette
Semantic palette

For the full set of color options, including color names and HEX values, see Chart Color Palettes – Values and Names.

Using the Semantic Palette

Here are some ways you can use the semantic palette:

Illustrate the Top Three Values

This column chart uses the semantic palette to display the sales revenue per month. The color green is used to highlight the top three months with the highest revenue.
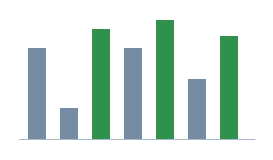
Column chart: Top three values

Show Positive and Negative Series

These stacked bars represent the availability of materials. The available series is green, the inspection series is orange, and the blocked series is red.
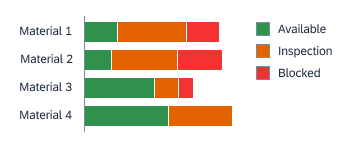
Stacked bars: Good and bad values

Denote Good or Bad Values

Each data point has a color based on its value. Data points are red if their value is below a certain threshold, green if their value is above another threshold, and orange if their value is between the two.
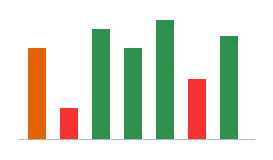
Column chart: Good and bad values

Visualize Different Levels

In this geomap, green is used to indicate states with good performance, and red for states with bad performance. The different shades express different levels of good and bad performance.
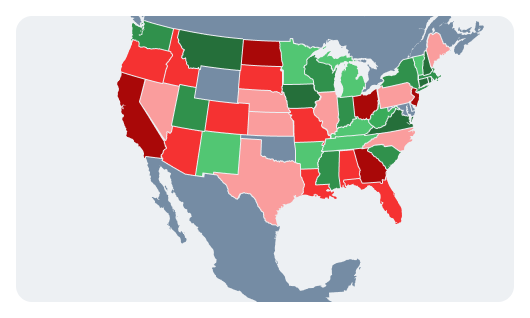
Geomap: Levels of performance

Default Color Shade Names

The default color shade names in the semantic palette are:

  • sapChart_Sequence_Bad
  • sapChart_Sequence_Critical
  • sapChart_Sequence_Good
  • sapChart_Sequence_Neutral
Column chart: Level 1 of the semantic palette

Selecting the Correct Combination of Shades (Semantic Palette)

There are 4 semantic colors with 9 tints and shades for each that are used to maximize flexibility for chart design application teams. For the full set of color options, see Chart Color Palettes – Values and Names.

The table below gives an example of how to combine shades for bad (negative) values. You can apply the same principle to critical, neutral, and good (positive) values.

No. of Levels

Shades to Use

Color Token Names

1 level

sapChart_Sequence_Bad

2 levels

sapChart_Sequence_Bad_Plus2
sapChart_Sequence_Bad

3 levels

sapChart_Sequence_Bad_Plus2
sapChart_Sequence_Bad
sapChart_Sequence_Bad_Minus2

4 levels

sapChart_Sequence_Bad_Plus2
sapChart_Sequence_Bad_Plus1
sapChart_Sequence_Bad
sapChart_Sequence_Bad_Minus1

5 levels

sapChart_Sequence_Bad_Plus2
sapChart_Sequence_Bad_Plus1
sapChart_Sequence_Bad
sapChart_Sequence_Bad_Minus1
sapChart_Sequence_Bad_Minus2

6 levels

sapChart_Sequence_Bad_Plus3
sapChart_Sequence_Bad_Plus2
sapChart_Sequence_Bad_Plus1
sapChart_Sequence_Bad
sapChart_Sequence_Bad_Minus1
sapChart_Sequence_Bad_Minus2

Guidelines

  • We recommend reducing the number of colors to five or six shades to visualize each semantic level.
  • It’s important to select the correct combination of shades according to the number of levels you want to express, as in the best-practice example above.

Sequential Palette

The sequential color palette is designed to visualize high to low values for different measures.

Generally speaking, the lighter the shade, the lower the value. The darker the shade, the higher the value.

Sequential palette
Sequential palette

For color names and HEX values, see Chart Color Palettes – Values and Names.

Using the Sequential Palette

Here are some ways you can use the sequential palette:

Distinguish between Past and Present

These two series use different shades of the same color to distinguish between last year and the current year.

Column chart: Two series

Show Time Gradation

These stacked bars represent payable aging by country. The different gradations of brightness are used to represent different time periods.
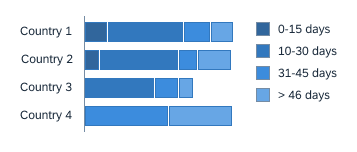
Stacked bars: Time gradation

Visualize Different Levels

This bullet chart shows direct costs in a dark shade and indirect costs in a light shade.

Bullet chart: Different levels

This geomap contains two measures. Shades of blue are used to visualize high and low values for one measure while shades of orange are used to visualize high and low values for the other measure.

Geomap: Multiple levels in two groups

Ranked Values

In this bubble chart, the size of the bubbles represents future sales deals. The probability of converting these deals is expressed using different shades of blue.
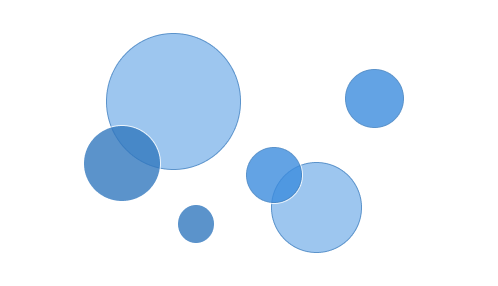
Bubble chart: Ranked values

Selecting the Correct Combination of Shades (Sequential Palette)

There are 12 colors with 9 tints and shades for each that are used to maximize flexibility for chart design application teams.

The table below gives an example of how to combine shades for the default category item color (sapChart_Sequence_1). You can apply the same principle to the other colors in the palette.

No. of Values

Shades to Use

Color Token Names

1 level

sapChart_Sequence_1

2 levels

sapChart_Sequence_1_Plus2
sapChart_Sequence_1

3 levels

sapChart_Sequence_1_Plus2
sapChart_Sequence_1
sapChart_Sequence_1_Minus2

4 levels

sapChart_Sequence_1_Plus2
sapChart_Sequence_1_Plus1
sapChart_Sequence_1
sapChart_Sequence_1_Minus1

5 levels

sapChart_Sequence_1_Plus2
sapChart_Sequence_1_Plus1
sapChart_Sequence_1
sapChart_Sequence_1_Minus1
sapChart_Sequence_1_Minus2

6 levels

sapChart_Sequence_1_Plus3
sapChart_Sequence_1_Plus2
sapChart_Sequence_1_Plus1
sapChart_Sequence_1
sapChart_Sequence_1_Minus1
sapChart_Sequence_1_Minus2

Guidelines

  • We recommend reducing the number of colors to five or six shades to visualize each semantic level.
  • It’s important to select the correct combination of shades according to the number of levels you want to express, as in the best-practice example above.

Resources

Elements and Controls

Implementation

SAP Theming Base Content
Chart tokens and technology-specific variables are provided as part of the GitHub repository of SAP themes.

SAP Fiori Launchpad

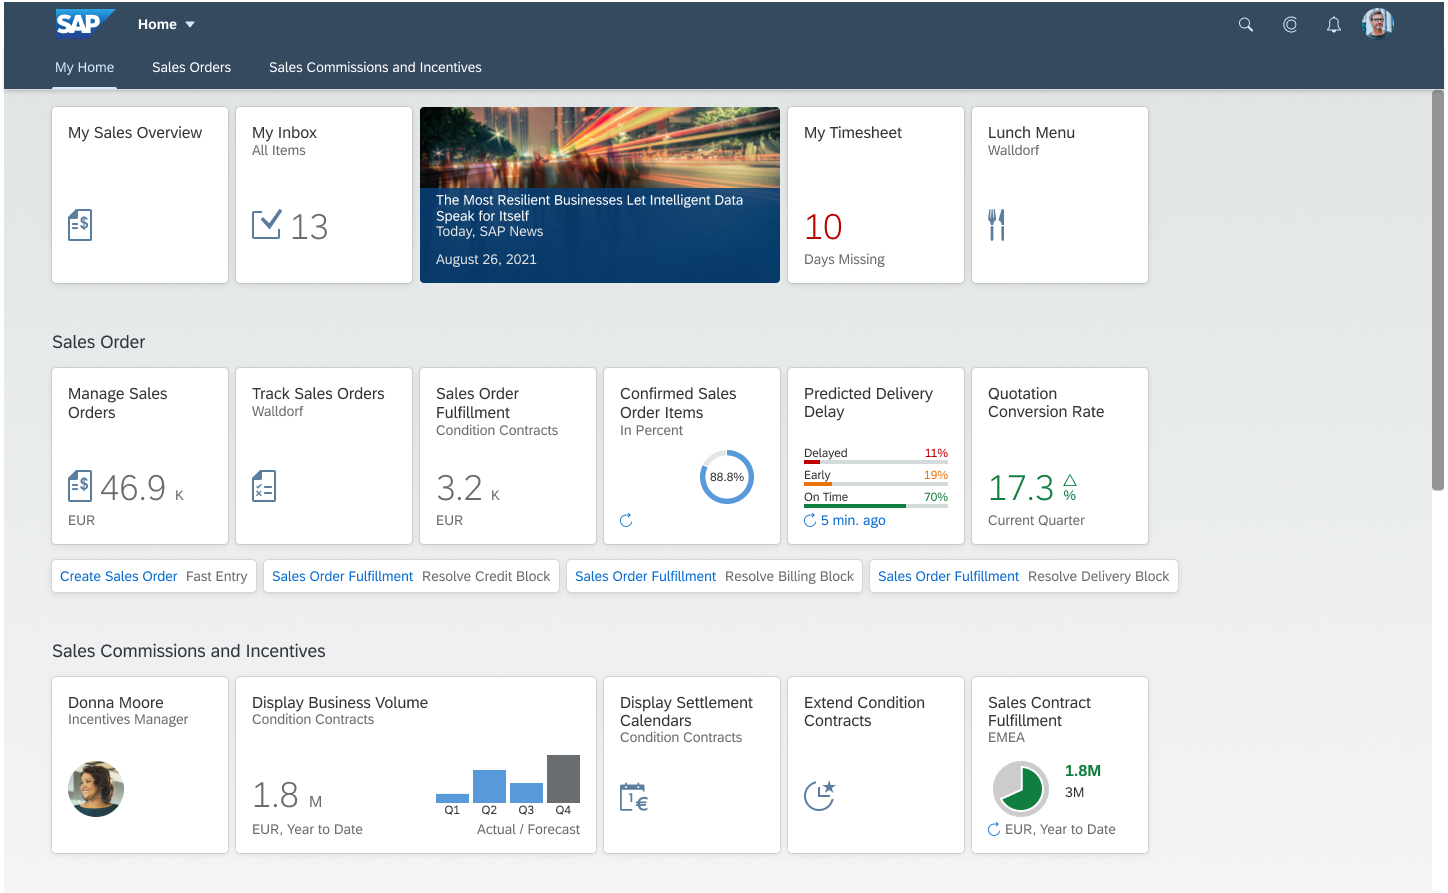
The SAP Fiori launchpad is a shell that hosts SAP Fiori apps, and provides the apps with services such as navigation, personalization, embedded support, and application configuration.

The launchpad is the entry point to SAP Fiori apps on mobile and desktop devices. The launchpad displays a home page with tiles. Each tile represents a business application that the user can launch. Tiles can also display live status indicators, such as the number of open tasks. The launchpad is role-based. In other words, the user’s role determines which app tiles are shown.

This article provides an overview of the main elements of the SAP Fiori launchpad.

Information
With SAP UI5 1.75, we introduced SAP Fiori launchpad spaces in parallel to the SAP Fiori launchpad home page. Users can switch between the two with the user actions menu.

Home Page

The home page is the heart of the launchpad and the central access point for SAP Fiori apps.

The page contains tiles, which are used to launch apps and can also show additional application information. Users can personalize the home page by adding, removing, and grouping app tiles. Because the launchpad is role-based, only apps that are relevant for the user’s role profile are shown.

SAP Fiori launchpad - home page

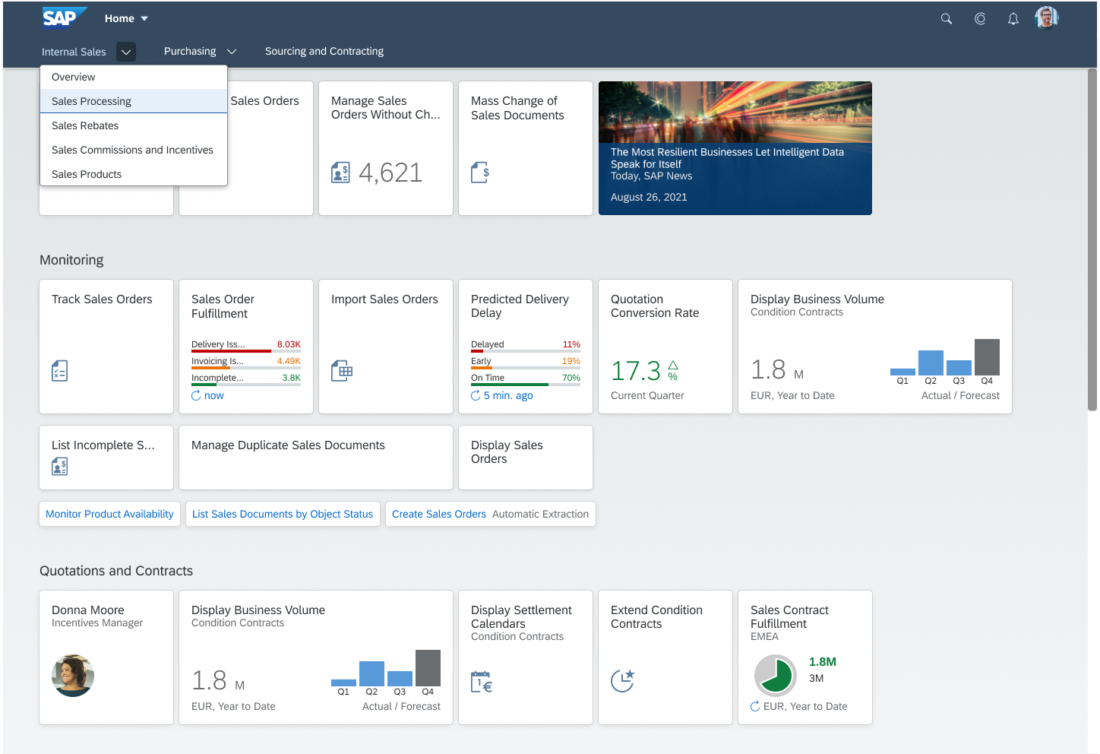
Spaces

A space and its pages structure the most relevant apps for users with a certain business role. We recommend including only information and apps that users need to begin their daily business.

Launchpad spaces display tiles that allow users to launch apps. They may also show additional application information. Users can personalize the home page by adding and removing apps, or bundling them in groups. As the launchpad is role-based, only apps that are relevant for the user’s role profile are shown.

SAP Fiori launchpad - spaces

User Actions Menu

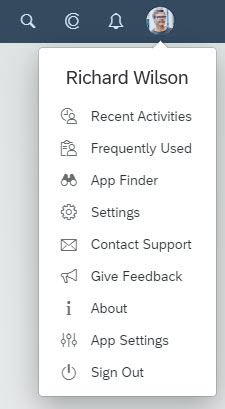
The user actions menu offers a range of user-specific services. It is accessed by clicking the icon or photo on the right-hand side of the shell bar. The user actions menu is available in all SAP Fiori screens.

The following options are always available, regardless of the current context:

  • General settings and preferences
  • A catalog of available apps (the app finder)
  • Objects and apps recently visited by the user
  • An About dialog, with details about the SAP Fiori launchpad or app version.
  • A Sign Out option for logging off the SAP Fiori launchpad.

The following options depend on the current context:

  • On the launchpad home page, the user actions menu contains an Edit Home Page feature for personalizing the content of the home page.
  • For some apps, the user actions menu might also offer app-specific settings.

In addition, customers can activate additional options for contacting the support team or giving feedback.

SAP Fiori launchpad - User actions menu

Notifications

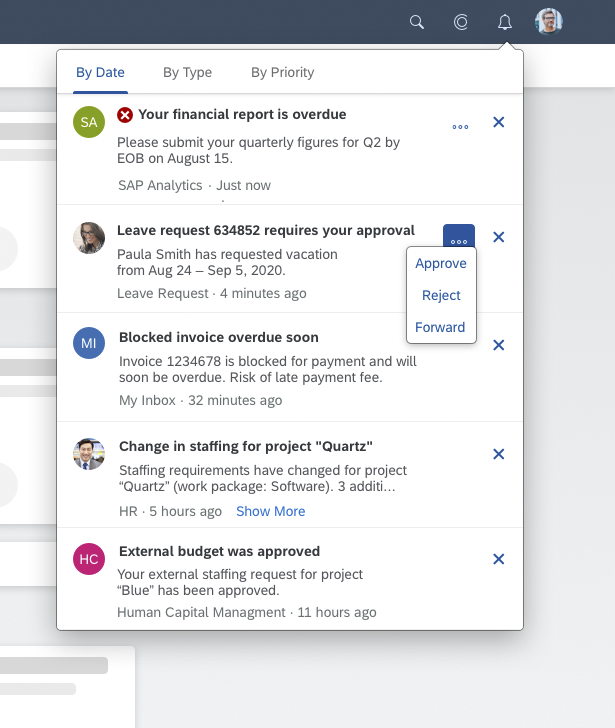
Users can access notifications by clicking the Notifications button on the right of the shell bar.

The notification list displays system-generated notifications from various sources, such as the workflow inbox or chat notifications. Notifications can be prioritized and organized into groups of similar items. From the notification message, users can navigate to the underlying app. Depending on the configuration, notifications can also offer buttons for taking immediate action.

SAP Fiori launchpad - Notifications

Components

Tile

A tile is a container that represents an app on the SAP Fiori launchpad home page. Tiles are used for launching apps and presenting them on the launchpad.

For more information, see Tile.

App Finder

The app finder is  an “app store”-like interface that lists all the apps that a user might potentially use. The app finder replaces the tile catalog.

For more information, see App Finder.

Shell Bar

The launchpad shell bar is always visible at the top of the screen. It offers access to cross-application functions, such as the enterprise search, SAP CoPilot, the user actions menu, and notifications. It also contains the page title with further app navigation options, as well as a branding area. Once the user opens an app, a Back button appears on the left of the shell bar.

For more information, see Shell Bar.

Enterprise Search

The SAP Fiori launchpad offers an enterprise search function that searches across all apps and business objects.

For more information, see Enterprise Search.

Services

The SAP Fiori launchpad provides a range of central services that can be used by application development teams. For example, the launchpad handles all navigation between apps, and offers controls for gathering user feedback and contacting the support team.

For more information, see Services.

System Information Bar

With SAP S/4HANA Cloud, customers and partners receive a three-system landscape: a development system, a test system, and a production system.

The system information bar in the development and test systems allows users to quickly recognize the system they are using. The system information bar is located above the shellbar. By default, the system information bar is turned on in all non-production systems.

For more information, see System Information Bar.

Overview Page – UI Text Guidelines

Texts for the overview page include:

The sections below describe the guidelines for each of these texts.

Note: These guidelines do not cover the texts for imported elements shown on the card body, such as tables or graphics.

Basics

  • Ensure that the card texts on the overview page are easy to read. Users need to grasp the information on each card at a glance.
  • Be clear. If necessary, provide context for the information you are showing, such as an explanation or filter criteria.
  • Be consistent. When you work on an overview page, always consider the texts for each card in the context of the overview page as a whole.
  • Bear in mind that other languages may need more space.

Guidelines by Text Type

Page Title

The page title appears on the launchpad tile and in the application header for the overview page itself. Where possible, use the same text for both.

Guidelines

  • Use a noun-based name (for example, “Procurement Center”).
  • Use title case.
  • Choose a name that best fits your use case and the conventions in your business.
    For example, do your users think in terms of the role, or the business area? What terms are they most familiar with? Look for a name that fits for all the cards you are including. Also consider the terms already used in your application area.
  • Do not use the term “Overview Page”. This is just the name of the floorplan. However, it’s OK to use “Overview” on its own.
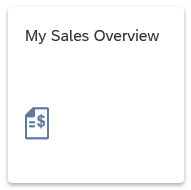
Launchpad tile an overview page
Overview page title in the launchpad shell bar

Card Title

The title is the top element on all cards and is always required. The title for a stack of cards is also used as the heading for the detail view.

Guidelines

  • Use title case.
  • Be concise. Aim for one-line texts, which are easier to scan. If you need more space, try not to exceed 2 lines.
Concise title (eyecatcher)
  • Don’t overload the title with too much information.
    If the title is short, consider including qualifying information in the title.
    If the title is longer, or the qualifying information is more complex, use a subtitle for the qualifier.
  • Recommended: Use a consistent pattern across all the cards on your overview page.
Titles can also include qualifiers - if they are not too long

Card Subtitle

The subtitle is optional. You can use it to qualify the title, offer an explanation, or show a status. The use of the subtitle can differ, depending on the card type.

Guidelines

  • Use title case.
    Exception: Use sentence style for longer explanations, or statuses involving time periods or numbers.
  • If you have a mixture of subtitles in sentence style and title case, consider changing them all to sentence style.
Subtitle with simple qualifier
Explantory subtitle (sentence style)
Subtitle with relative time period (sentence style)
  • If your subtitle contains multiple qualifiers, separate them with commas.
Multiple qualifiers
Multiple qualifiers
  • If you need to qualify amounts (unit, currency), use the following format:
    (<Unit> <Currency>)
  • If the subtitle contains multiple qualifiers, place the currency at the end. Use | to separate the preceding qualifier from the currency. Do not write “in <Currency” (for example, “in EUR”), as this doesn’t translate well in all languages.
  • If you are using both a title and subtitle, ensure that both texts can be translated independently.
Subtitle with scaling factor and currency

Actions

Actions can appear at the bottom of the quick view card.

Guidelines

The action buttons on cards follow the same text conventions as all other action buttons:

  • Use title case.
  • Start with a verb.
  • Keep the text as short as possible.

Resources

Want to dive deeper? Follow the links below to find out more about related resources.

Elements and Controls

Implementation

No links