Chart – Distribution

This page will help you choose an appropriate chart for visualizing how values are distributed within a set.

For example: You want to visualize how the number of employees are distributed across different salary ranges, or you want to compare the distribution of salaries across different job levels.

Single Distribution

You can use a histogram or a frequency polygon to visualize how values are distributed within one set of values.

Histogram

A histogram is used to display a number of values distributed across a series of ranges. Histograms are extremely useful for emphasizing the number of values.

The convention for a histogram is to remove the gaps between the bars or columns. However, as this chart is not yet available in SAP Fiori, you can use a classic column chart or bar chart instead.

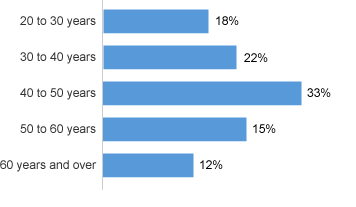
The chart below shows how the rating of a product is distributed.
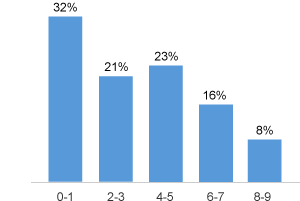
Histogram with vertical bars

If the labels of the ranges are long compared to the width of the chart, it’s better to use horizontal bars as illustrated below. If you follow this advice, you will avoid the undesirable effects that come as a result of displaying the category labels at 45°, making them hard to read and frequently leading to truncation of text.

Histogram with horizontal bar

Frequency Polygon

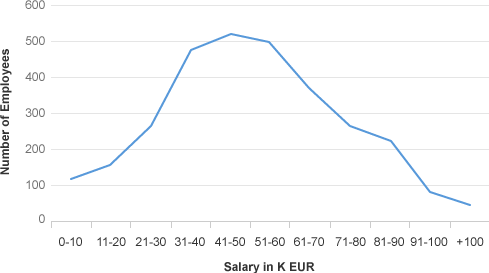
If you want to emphasize the shape of the distribution more than the number of values, then use a ‘frequency polygon’ which is really just a line chart that shows the distribution of a frequency of something. The chart below shows how salaries are distributed within a company.

Frequency polygon
Frequency polygon

Multiple Distribution

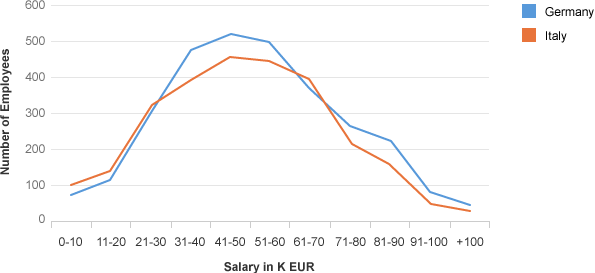
You can use a frequency polygon with multiple lines if you want to compare the distribution of multiple sets of values. The chart below compares the distribution of salaries between two countries.

Frequency polygon with two series

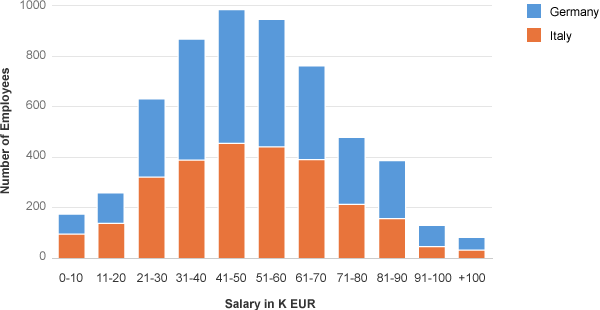
You can use a ‘stacked histogram’ if you want to split the distribution into multiple parts, as illustrated below.

Stacked histogram with two series

Box Plot

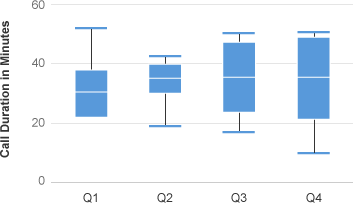
The Box plot is an ideal chart if you want to display how a distribution changes over time, or you want to compare many distributions. The example below illustrates a typical box plot with the median including the lower and higher quartiles and the highest and lowest value.

Please note that the box plot is not yet available in the SAP Fiori chart library.

Box plot
Box plot

Resources

Want to dive deeper? Follow the links below to find out more about related controls, the SAPUI5 implementation, and the visual design.

Elements and Controls

Implementation

Chart – Ranking

This page will help you choose the correct chart for ranking items based on numeric values. This is useful for identifying category items with the largest or smallest values.

By Category

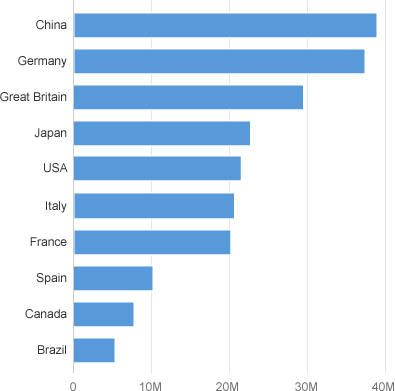
We recommend using a bar chart to display a list of category items sorted by value (for example, a product ranking by revenue).

In the chart below, it is easy to:

  • Understand that the category items are sorted by values.
  • Identify the top-ranking countries and the lowest-ranking countries.
  • See that all the countries in the middle have values that are very close together.
Category items ranked by value

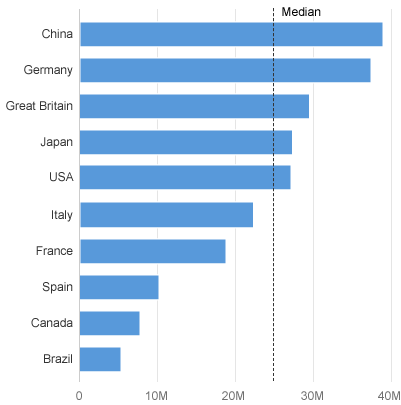
If you’re also interested in seeing how the values are distributed among category items, you can display a reference line that indicates the median.

Category items ranked by value, with median

Bar Chart vs. Column Chart

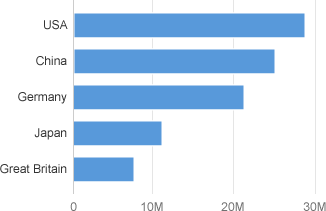
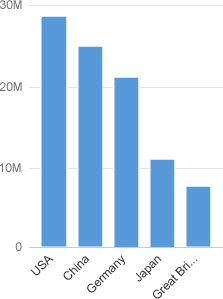
It’s worth noting that you can use a column chart or a bar chart, but if the category is not time-based (or does not have an intrinsic order), we recommend using a bar chart. If you follow this advice, you will avoid the undesirable effects that come as a result of displaying the category labels at 45°, which as well as making them hard to read, also often leads to truncation of text. See the example below with the truncated ‘Great Britain’ label.

Bar chart with nicely displayed labels
Column chart with truncated labels at 45°

Within a Hierarchy

You can rank items within groups of the hierarchy.

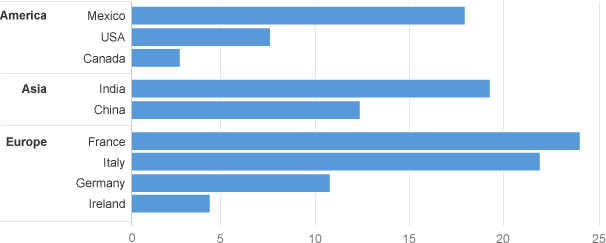
In the example below, the countries are ranked inside their respective continents which makes it easy to compare each continent and each country within each continent.

Ranked groups inside a hierachy

Flat Hierarchy

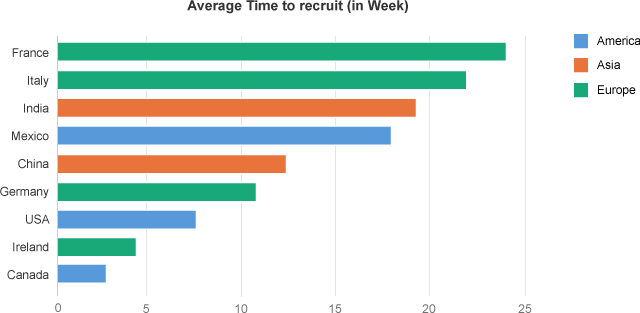
When the hierarchy does not contain many items, you can flatten it and use color to identify the first level of the hierarchy.

In the chart below, you can immediately grasp which top 3 countries have the highest values and that America has the smallest values.

Ranked items in a flat hierachy

The chart below is used in the Cash Management app and displays the liquidity forecast by outcome and income. Displaying the outcome and income seperately helps to identify which income and outcome are the biggest.

Positive and negative items ranked separately

Ranking and Parts to Whole

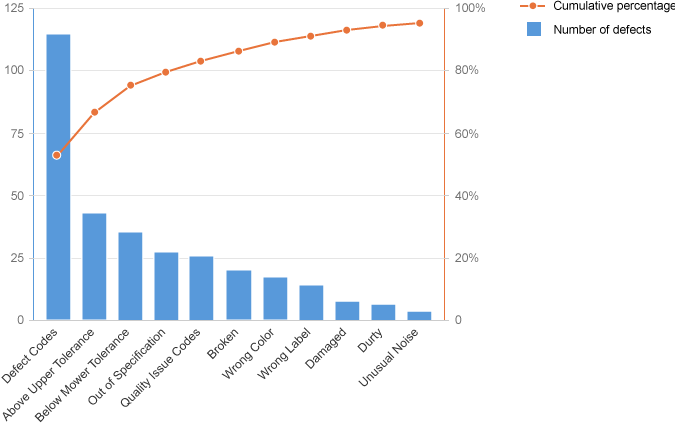
If you want to know which items have the biggest values and how much of these items contribute to the total of the values, you can use a Pareto chart which is designed to illustrate the well-known 80%/20% rule (that is, 20% of the items contribute to 80% of the total).

The chart below displays the number of defects by type of defect, and we can see that 80% of the defects come from the first four types of defect.

Pareto chart
Pareto chart

Resources

Want to dive deeper? Follow the links below to find out more about related controls, the SAPUI5 implementation, and the visual design.

Elements and Controls

Implementation

Chart – Correlation

This article explains how to visualize the relationship between two or three sets of numerical values, and how these values relate to each other.

Scatter charts and bubble charts are the most frequently used charts to visualize a correlation, although using a line chart or bar chart side-by-side is also an acceptable solution.

Two Datasets

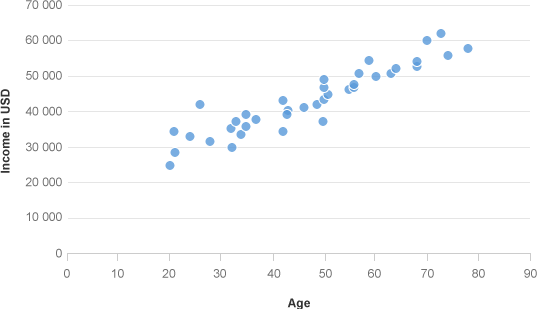
The scatter plot is the most efficient chart to show the correlation between two sets of numerical values. The chart below illustrates the correlation between age and income.

Correlation with a scatter plot

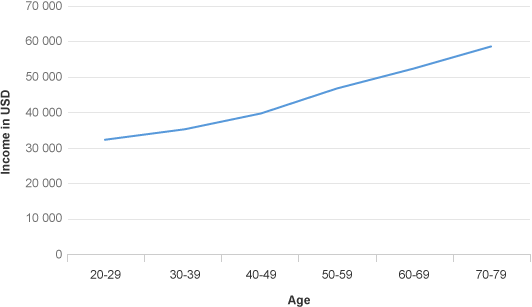
You can also group all the data points in ranges and display one average value per range, as illustrated below.

Correlation with a line chart

Few Items

When you have a small number of items, you can display the datasets in two sets of bars. This allows you to display the item name just once. Both sets of bars should be sorted by the first set or the second set to make the relationship easily visible by comparing the two shapes.

In the chart below, we can easily see that there is a direct correlation between Revenue and Margin, although ‘Servers’ is an outlier.

Correlation between 2 sets of values in bar chart

Three Datasets

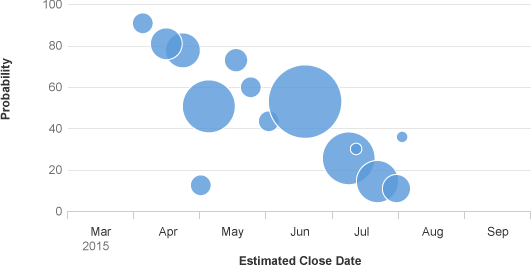
You can use a bubble chart to show the correlation between three sets of numerical values. One set can be displayed in the horizontal axis, another set can be displayed in the vertical axis, and the third set can be represented by the size of the bubbles.

It’s difficult to precisely compare the size of bubbles. Therefore, it’s better to only use the Bubble chart when you want people to grasp a rough approximation of the values represented by the size of the bubbles.

The bubble chart below shows how the probability of the sales opportunty relates to the estimated close date and the expected revenue which is represented by the size of the bubble. In this context, the sales opportunity bubble usually begins in the bottom right quadrant, and moves to the top left quadrant of the chart over time.

Correlation with a bubble chart

Resources

Want to dive deeper? Follow the links below to find out more about related controls, the SAPUI5 implementation, and the visual design.

Elements and Controls

Implementation

Chart – Variation Over Time

This article illustrates the different ways you can visualize changes of measures over time. The exact type of chart depends on the type of change you want to visualize and the number of time periods.

Time Category and Time Axis

By convention, time is represented horizontally from left to right which means it’s best to use the horizontal axis to represent the time in chart visualizations. We recommend using the time axis which has three main advantages:

  • It allows you to display dates and times in a responsive manner.
  • All the complexity involved with formatting the axis labels is automatically taken care of.
  • The physical spacing between the data points accurately respects the time scale, as opposed to just displaying them equidistantly.

Additional Categories

In addition to the time category, there are additional categories that contain an intrinsic order and that that carry the notion of progression or trend.

For example, age, time period, or a rating.

As such, the rest of this article also applies to these categories.

Column or Line Chart?

  • Use a line chart if you want to emphasise the trend over time.
  • Use a column chart if you want to emphasise the values themselves.

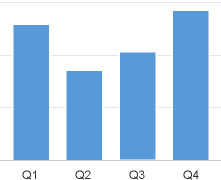
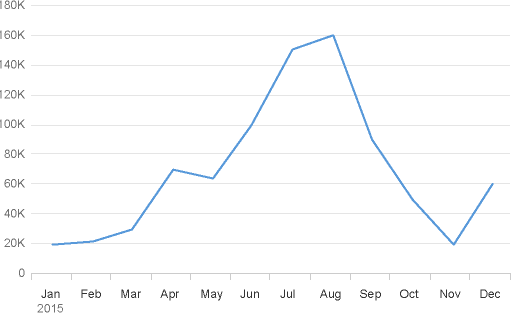
In the figure below, you can see that the trend of the values immediately stands out in the line chart, while we need to make an effort to visualize the trend of the values in the column chart. At the same time, the values can be compared more easily in the column chart.

Emphasis on trend
Emphasis on trend
Emphasis on values
Emphasis on values

One Set of Values

Illustrating the Trend

As previously stated, the line chart is the best way to illustrate a trend over time.

Trend over time
Trend over time

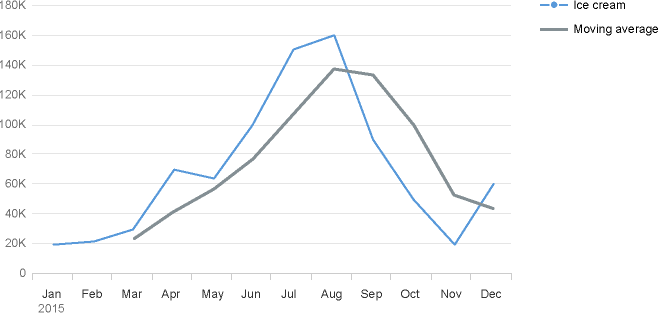
Sometimes it’s difficult to see the global trend when the values vary a lot. In these circumstances you can display a moving average in the same chart as illustrated below. You can see the three month moving average of the total demand of ice cream displayed as a black line. Please note that you should avoid using a straight line to represent the global trend because the inclination depends too much on the start date and end date and is therefore misleading.

Trend over time with a moving average

Variation

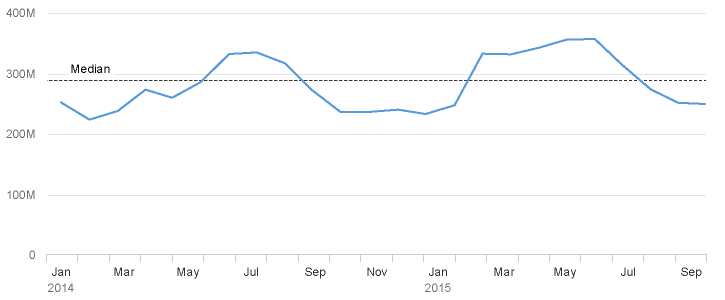
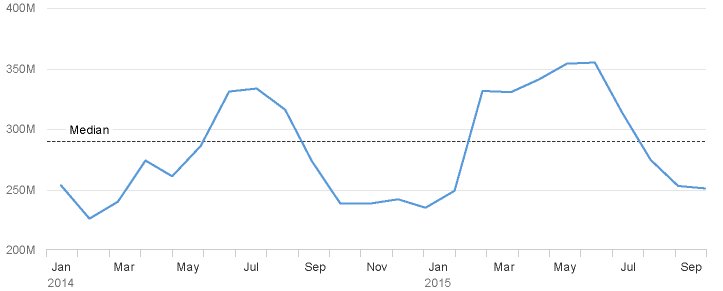
If you want to display how closely clustered or spread out a set of data is over time, use a line chart as illustrated below. However, as you can see the values fall within a range of 250M to 350M and the vertical axis begins at zero. This results in a small magnitude (which is not good for appreciating the variation) and a lot of wasted space below the blue value line.

Variability over time

Now look at the chart below where we have altered the scale on the vertical axis (effectively zooming in on it), thereby increasing the magnitude of the line to emphasize the variation. Also note how we’ve started the vertical axis at 200M instead of zero to eliminate the wasted space. You can see how these improvements emphasize the variability and use the available space more effectively.

Variability over time with a non-zero scale

Multiple Sets of Values

Illustrating Trends with Multiple Measures

You can display multiple lines in order to compare the trend of multiple values as illustrated in the chart below.

Trend for multiple measures

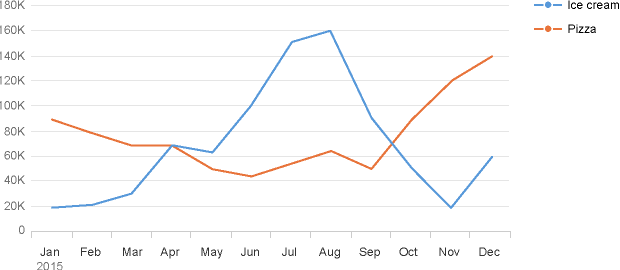
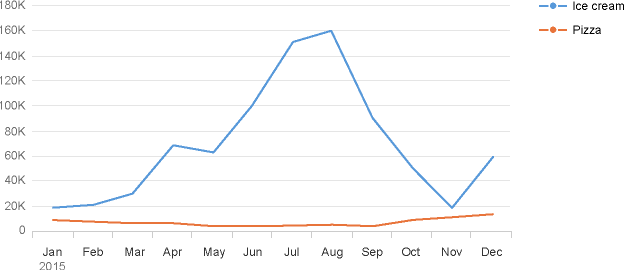
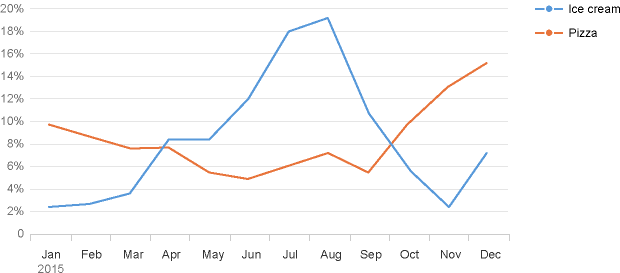
However, you can see that the measures do not have a similar magnitude in the chart below on the left. Not only is it hard to see the trend for the smallest measure (pizza), it is also difficult to compare both trends. Now look at the chart below to the right where we’ve transformed the actual sales figures into percentage figures. You will notice that it’s easier to recognize the trend for pizza, and it’s now much easier to compare trends.

Don't
Trend for two measures with vastly different orders of magnitude
Do
Trend for the same two measures, expressed as a percentage

Illustrating Trends with Different Units

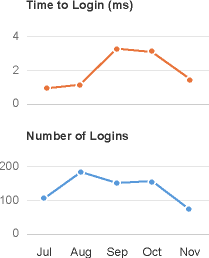
If you want to compare the trend of measures that have different units, it’s best to avoid using a line chart with a dual axis because they confuse the interpretation of the variation of values. It’s better use two separate line values which share the same horizontal axis as illustrated below.

Trend for two measures with different units

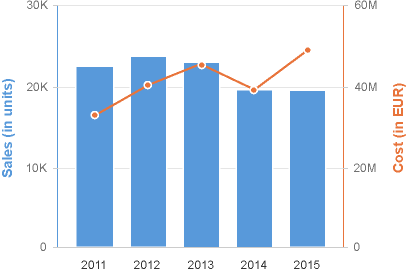
If you cannot display two separate values that share the same horizontal axis as illustrated above, but you have no option other than to display two measures in the same chart, we recommend using a combined column and line chart with a dual axis. In the chart below, the trend for Sales (in units) and the Cost (in USD) are clearly isolated from each other.
Trend for two measures with different units - Combined column and line

Example of What Not To Do

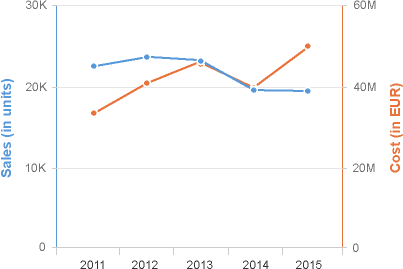
You may be tempted to place two lines in the same chart to show two measures which have different units. However, you can see how confusing this would be in the chart below – the lines overlap, but that has absolutely no meaning and is very misleading.

Do not display two measures with different units in the same chart

Combining Trends: Actual, Plan, Budget and Target

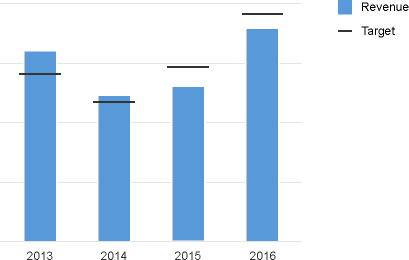
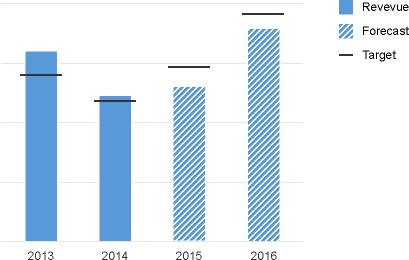
This section describes how to visualize the trend of values while comparing them with reference values such as plan, budget or target. The bullet chart below displays actual and target values for four years.

Trend for actual values

If you want to mix actual values with values that represent a projection in the future like a forecast or estimation, you can use a hatch pattern as represented below. For more information, see semantic patterns.

Trend for actual and forecasted values

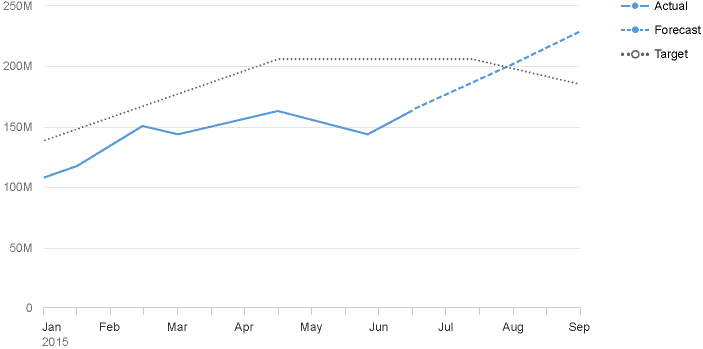
Note that in the bullet chart above, the most prominent element is the vertical bar, which represents the actual value or forecast value. This works well if you want to emphasize the actual or forecast. However, if the trend of the target is an important thing to visualize and there are many time periods, it makes more sense to display two lines to represent the trend of the two measures. In the example below, the black dotted line represents the evolution of the target over time.

Trend for actual and planned values

Trend of Deviation

If you want to show how the deviation between two measures evolves through the time, please refer to the deviation article (see: time deviation).

Multiple Rates of Change

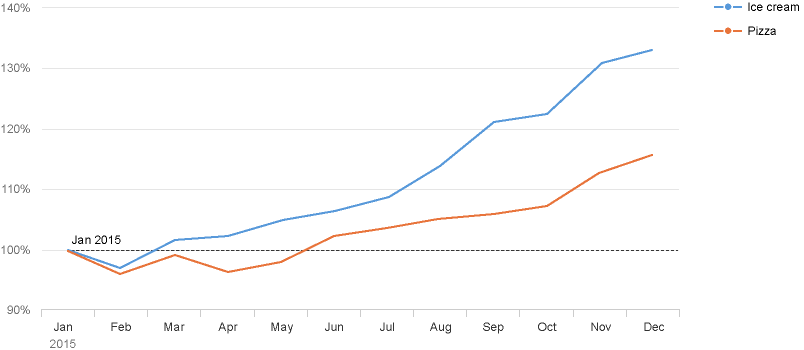
If you want to compare the rate of change of two measures over time, you can use percentages to express the rate of change and start from the initial date of the series. The chart below represents the rate of change of ice cream and the rate of change of pizza displayed in percentage from the original date.

Rate of change, expressed in %

Sum of Values

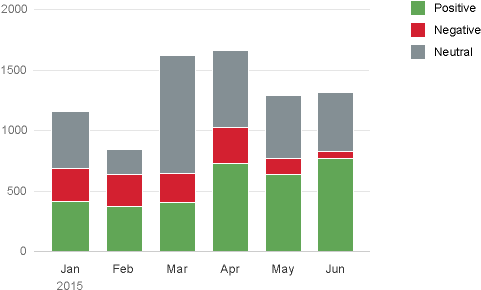
This section shows you how to visualize the variation over time for a sum of values. One solution would be to use a stacked column chart with each measure is stacked on top of each other.

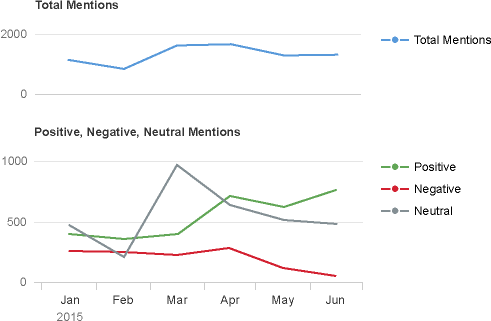
The chart below is used in Sentiment Analysis, which enables product managers to view sentiment information for multiple products by analyzing the number of mentions in social media broken down by how positive, neutral and negative they were. You can see how the sum of the positive, negative and neutral mentions provides a good indication of the “buzz” around each product, independently of how good or bad it was.

However, this approach does not make it easy to compare multiple values within a series. You can see how hard it is to see whether the negative mentions have increased or decreased.

Sum of values over time

You can make it easier to compare multiple values within a series by using two line charts stacked on top of each other as illustrated below. The first line chart represents the total number of mentions and the second chart displays one line per type of mention. Now we can see better that the number of negative mentions has decreased.

Sum of values over time - Trend for each value

Part to Whole 

Check out the part to whole article.

Resources

Want to dive deeper? Follow the links below to find out more about related controls, the SAPUI5 implementation, and the visual design.

Elements and Controls

Implementation

Smart Link

Intro

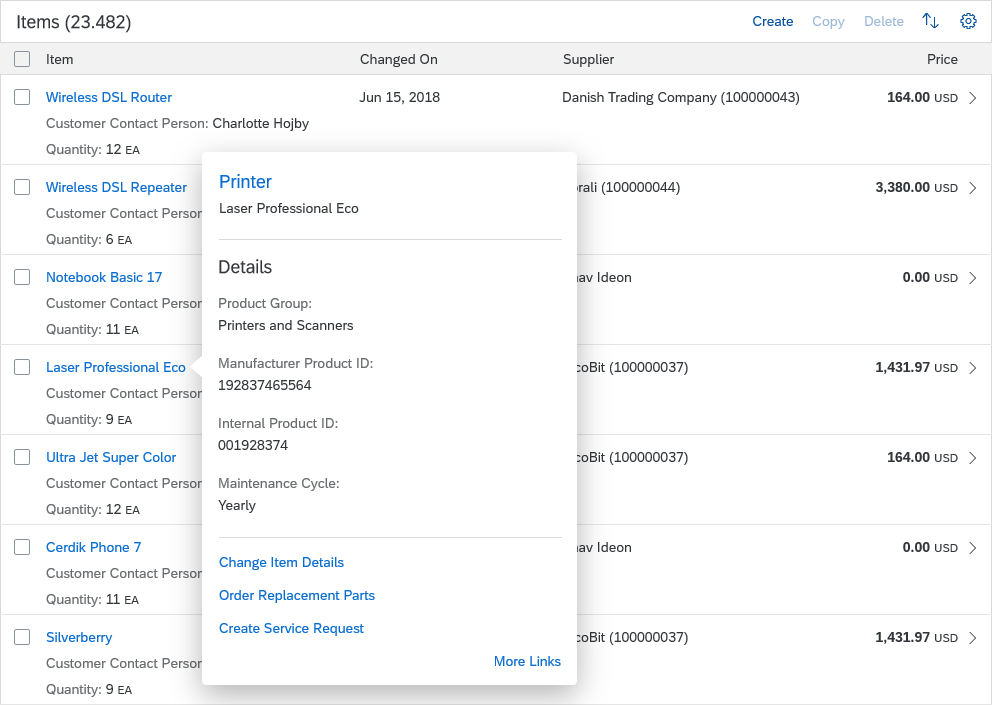
Like the quick view, the smart link triggers a popover from a text link. This popover shows additional information, such as simple object details, and offers links to related apps for the user to take action. The user can choose which links are shown in the popover by selecting them in a separate dialog.
The smart link is a smart control that uses metadata annotations to offer user-specific navigation. It analyzes the user’s assigned apps and offers only relevant navigation targets.

When to Use

Use the smart link if:

You want to offer direct navigation to a related app. For example:

  • Navigate from a product list to the app for changing the pricing
  • Navigate from a sales order list to the app that shows a customer’s balance

You want to show a popover with contextual information or navigation. For example:

  • Offer navigation to multiple related apps
  • Display simple object details

Do not use the smart link if:

  • You want to display more or complex information about an object. Use the object page or charts instead.
  • Access to metadata is not possible, and only a direct link to a website, document or application is needed. Use the standard link instead.
  • You need to structure information in a deeper hierarchy. Use the quick view or a list drilldown instead.

Components

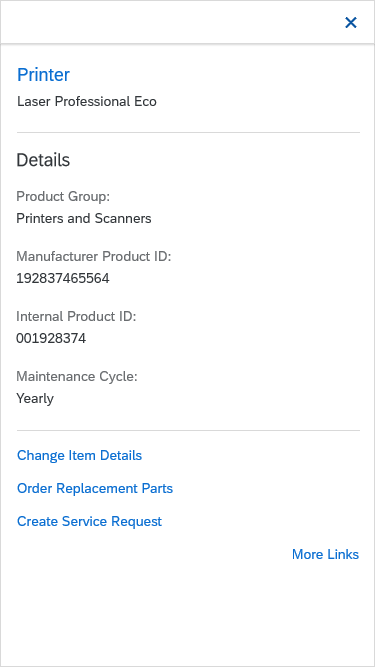
The smart link popover contains the following areas:

  1. The header bar of the smart link popover is only visible on mobile devices (see example image for responsiveness, size S).
  2. The title area contains a title and a subtitle. You can also show the title as a link, which can be used to navigate to the corresponding object or fact sheet. You can use the subtitle to show an object ID, for example.
  3. The content area shows object-related information, such as details about a product or contact information. You can use any UI control, based on what best fits your use case.
  4. The link area offers links to all other apps that are relevant for a user role. The link list includes all semantic objects defined for the app, and can also include additional links defined manually by the application development team. The link area can have two states:

Link area is empty:
If no links have been selected for the app, or if there are more than 10 links, the link area is initially empty. Instead, the user sees a Define Links button, which opens a dialog for selecting the links to be shown.

Links are shown:
As soon as the link area contains links, the button text changes to More Links. This opens the same selection dialog.

Only the header bar is mandatory (for mobile devices). All the other sections are optional. For example, you might choose to show only a content area or a only a link area, depending on your use case.

The areas of the smart link (header bar not shown)

Behavior and Interaction

The smart link and its popover are always triggered by clicking a text element that appears as a link. You can place this text element in any list, table, or other container. You can also set the link label individually. Clicking outside the popover closes it. If only one link is offered, and there is no additional information, the smart link control navigates directly to the target without opening the popover.

If the semantic object annotation is not set, the smart link is rendered as sap.m.Text by default. However, you can also opt to render any other control.

Link Selection Dialog

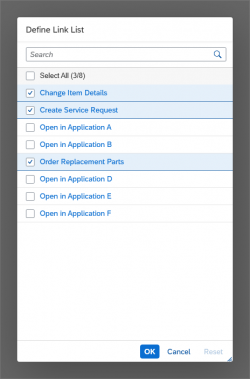
Clicking the More Links or Define Links button opens the Define Link List dialog. There, the user can select the app links to be displayed in the link area. The links offered in the selection list are modifiable semantic objects suggested by the smart link control. The app team can remove links from the selection list, change the link texts, or manually add links to any website or app.

Exception: Within SAP Fiori elements, the links offered in the Define Link List dialog are generated automatically. App teams cannot adapt the list.

You can switch off the More Links / Define Links option by setting the property enableAvailableActionsPersonalization to “false”. By default, it is set to “true”.

Smart Links in a Smart Table

Within a smart table, the link label of the smart link is set automatically using the semantic object annotation. In other words, you can’t change the description. If there are no navigation targets, the smart link is rendered as sap.m.Text.

Define link list dialog with a list of application links

Responsiveness

The responsiveness of the smart link is based on the responsiveness of the popover that overlays the content.

On desktop devices, clicking anywhere outside the popover closes it.

On mobile devices, the smart link opens a full screen dialog with a Close icon ( ) on the top right.

Size S – On smartphones, the smart link overlays the content
Sizes M/L/XL - Smart link shown in a table on a desktop device

Top Tips

  • Check the related apps you offer carefully. Only display those that are relevant for the user.
  • Use meaningful link names in the link area. Do not use the same link name more than once. If necessary, rename the links to suit your context (for example, “Add Product” instead of “Manage Products”).

Related Links

Elements and Controls

Implementation

Design-Led Development Process

SAP is committed to designing role-based applications that address the needs of our end users across all lines of business, tasks, and devices. We believe this is the key to a great user experience (UX). But how do we guarantee a solid and consistent design for our customers and end users? The answer is SAP’s design-led development process.

Design-led development takes advantage of proven design thinking methods to achieve an optimal user experience. The process spans the entire development lifecycle, is simple and easy to follow, and provides a solid basis for scaling design as a whole. It fosters unity between designers and developers, while ensuring that the needs of the end user are addressed at every step along the way. Learn more about design-led development below. 

The Phases

Developing software is much more than just coding. It’s about building the right innovative solutions and putting the user first. That’s why exploring business challenges and innovation opportunities is your starting point. In the discover phase, you seek to understand your end users, their working methods, and their needs in more depth.

Only then do you move on to the design phase and create the initial prototypes for development. In the delivery phase, the app is implemented and tested. After that, it is ready to run at the customer site.

Of course, iterations are part of the approach and strongly recommended.

The design-led development process

It is essential to implement quality checkpoints to ensure that the product comes with the best possible UX. We recommend installing quality checkpoints for each phase. Depending on your setup, you might also consider reviewing related apps together to optimize the overall user experience.

Find out more about each process phase in the detail sections below:

Explore
Discover
Design
Deliver
Run & Scale

Explore

In the explore phase, you identify business challenges and innovation opportunities together with your customers and end users. The prioritized innovations then become part of the product roadmap.

Discover

Perhaps you already have a good idea of what your customers want and need, and what your end user’s tasks and challenges are. But what you really need is a holistic view of the business roles affected by your apps.

To get the relevant insights, you will need to visit your customers onsite, speak to everyone involved, and observe users doing their daily work. You should gain a clear understanding of all the business roles involved, their typical tasks and pain points, and the sequence of activities. By the end of the discover phase, you should know which apps need to be developed.

Take a look at our user research method cards to find the best method for your user research activities.

Design

Equipped with the findings from the discover phase, you’re now ready to start the design phase. Ideally, you can brainstorm in a multidisciplinary team, and come up with an initial prototype that you can validate with your end users.

Applying the SAP Fiori design guidelines during the design process will ensure that you build a consistent SAP Fiori user experience.

By the end of the design phase you will have a design that is ready to be implemented.

Deliver

Development can start once you’ve finished your initial design. During the deliver phase, you may still need to change some aspects of your design to incorporate ongoing user feedback, to optimize the app, or to allow for technical constraints.

Before you deploy your app, verify that the final implementation and design deliver the intended user experience to the targeted end users. For usability and consistency, also check that the final design and the implementation reflect the SAP Fiori design guidelines.

By the end of the deliver phase, you will be ready to run at the customer site.

Run & Scale

Now the app can be adopted: The system administrator makes the app available to the end users. During the run & deliver phase, you should find out how end users work with the app: Does the app make their work easier? Do they like using it? Do they find all the information they need? Are there any functions missing?

What you learn from the real-life user experience feeds back into the design-led development process and informs the next iteration of the solution.

It’s a Team Effort

Many different people contribute to the development process. Typically, these include:

  • The product owner, an area expert who is usually responsible for the whole family of apps in that area.
  • The user researcher, who drives the end user research and artifact consolidation.
  • The user experience designer, who creates mockups, prototypes, and design specifications.
  • The software developer, who implements the design.
  • The user assistance developer, who works on UI texts, terminology, and user assistance topics.
  • The quality expert, who sets up test activities and consolidates the results.

These are just the main roles. Depending on how you drive the process, you may need to extend this list.