Map Container

The map container is a predefined feature set for maps. It fits most use cases and makes it easier for app developers to work with maps.

If you wish to display a geomap or an analytic map without using the map container features, the app developer can also opt to use the analytic map or geomap control.

Responsiveness

The width and height of the map container are defined by the surrounding application layout.

The map container uses the overflow toolbar control. This control is based on the sap.m.Toolbar and provides overflow when the contents do not fit in the visible area.

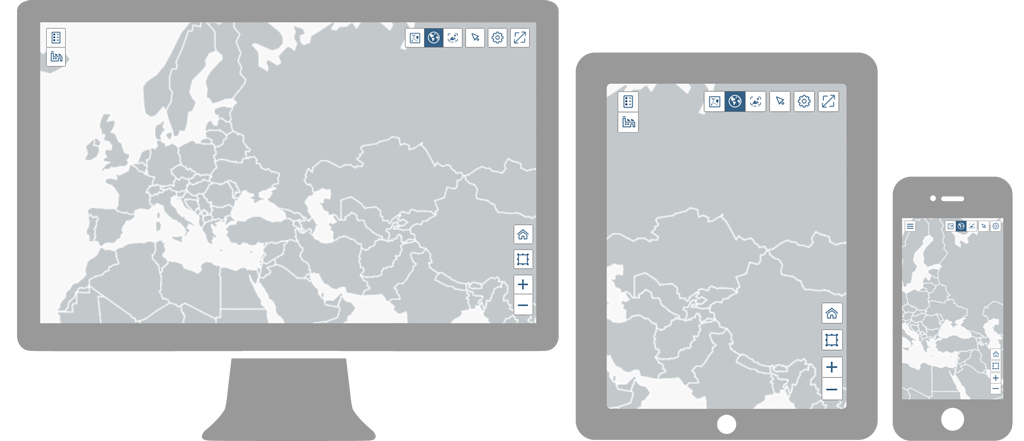
Note: Map container on smartphone displayed menu button instead of list panel icon because of the small screen size.

Components

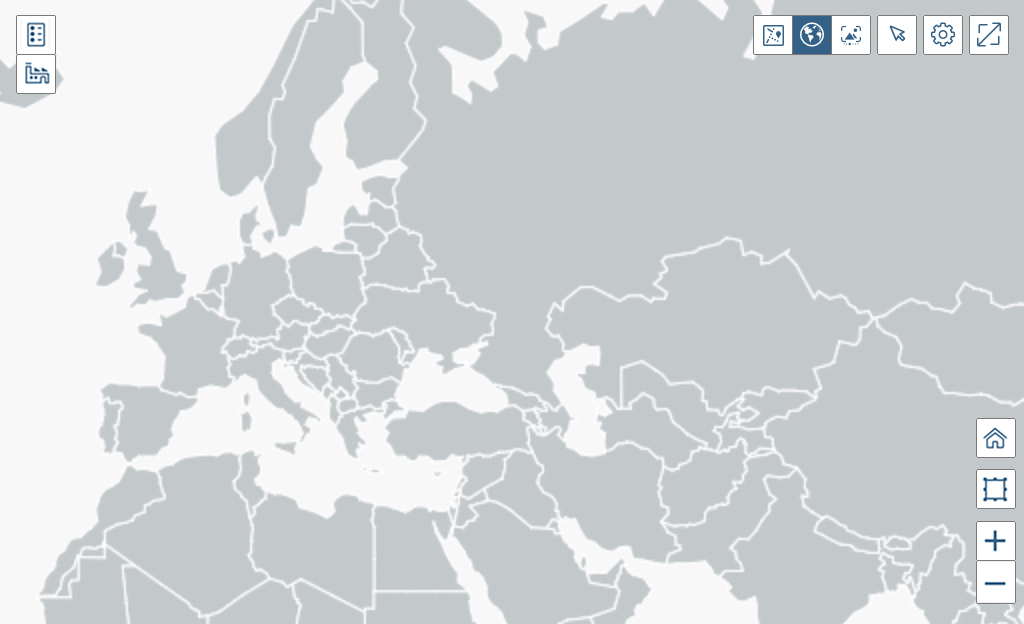
Overview of map container components

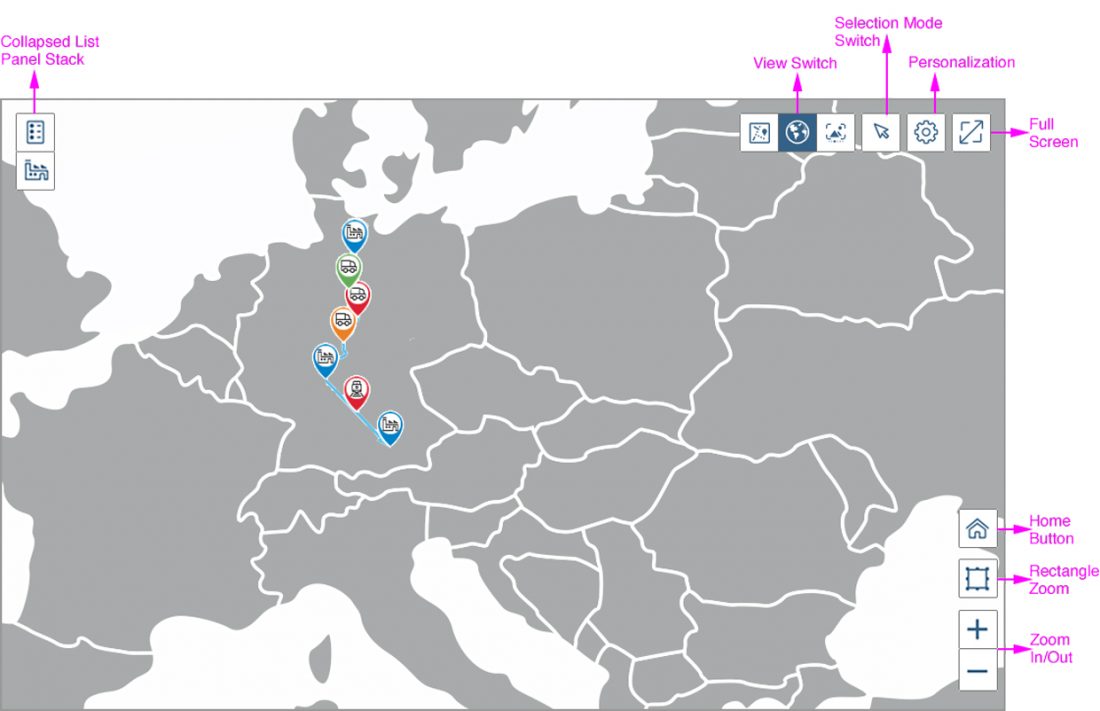
The map container includes the following components:

  • A map (geomap or analytic map)
  • Transparent toolbar containing the following buttons:
    • View switch (optional), such as between geomaps and analytic maps
    • Selection menu (optional)
    • Personalization/settings (optional)
    • Full-screen mode
    • Overflow toolbar (generic)
  • A list panel stack, which can be used for a legend or other application-specific content
  • Navigation tools such as:
    • Measure
    • Scale
    • Zoom in/zoom out, including rectangular zoom
    • Home button

View Switch (Optional)

View switches are optional control. This control allows the user to switch between different map types, charts, and table layouts. You should consider using a view switch for accessibility reasons. For example, users with visual impairments might have a hard time working with subtle color differences or specific color gradients, and might prefer switching to a table view instead.

We recommend using no more than three types of alternate visualization. The segmented button control is used to display the types of visualization available in the view switch, and highlights the type of visualization that is being currently displayed.

The button control gives the user the option to switch between the geomap, analytic map and image view.

Menu for Selection Modes (Optional)

The menu for selection modes enables the user to switch between the available selection modes: single, rectangular, and lasso. These buttons are optional.

Selection menu
Selection menu

Personalization (Optional)

A personalization button is provided and can be enabled/disabled by the app developer. The corresponding popover and details need to be implemented by the app developer.

The personalization/settings button can be used to show or hide a legend and labels, for example.

Personalization/settings button

Full-Screen Mode

The map container can be viewed on full-screen mode (property: fullScreen). For desktop and tablet, the Full Screen button is always placed at the top right of the transparent toolbar.

The user can toggle between embedded and full-screen mode via the Maximize Full Screen toggle button. In full-screen mode, the map container occupies the entire width and height. The toolbar replaces the page header bar, and the Minimize icon appears.

For smartphones, the Full Screen button is disabled as the map container is used in full-screen mode by default.

Initiate full-screen button
Minimize full-screen button

Overflow (Generic)

The overflow is activated if there is not enough space on the screen for all the chart bar actions. It is generated automatically.

When the user clicks the overflow button, a popover appears. In this action sheet, all icon buttons are labelled with text.

All buttons go into the overflow from right to left.

Overflow button
Overflow button

Prioritization

You can also prioritize the actions in the toolbar by applying one of five different statuses to them:

  • Always overflow: The action will always move into the overflow.
  • Disappear: This applies to actions that are not very relevant for the user, and which can disappear if space is limited.
  • Low: This applies to actions that the user seldom needs; these actions then move first into the overflow.
  • High: These actions remain visible until all actions that are tagged ‘disappear’, ‘low’, or that are untagged, have moved into the overflow.
  • Never overflow: These actions will always visible in the toolbar.

All items have equal priority by default. If two items have the same priority, the one on the right overflows first.

Grouping

Items can overflow together, even if they are in different positions. Elements that belong to a group should not have ‘always overflow’ or ‘never overflow’ statuses as these priorities force the items to remain either in the toolbar or in the overflow area. When group elements have different statuses, the priority of the group is defined by the highest priority of its elements.

List Panel Stack (Optional)

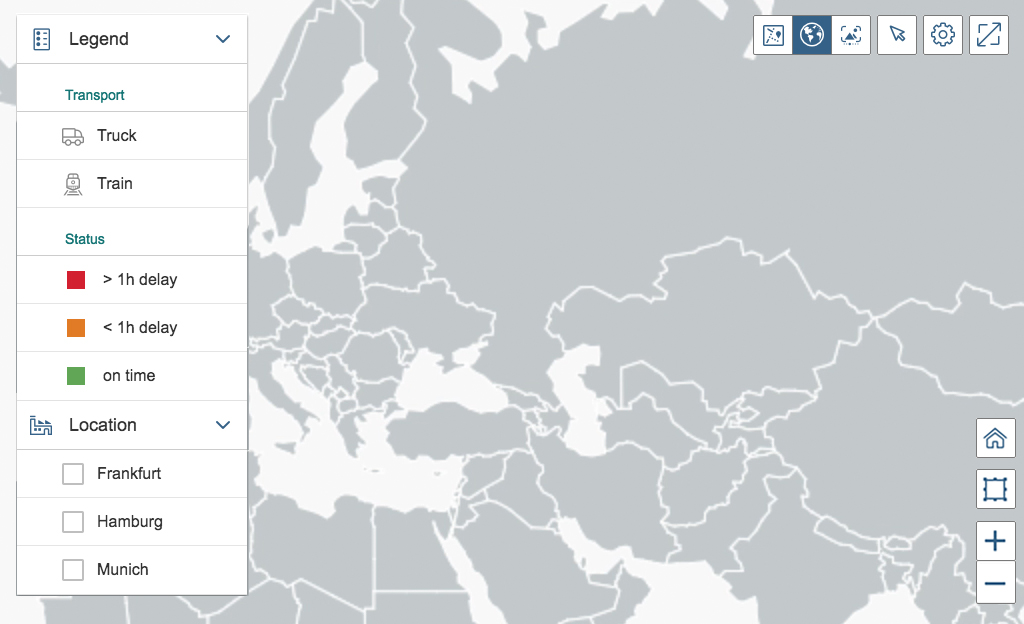
The list panel stack is aligned to the left in the toolbar. It can be used for a legend and other application-specific content. The list panel stack can be collapsed in a way that only the icons of the different list panels will be seen. We recommend using icons that are easy to understand for each panel, as these icons will be the only visible element when the panels are collapsed. The collapsed list panels serve as quick access to the clicked panel icon.

If you are not using icons for the panels, do not allow the panels to collapse.

The default width of the list panel stack is auto. We recommend defining a precise width to avoid having the width permanently change according to the content. The list panel stack will remain visible on the map, whereas the toolbar buttons will be hidden.

As a general rule, avoid using too many panels as too much scrolling will increase the complexity of the application.

The list panel provides the same features as the standard list item:

  • Grouping
  • Select items
  • Include Icons/color markers or pictures
  • Show counter
Collapsed list panel stack (desktop)
Expanded list panel stack (desktop)

Legend

We recommend to include the map legend in the list panel. All necessary features for a legend are provided through the list panel stack (see above).

If your specific use case does not allow you to include the legend in the list panel, you can also use the map legend.

Navigation Tools

Home Button

The map container provides a Home button. Clicking on the Home button leads to the initial zoom position.

Home button
Home button

Rectangular Zoom

The Rectangular Zoom button can be used to zoom to a specific position. The rectangular zoom is enabled for the compact form factor by default, and disabled for the cozy form factor. For more information on cozy and compact form factors, see content density.

Rectangular Zoom button

Zoom In/ Zoom Out

The map container provides Zoom In ( ) and Zoom Out ( ) icon buttons, which are positioned on the bottom right corner of the map. When the user clicks these buttons, the chart automatically zooms in or out to the most appropriate scale.

By default, these buttons are enabled.

Zoom In/Zoom Out button

Behavior and Interaction

The buttons have a set priority for the overflow by default. The application developer can change this priority. High-prioritized buttons will overflow last.

On desktop and tablet devices, the list panel stack is always visible, whereas the transparent toolbar overflows. The navigation control is hidden behind the panel list stack.

On a smartphone devices, the list panel stack is minimized to a menu button on the top left. The menu icon always remains on the screen, whereas the transparent toolbar buttons overflow. Clicking on the menu button, the list panel stack opens in full-screen mode.

We generally recommend using either icon buttons or text buttons within the transparent toolbar, but not both. Icons and text should not be combined into one button. Buttons with icon and text only appear in the overflow menu. Buttons are always aligned to the right.

Guidelines

  • Think carefully about what actions you really need in the transparent map toolbar – do not overload the map toolbar with actions.
  • Think carefully about what content you really need in the panel list stack – do not overload the panel with content.
  • Think carefully about which features make sense on the map if the map is not used in full screen. For example, it wouldn’t make sense for a map to have a list panel stack if it is being featured on a card of an overview page.
  • Use tooltips for switchable content. For example, label icon buttons as “geomap” or “analytic map” in the toolbar.

Resources

Want to dive deeper? Follow the links below to find out more about related controls, the SAPUI5 implementation, and the visual design.

Elements and Controls

Implementation

Implementation

No links.

Object Handling – Mass Edit

Information
For mass edit in SAP S/4HANA, use the Smart Multi Edit Container (SAPUI5 samples). See the design decision.

Intro

Mass editing allows users to simultaneously change multiple objects that share the same editable properties.

Usage

Use mass editing if:

  • Users need to change one or more values for multiple objects.
  • The objects share the same editable properties, such as Product Category and Status.

Do not use mass editing if:

  • The objects do not share any of the same editable properties.

Components

Mass editing is done in a dialog containing combo boxes and select controls.

The select control restricts the user to a predefined set of values. Additionally, the combo box allows the user to enter a custom value.

Behavior and Interaction

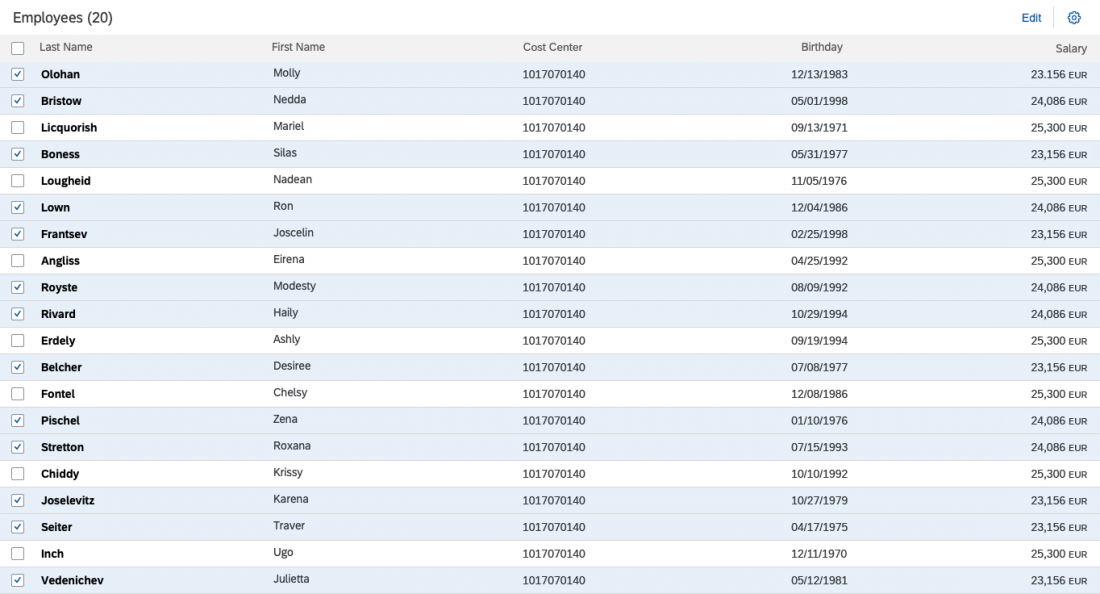
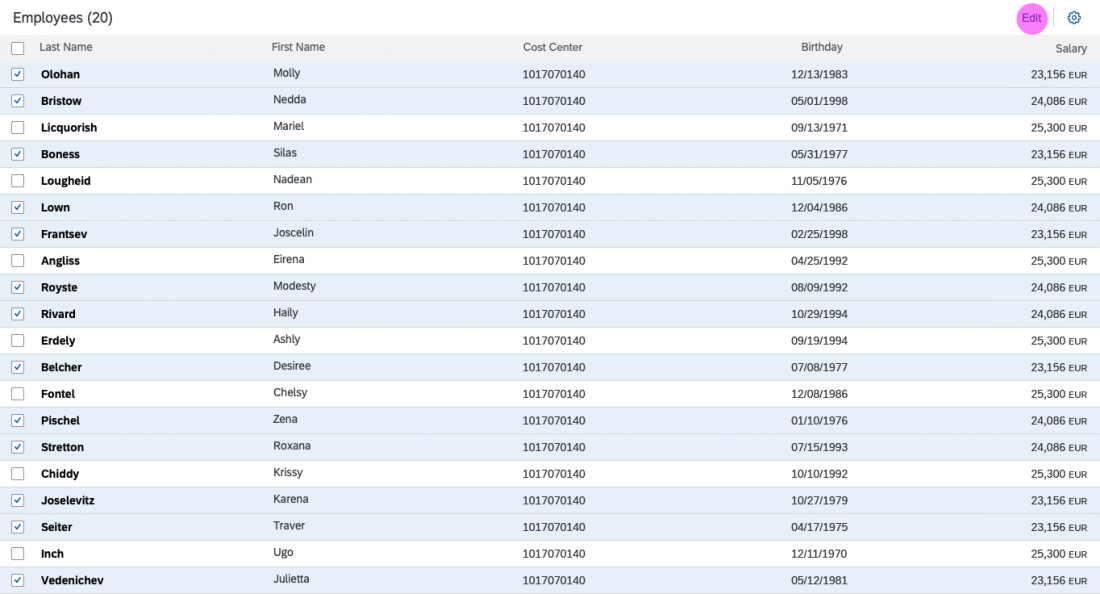
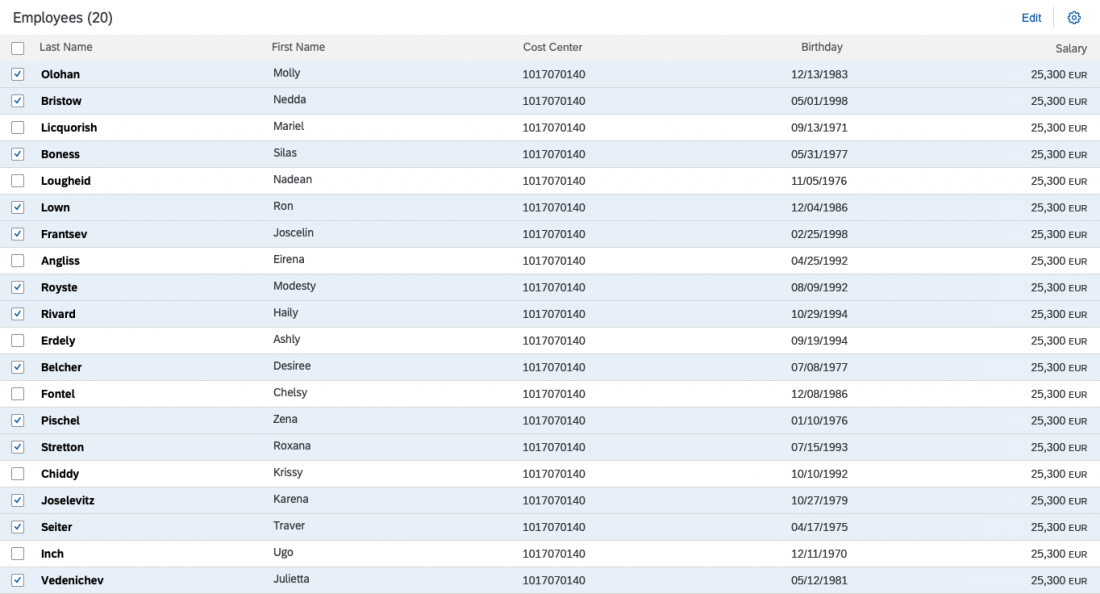
Users will typically select multiple objects from a list or table and press the Edit button. This triggers a modal view dialog containing a select control or combo box for each visible column in the table.

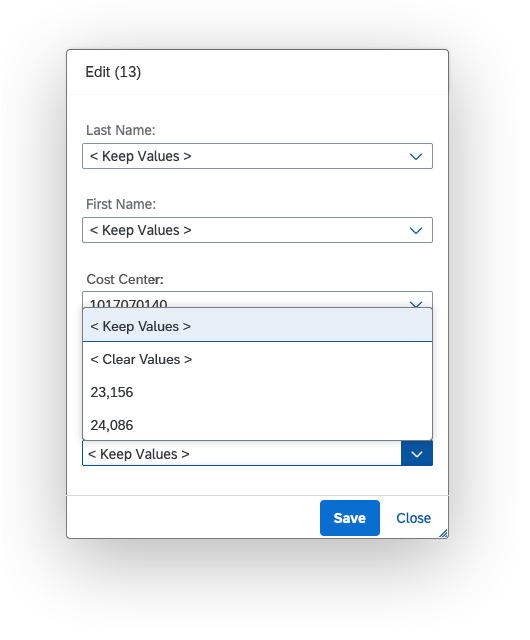
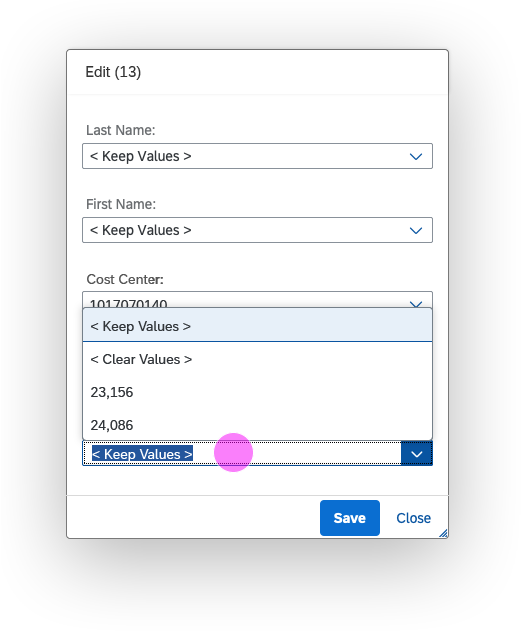
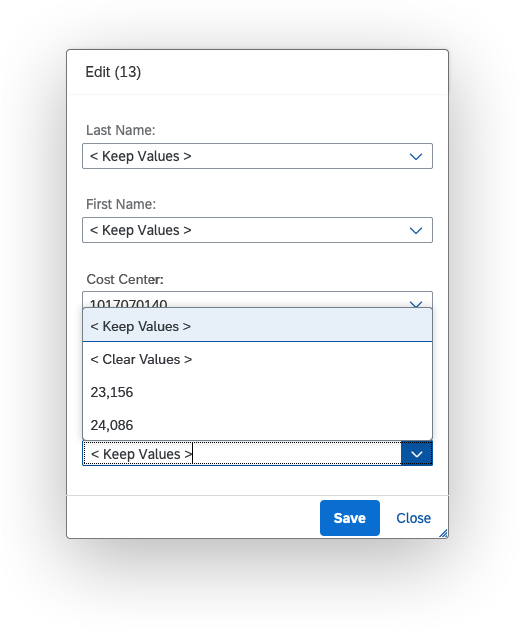
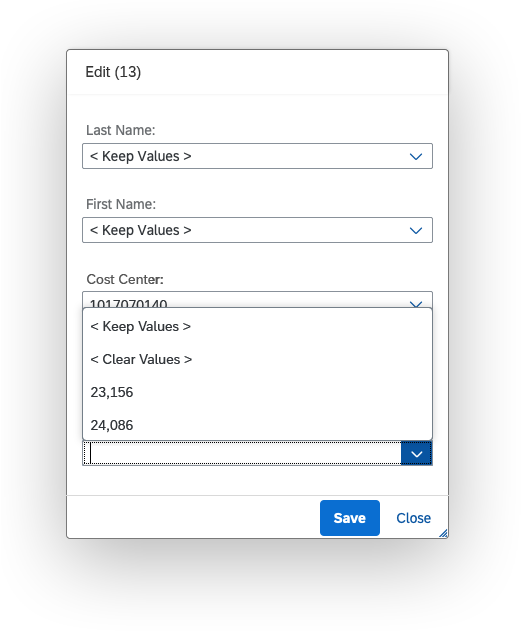
All the existing values are listed alphabetically in the dropdown menu without duplicates. Selecting a value or entering a new one overwrites all the existing values.

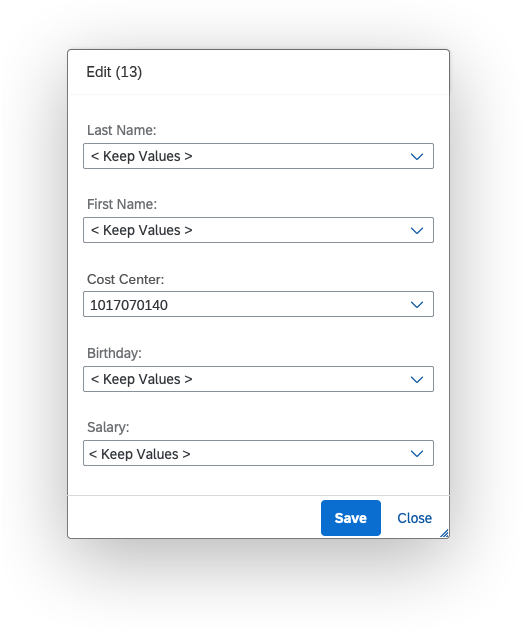
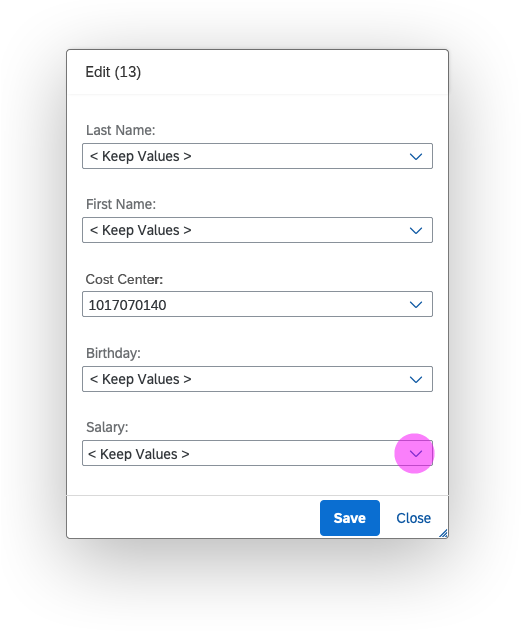
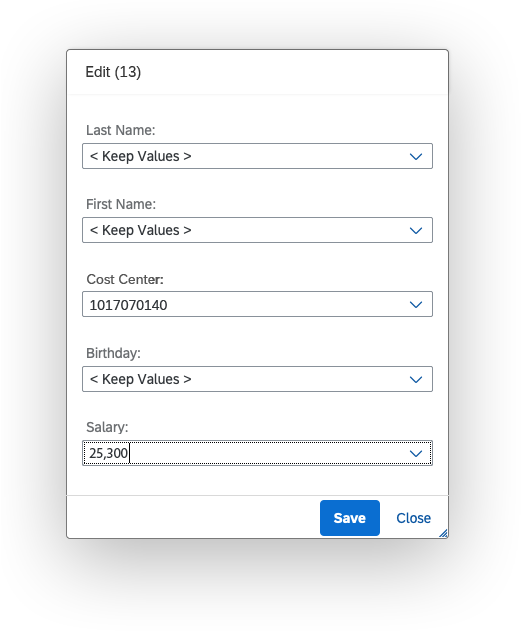
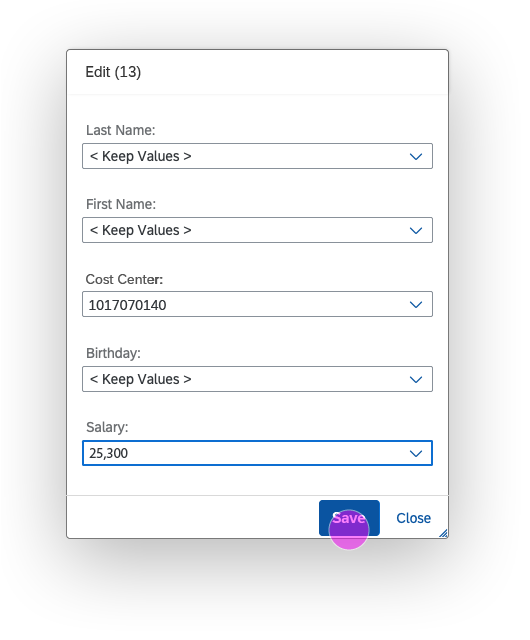
In the example below, the user’s task is to make everyone’s salary the same.

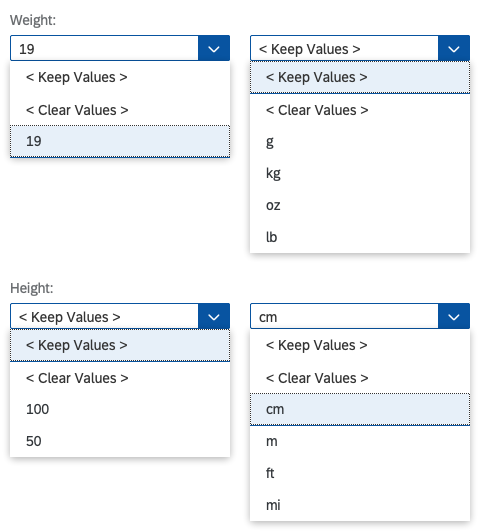
The preselected option in the select control or combo field depends on the existing values in the table column:

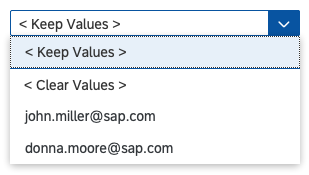
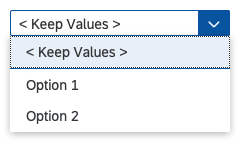
  • If the values are different, < Keep Values >.
  • If the values are all identical, that specific value is preselected.
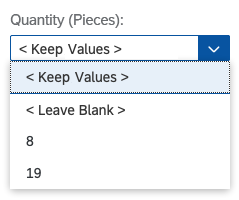
  • If a column contains no existing values, the option < Leave Blank > is preselected.

If it’s technically possible, the option < Clear Values > is available in the dropdown list to remove all the values in a column.

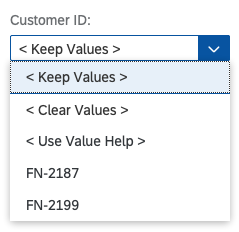
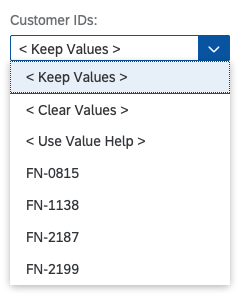
If a dialog can be used to enter a new value, the option < Use Value Help > or < Use Select Dialog > will be displayed in the dropdown list.

Information
We are currently working on a detailed end-to-end flow for mass editing, which will include message handling for any items that can’t be processed. The guidelines will be updated in due course.

Guidelines

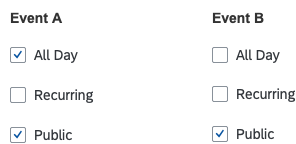
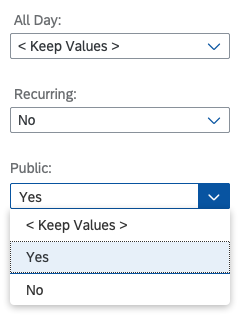
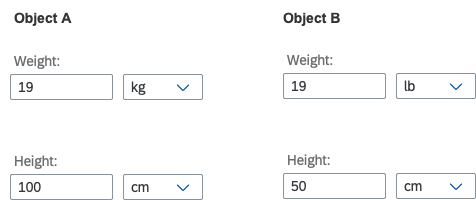
The examples below illustrate how to “translate” controls into their mass editing equivalent.

Checkbox

Checkboxes
Checkboxes
Checkboxes – Editing

Control

Select

Preset Entries

Mixed choices: < Keep Values >

All checked: Yes

All unchecked: No

Composite Fields

Composite fields
Composite fields
Composite fields – Editing

Control

Combo box/Select (depending on use case)

Preset Entries

See respective control in the list above.

Date Picker

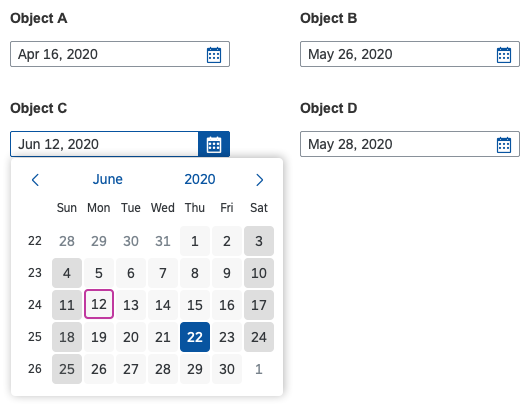
Date picker
Date picker
Date picker – Editing (1)
Date picker – Editing (2)

Control

  1. A) Select (if users are only allowed to pick a date from a predefined list)
    List all allowed dates beneath the standard actions.
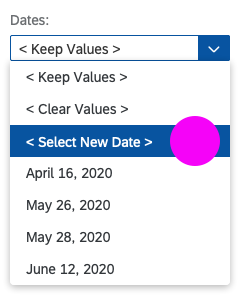
  1. B) Combo box (if users are allowed to pick any date)
    Right above the list of dates from the object, offer another selection
    < Select New Date >.
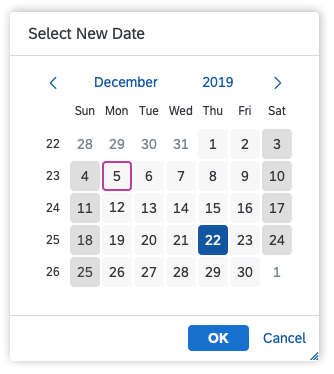
  2. Dialog with calendar control inside
    Selecting a date and clicking OK closes the dialog and populates the combo box with that date.

Preset Entries

Mixed choices: < Keep Values >

Identical choices: Use this choice as preset.

No values: < Leave Blank >

Input (any characters allowed)

Input (all characters)
Input (all characters) – Editing

Control

Combo box

Preset Entries

Mixed choices: < Keep Values >

Identical choices: Use this choice as preset.

No values: < Leave Blank >

Input (restricted to specific characters, such as numbers)

Input (restricted characters)
Input (restricted characters) – Editing

Control

Combo box

Preset Entries

Mixed choices: < Keep Values >

Identical choices: Use this choice as preset.

No values: < Leave Blank >

Developer Hint
In this case, use a combo box even though only certain characters are allowed. This is necessary to make the topmost entries < Keep Existing Values > and < Leave Blank > work and allow the user to select them via text input.

 Be sure to validate the entry when the field loses focus or the user presses the ENTER key.

Input (with value help or select dialog)

Input (value help)
Input (value help)
Input (value help) – Editing

Control

Combo box (Add < Use Value Help > or < Use Select Dialog > entry to trigger the respective dialog.)

Preset Entries

Mixed choices: < Keep Values >

Identical choices: Use this choice as preset.

No values: < Leave Blank >

Input (multi input)
Input (multi input)
Input (multi input) – Editing

Radio Buttons

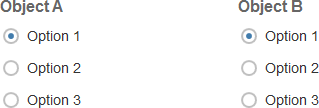
Radio buttons
Radio buttons
Radio buttons – Editing

Control

Select

Preset Entries

Mixed choices: < Keep Values >

Identical choices: Use this choice as preset.

No values: < Leave Blank >

Rating Indicator

Rating indicator
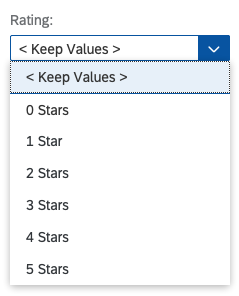
Rating indicator
Rating indicator – Editing

Control

Select

Preset Entries

Mixed choices: < Keep Values >

Identical choices: Use this choice as preset.

No values: < Leave Blank >

Segmented Button

Segmented buttons
Segmented buttons
Segmented buttons – Editing

Control

Select

Preset Entries

Mixed choices: < Keep Values >

Identical choices: Use this choice as preset.

Slider

Slider
Slider
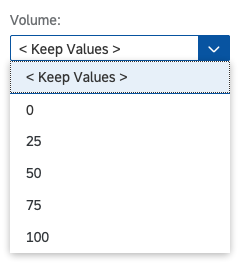
Slider – Editing
Slider – Editing

Control

Combo box / Select

Preset Entries

Mixed choices: < Keep Values >

Identical choices: Use this choice as preset.

Information
Sliders potentially offer hundreds of values. These should not all be represented in the dropdown. Use a combo box and try to offer some appropriate presets as shown above and allow the user to enter other values (the user’s input needs to be validated).
If your slider only has up to 10 steps, you can also use a select control and offer all possible values in the dropdown.

Switch

Switch
Switch
Switch – Editing
Switch – Editing

Control

Select

Preset Entries

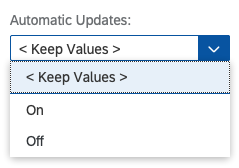
Mixed choices: < Keep Values >

Identical choices: Use this choice as preset.

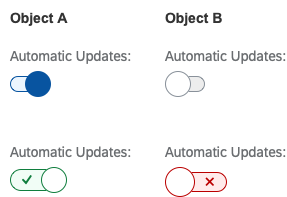
If you use the semantic switch, make sure you provide suitably worded options for mass editing, like On/Off or Yes/No.

Toggle Buttons

Toggle buttons
Toggle buttons
Toggle buttons – Editing

Control

Select

Preset Entries

Mixed choices: < Keep Values >

Identical choices: Use this choice as preset.

No values: < Leave Blank >

Warning
Currently, mass editing is not supported for time selection, since the respective control has not yet been adapted.

General Guidelines

  • Provide mass editing in a dialog after the user selects multiple items from a list or table and presses the Edit button.
  • Ensure that the option < Keep Values > is listed before the existing values in the dropdown menu.
  • Ensure that the option < Leave Blank > is preselected if a column doesn’t contain any values.
  • If it’s technically possible, you can provide the< Clear Values >  option in the dropdown list to clear all the values in a column. However, do not make this option available if entering a value is mandatory.
  • Include the option < Use Value Help > or < Use Select Dialog > if a dialog or value help can be used to pick a new value – just ensure that the previously selected value (or choice) is restored to the input field if the user presses Cancel in the value help dialog.
  • If your application also allows the creation of objects, try to structure the create and mass edit screens similarly. This reduces the cognitive load for the end users. The same rule applies if your users have an additional SAP Fiori application for creating the object.
  • If certain fields belong together semantically (such as First Name/Last Name or City/ZIP Code), arrange them in such a way that the user can recognize the connection.

Special Characters (“<” and “>”)

Always use the entries < Keep Values > and < Leave Blank > as described in this guideline: They must start with “<” followed by a blank space, and end with a blank space followed by “>”.

These two characters have been chosen because they are not usually used in text form in objects.

In the unlikely event that these characters are already used by a customer, replace them with another set of unlikely special characters that are not used by this customer. However, you must still ensure that < Keep Values > and < Leave Blank > stay at the top as the first two entries.

Related Links

Elements and Controls

Implementation

Chart – Comparison

This page will help you choose the correct chart when you want to compare items that do not need to be displayed in a particular order.  This type of comparison is also called nominal comparison, category comparison, or structure analysis. These chart types can be used to compare items such as revenues in a list of products, or transaction volumes in a list of banks.

If the items you want to compare have an intrinsic order such as dates, age, or time periods, please see the Chart – Variation through Time page.

One Set of Values

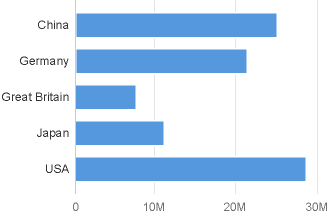
If you want to compare items based on one type of value, we recommend using a bar chart as shown in the example below.

Bar chart used for comparison

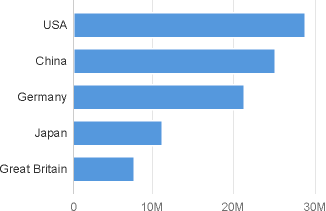
You can make it easy to compare items by ranking them in order of the largest value to the smallest value as illustrated below, or vice versa if you wish. Learn more about ranking on the Chart – Ranking page.

Countries ranked by value

Why we recommend using a bar chart instead of a column chart

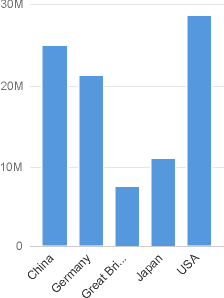
It’s worth noting that you can use a column chart or a bar chart, but if you use a bar chart you will avoid the undesirable effects that come as a result of displaying the category labels at 45°, making them hard to read and frequently leading to truncation of text.

Column chart with truncated labels at 45°

Hierarchical Categories

You can compare items within groups of the hierarchy.

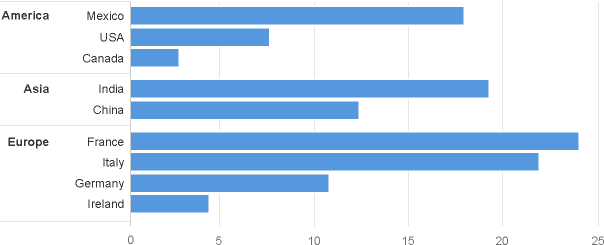
In the example below, the countries are ranked inside their respective continents which makes it easy to compare each continent and each country within each continent.

Items grouped in hierarchical categories, with items ranked within each category

Multiple Sets of Values

Compare Values Individually

We recommend using a bar chart to compare values within item categories. If one of the values acts as a point of reference, please refer to the section below on comparison with a point of reference.

The chart below compares the revenues of USA and Germany for nine product lines.

Two sets of values compared in a bar chart

As previously stated, you can make it easy to compare items by ranking them in order of the largest value to the smallest value as illustrated below, or vice versa if you wish.

In the example below, the ranking allows us to clearly see that the top three products in USA are also the top three products in Germany.

Two sets of values in a bar chart, ranked by value

Comparing with a Reference Point

Sometimes you might want to see how close a value is to reaching or exceeding a reference point. Typical examples of reference points are target, plan and budget. A benchmark or a value from the previous year can also be considered as reference points.

The chart below compares actual and planned costs for four lines of business.

Actual and planned costs displayed in a bullet chart

Comparing Two Entire Sets of Values

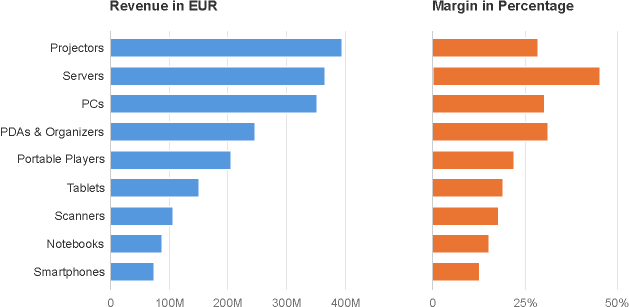
If you need to compare two entire sets of values, we recommend using two bar charts side by side. You can order the items in one of the datasets in order to better highlight the differences between the two datasets.

In the example below, we can easily see that the margin for ‘Servers’ is much higher than other product lines that have a similar revenue.

Comparison between two sets of values in bar chart

If there are many items within categories, you could also use a scatter plot or a bubble chart which are designed to illustrate correlation between datasets.

Comparing Values that have Different Units

 If the values being compared have different units, you can either convert the values to a common unit such as the percentage, or you can use multiple charts side by side.

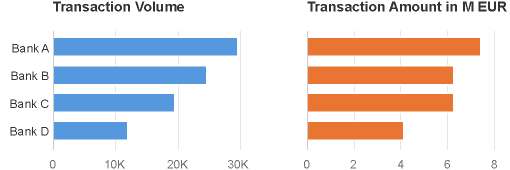
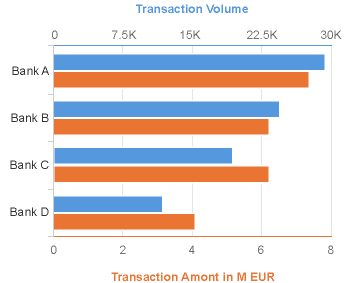
The example below displays two sets of values, the transaction volume and the transaction amount for four banks. With this type of visualization, it’s easy to spot that Bank C is the odd one out when comparing the bars.

Good example of comparison between two sets of values with different units

What Not to do: Take a look at the chart below. It contains the same information as the two charts above, but with a dual axis. It looks like the Transaction Amounts for Bank C and Bank D are bigger than their Transaction Volumes, but this is meaningless because the axes use completely different scales.

Bad example of comparison between two sets of values with different units

Comparing Sum of Values (Stacked Bars)

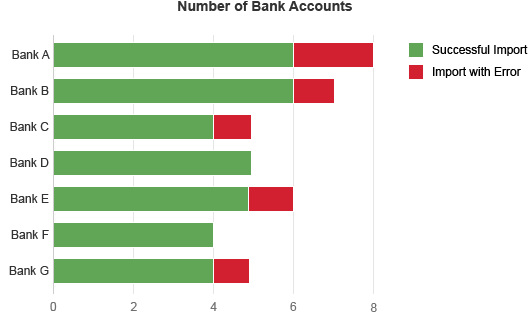
The following section illustrates how to visualize the sum of values inside and across different category items using a stacked chart. In the example below the number of ‘imported successfully’ bank accounts are stacked on top of number of ‘imported with errors’ bank accounts. However, please notice that this approach does not make it easy to compare the number of ‘Imported with Errors’.

Comparison chart showing sum of values in a stacked bar

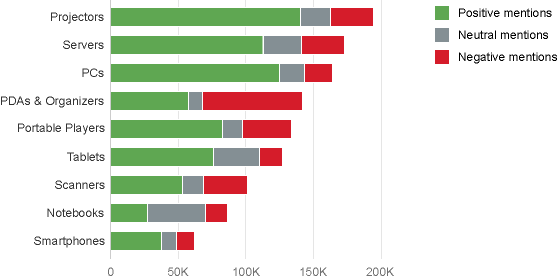
The chart below is used in the Analyze Sentiments app which enables product managers to view sentiment information for multiple products by analyzing the number of mentions in social media broken down by how positive, neutral and negative they were. You can see how the sum of the positive, negative and neutral mentions provides a good indication of the “buzz” around each product, independently of how good or bad it was.

Chart comparing sum of values in a stacked bar

If you want to see which products received the most mentions overall, as well as the most positive, negative, and neutral mentions, then an ideal solution would be to split this information into four separate charts. However, you need to make sure that the four charts use the same horizontal scale.

In the example below, you can easily see that the product line ‘PDAs & Organizers’ received a lot of mentions, although a large percentage of them were actually negative.

Sum of multiple sets of values - bar chart side by side

An alternative solution would be to use a table with bars inside each column.

Two Categories

You can use bar charts placed side by side if you want to compare values across two categories, such as revenue by products and by region. You do not need to repeat the list of category items on the vertical axis. However, you must make sure that all the charts use the same horizontal scale!

Please be aware that this layout only works well:

  • for a limited number of charts (between 2 and 5),
  • when vertical scrolling is not required,
  • on large screens.

The chart below shows the revenue of each product line for three different regions. You can easily see that the revenue for ‘computer system accessories’ is exceptional high in Asia and you can easily compare values within each business area, although you cannot easily compare values between different business areas.

This chart compares values among two categories and uses few category items

Two Categories Containing Many Items

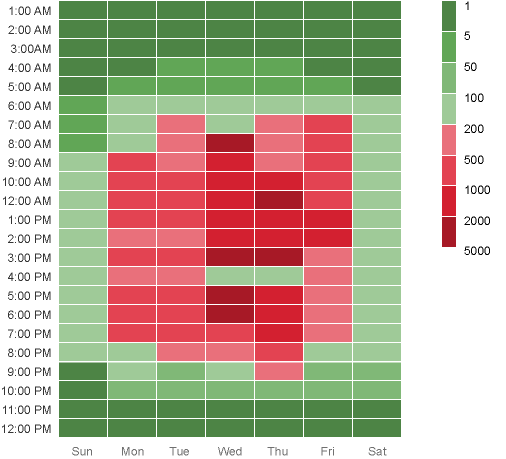
You can use a heatmap if the categories you’re comparing contain many items, and you’re just interested in showing approximate values. The heatmap is a two-dimensional representation of data where values are represented just by color. The heatmap below visualises gross sales of products items by month.

Heatmap with sequential colors ranked by value

In the example below, a heatmap is used by an IT department to visualize response times in ms throughout the weekdays and working hours using semantic colors to differentiate between response times.

Heatmap with sequential colors ranked by value

If you have a lot of categories, be aware that the heatmap might not render correctly on small devices. This is because all content on the screen will be resized proportionally and the category labels may by hidden due to lack of space.

Three Categories

If you want to compare three categories such as product, region and quarter, we recommend displaying multiple charts in a matrix. All you need to do is make sure the charts all use the same scale.

Be aware that this layout only works well:

  • with a limited number of charts,
  • on large screens

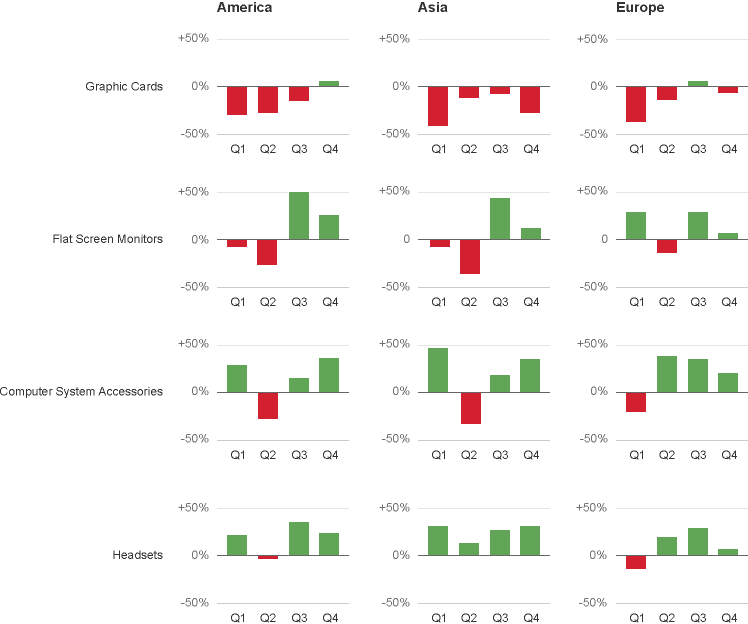
The chart below shows the percentage deviation of actual revenue versus target revenue, by region and product line, for the last four quarters. It’s immediately obvious that the first quarters have frequently fallen below target, and that ‘graphic cards’ did not perform well in all the regions.

Matrix comparing 3 categories

Resources

Want to dive deeper? Follow the links below to find out more about related controls, the SAPUI5 implementation, and the visual design.
Elements and Controls

Implementation

Chart – Semantic Patterns

This article explains how to use patterns like dashes, dots or hatches in order to distinguish:

  • Actual Values: What values are (solid pattern).
  • Projected Values: What values might be (dashed line, hatched areas).
  • Reference Values: What values should be (dotted line with empty circles, empty areas).

Actual Values

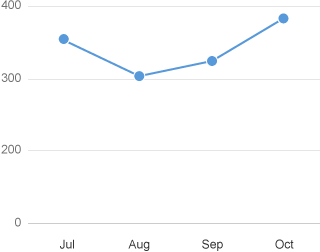
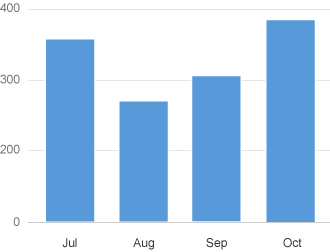
Actual values register facts that happened in the past and utilize the solid pattern for areas and lines, as illustrated below.

Line chart with actual values
Column chart with actual values

Projected Values

Projected values are estimates of what might happen in the future such as a forecast, estimation or prediction. They indicate what the actual values will be in the future, and the projection can be calculated by the system, extrapolated from previous time periods, or entered manually by a user.

Example:

  • Revenue forecast calculated from previous months.
  • Adjusted revenue forecast that has been manually adjusted based on the current context.
  • Cost for projects that are committed, but not yet delivered.

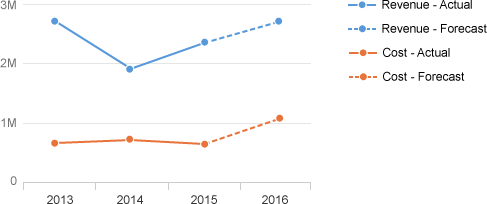
Dashed Line

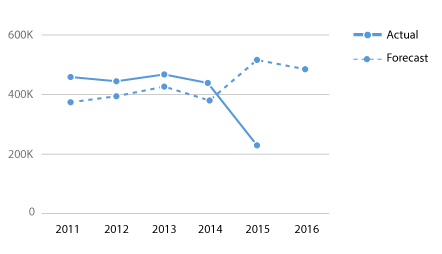
Use dashed lines to show projected values as illustrated below.

Line chart with actual and forecast values

A line can change from solid to dashed when the line needs to display actual values followed by projected values. In the example below, the line connecting the last actual value (2015) to the first projected value (2016) is dashed to indicate that the line is a projection.

Line chart with actual values followed by forecast values

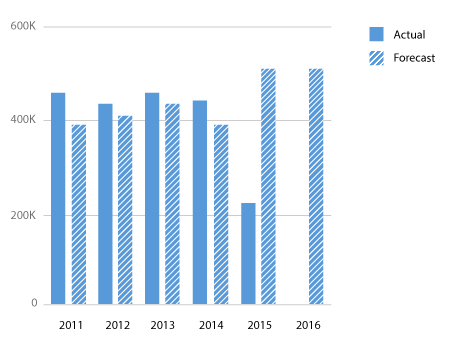
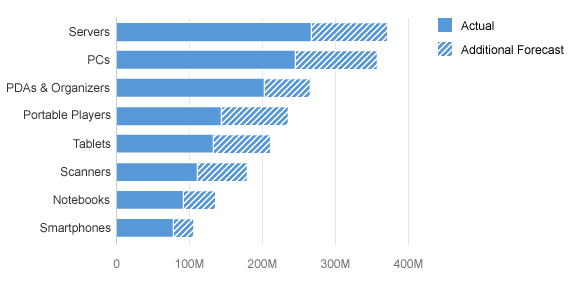
Hatched Area

Use the hatched pattern in columns and bars to display projected values, as illustrated below.

Column chart with actual and forecast values
Stacked bar chart with actual and forecast values

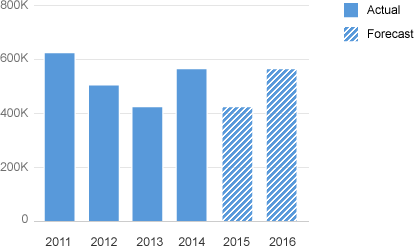
A series of columns with the solid pattern can be followed by a series of columns with the hatched pattern when a series displays actual values followed by projected values, as illustrated below.

Column chart with actual values followed by forecast values
Bullet chart with actual values followed by forecast values

Reference Values

Some values represent a reference for other values (such as a threshold that should be reached or should not be reached) depending on the use case. Here are some examples:

  • A target revenue that must be reached.
  • An expense budget that should not be exceeded.
  • The share price of a competitor to use as a benchmark.
  • The number of new customers acquired last year that needs to be exceeded this year.

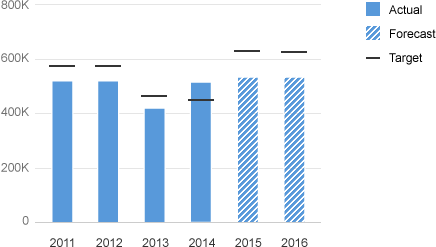
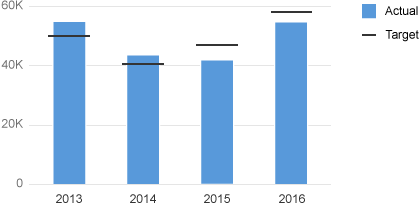
The bullet chart is the ideal chart to compare values with reference values. The reference value is displayed by the black horizontal lines as illustrated in the chart below.

Bullet chart with actual and target values

Dotted Line and Empty Circle

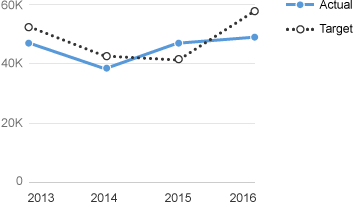
Reference values displayed as a line should use a dotted line and empty circles for the data points as illustrated below.

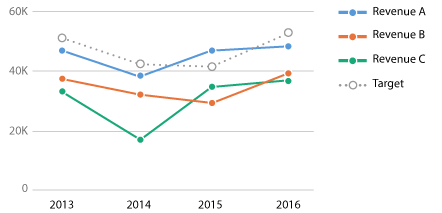
Line chart with actual and target values

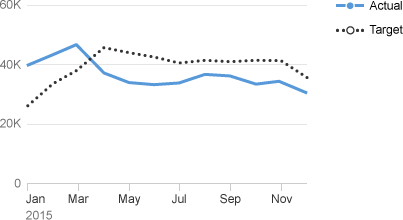
When there are many data points, the circles are automatically hidden, as illustrated below.

Line chart with plenty of actual and target values

When the chart contains one actual value and one reference value (such as a target), you should use color sapUiChartPaletteSequentialNeutralDark2 for the reference line and the first color from the qualitative palette for the actual value, as illustrated below.

Colors used in a line chart with actual and target values

When the chart combines a single reference value (such as a target) with multiple actual values, you should use color sapUiChartPaletteSequentialNeutralDark2 for the reference line and colors from the qualitative palette for the actual values, as illustrated below.

Line chart with one single target value for multiple actual values

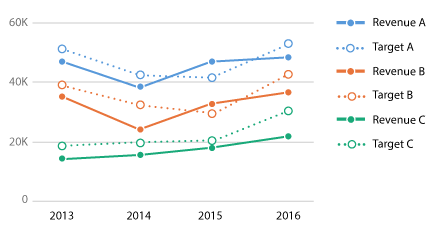
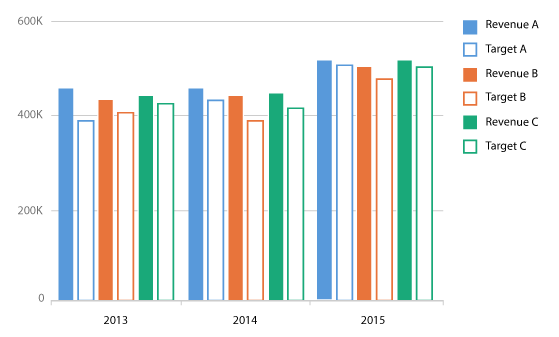
When the chart contains multiple pairs of actual values and reference values, you should use the same color for each pairs. The pattern will make the difference. Use the first colors of the qualitative palette:

sapUiChartPaletteQualitativeHue1, sapUiChartPaletteQualitativeHue2, sapUiChartPaletteQualitativeHue3…

Line chart with multiple pairs of actual and target values

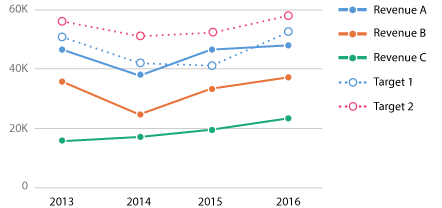
When the reference values and the actual values do not have a direct relationship, you should use colors from the qualitative palette and all the lines should all have different colors, as illustrated below.

Line chart with multiple actual values and multiple target values

Empty Area

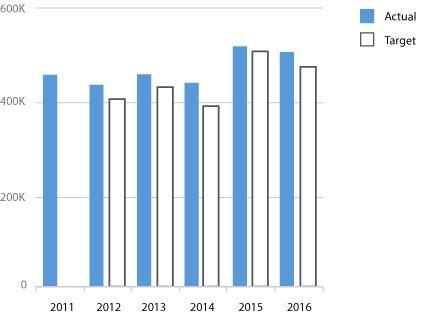
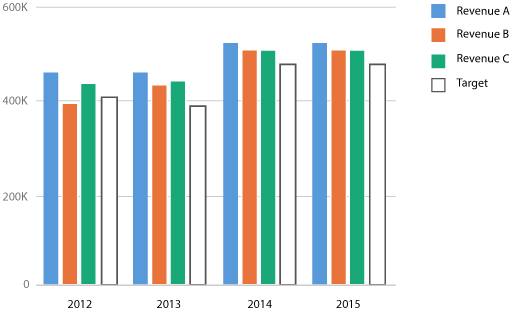
When columns or bars are used to display reference values (such as a target, plan or budget), you should use the empty pattern.  You should also use the color sapUiChartPaletteSequentialNeutralDark2 for the reference value and the first color from the qualitative palette for the actual value as illustrated below.

Column chart with actual values and target values

When the chart contains a reference value (like a target) for multiple actual values, you should use color sapUiChartPaletteSequentialNeutralDark2 for the reference value and colors from the qualitative palette for the actual values, as illustrated below.

Column chart with one single target value for multiple actual values

When the chart contains multiple sets of linked actual values and reference values, you should use the same color for each pairs. The pattern will make the difference. Use the first colors of the qualitative palette: sapUiChartPaletteQualitativeHue1, sapUiChartPaletteQualitativeHue2, sapUiChartPaletteQualitativeHue3…

Column chart with multiple pairs of actual and target values

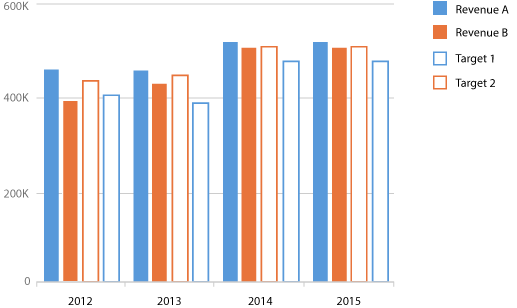
When multiple reference values and multiple actual values do not have a direct relationship, you should use colors from the qualitative palette.  Columns for the reference values and columns for the actual values should all have different colors, as illustrated below.

Column char with multiple actual vales and multiple target values

Resources

Want to dive deeper? Follow the links below to find out more about related controls, the SAPUI5 implementation, and the visual design.

Elements and Controls

Implementation

Chart – Part to Whole

This article explains how to use charts to visualize the different parts of a whole (expressed as a percentage).

Example use case: The regional sales revenue contribution shown in comparison to the total sales revenue of a company.

Information
For more information about the different charts mentioned in this article, see chart types.

Bar Charts

When designers think about visualising parts of a whole, they are invariably drawn toward the trusty pie chart. However, in many cases simple bars are in fact a far better option because you can:

  • Compare parts to each other.
  • Display category labels and value labels associated with each part.
  • Display multiple values.
  • Display small values in a better way.
  • Avoid having to use multiple colors and a corresponding legend.


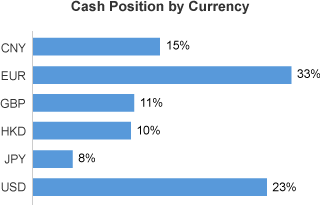
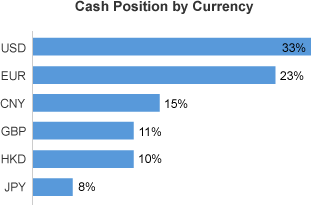
The first chart in this example below represents the cash position by currency.

If the order of the category items is not important, you should rank the items from the biggest value to the lowest value as illustrated below. This makes it easy to compare items and see the highest values and smallest values.

Part to whole shown using bars
Part to whole in bars, ranked by percentage

Pie Charts

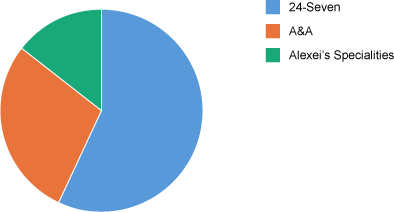
The pie chart (donut chart) is best used when there are only two or three slices to display, and when it’s not important to immediately have the exact value of each slice. Note that the values are ranked from the largest to the smallest to make reading and comparison easier, although you can use a different order if it’s important in the context of your application.

Part to whole in a pie chart

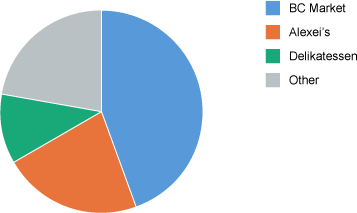
Pie charts are great to use if you’re primarily interested in seeing how much the largest values compare to the rest in percentage. In the chart below, a company has ten stores, but we are most interested in seeing how much percentage the three biggest stores represent. The rest of the stores have been grouped under a slice called ‘Other’. You can easily see that the first three stores represent approximatively 75-80%.

Pie chart with a slice “Other”

Variations Over Time

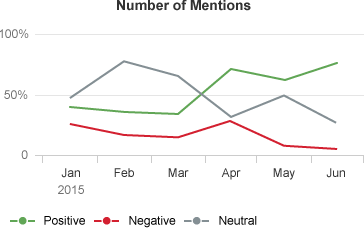
If you want to show how a part to whole evolves over time, you can use a line chart, multiple bar charts, or stacked columns. Generally speaking, the line chart is the best solution where you can use one line for each part of the whole as illustrated below.

Part to whole over time - Line chart

When there are a small number of time periods (between 2 and 4), you can use bar charts side by side as illustrated below. In this example, the chart represents the contribution of six product lines to the total revenue of a company over a period of four years. Because the first chart is ranked by percentage, you can easily identify when the shape of the different parts changes over time. You can see the contribution made by ‘Flat Screen TVs’ has increased over the last two years compared to the other product lines.

Part to whole over time, with few time periods

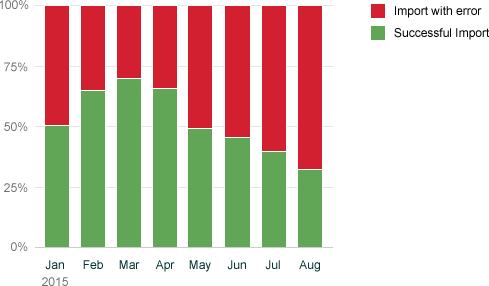
If there are only two parts in the whole, you can use a stacked column as illustrated below. Here the evolution of each part is immediately visible.

Part to whole over time - Stacked bar with 2 bars

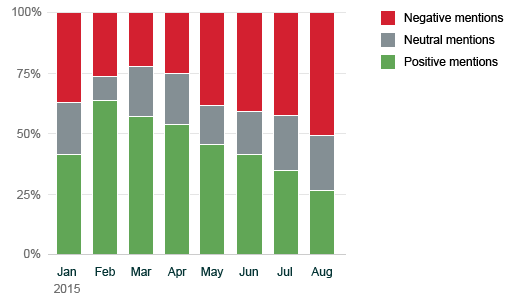
If there are more than two parts in the whole, the first and last values are easy to compare. However, it’s hard to grasp the evolution of parts that exist between the first and last parts. In the chart below the ‘neutral mentions’ are less important so it’s acceptable not to be able to compare them very easily, and only have a rough approximation of their evolution.

Part to whole over time - Stacked bar with 3 bars

Comparison

If you want to compare the composition of a whole between few items, use bar charts side by side. The chart below illustrates the contribution that five product lines make to the total revenue of three sales regions. Note that the first sales region is ranked by percentage, which makes easy to compare the shape of each chart.

Part to whole comparison between few category items

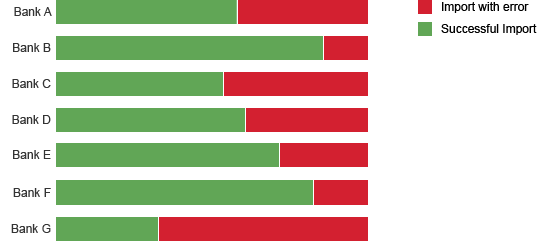
Stacked bars work well when you have only two parts. The chart below is used in the Cash Management app and displays the import status of bank statements for some banks expressed in percentages.

Part to whole comparison - 2 parts

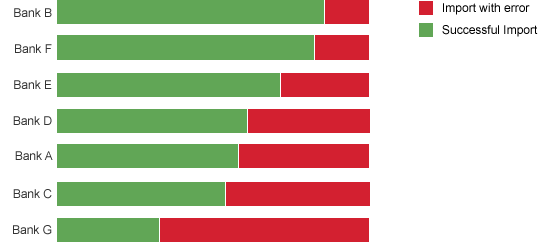
If there is no reason to display the items in a specific order, you can rank by one of the measures. The chart below contains the same information as the chart above, except now the banks have been ranked according to the successful import rate.

Part to whole comparison - 2 ranked parts

If there are more than two parts in the whole, the first and last values are easy to compare. However, it’s hard to grasp the evolution of parts that exist between the first and last parts.

The chart below displays the revenue contribution made by three sales regions of each for five product lines. In the context of the application, the ‘Asia’ sales region is less important so it’s acceptable not to be able to compare the values very easily, and only have a rough approximation of their evolution. The American sales region is also the most important, so it is displayed first in order to rank the product lines.

Part to whole comparison - 3 parts

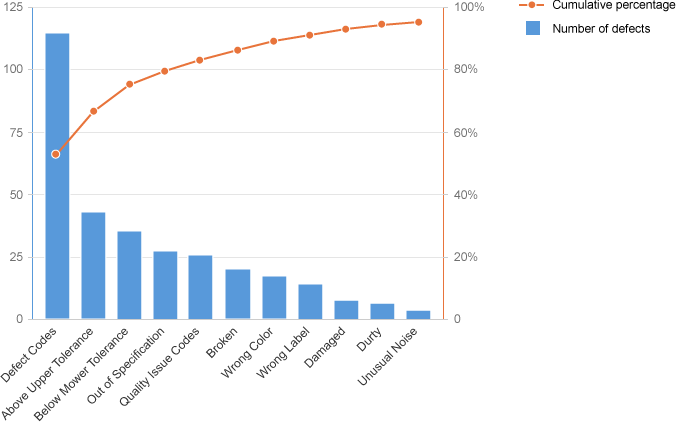
If you want to know which items have the biggest values and how many of these items contribute to the total of the values, you can use a Pareto chart which is designed to illustrate the well-known 80%/20% rule. That is, 20% of the items contribute to 80% of the total.

The chart below displays the number of defects by type of defect, and we can see that 80% of the defects come from the first four types of defect.

Part to whole - Pareto chart

Resources

Want to dive deeper? Follow the links below to find out more about related controls, the SAPUI5 implementation, and the visual design.

Elements and Controls

Implementation

Removing Leading and Trailing White Space

This article explains how to manage leading and trailing white space (blanks) when copying and pasting text into input controls (such as input fields, text areas, and so on).

Typically, white spaces are not typed manually, but rather appear as a byproduct of copying and pasting content into the input control.

White space can have negative impact to further processing. For example:

  • Fields might not be found in an exact search for the visible string.
  • It could lead to cluttered text alignment.
  • System(s) might distinguish objects “ABC” from “˽ABC” and “ABC˽”, which are visually equal to the user.
  • Fields with a fixed string length could risk losing data. For example, an input field with a maximum string length of 10 might receive “˽1234567890” via copying and pasting, but only be able to save “˽123456789” due to length limitations.

In order to avoid such issues, leading and trailing blanks can be automatically removed or trimmed.

Usage

Leading blanks within product IDs

Use field trimming if:

  • The leading or trailing white space is not needed for the business process.
  • The input fields have uniquely identifying business objects.
  • The input fields have a fixed field length.

Do not use field trimming if:

  • The use case explicitly requires leading/trailing white space. For example, for formatted text such as chats, comments, descriptions, source code, or for file names (according to the supported OS behavior).
  • For text areas where users would expect leading white space as a formatting tool.

Guidelines

The system behavior for field trimming should be coherent in all editing applications of a field and in all external interfaces (for example, for importing, system integration, and so on).

Chart – Deviation

This article explains how to visualize the deviation (difference or variance) between two measures, such as the difference between the product revenue streams over two years, or the difference between actual expenses and target expenses for different cost centers.

The first two sections address deviations within a non-time category. The last two sections are dedicated to time-category.

All figures that represent a deviation should include a + orsign. They can appear in the value axis, close to the data points in the plot area, and in popovers.

Deviation Only

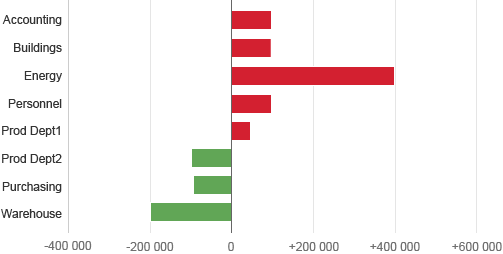
This section explains how to visualize the deviation (difference) between two measures, and only the deviation. The chart below shows the difference between the actual cost and budgeted cost for multiple cost centers.

Bar chart - Deviation between two measures

Deviation in Percentage

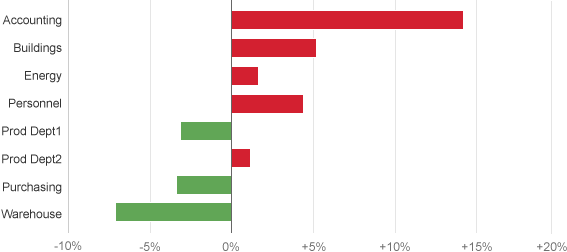
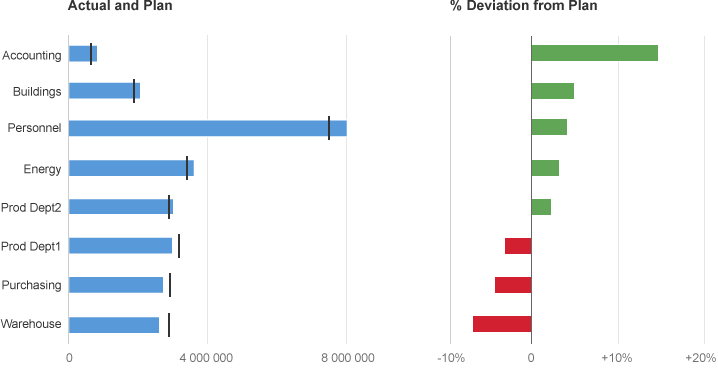
It’s a good idea to consider whether the actual value can be given as a percentage when displaying a deviation. The chart below displays the same information as the chart above, but the deviation is expressed in percentage.

Bar chart - Deviation in percent between 2 measures

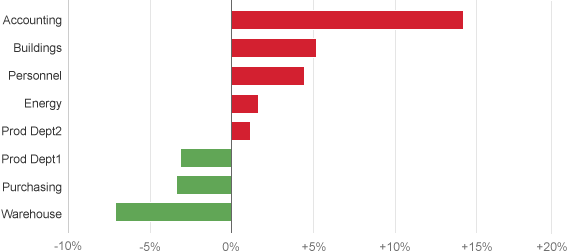
If the order is not important, you can also rank items to make the values easy to compare, as illustrated below.

Bar chart - Ranked deviation in % between 2 measures

Deviation and Measures

Sometimes you may want to display two measures and the variance (deviation) between them.

The best way to achieve this is by displaying two charts side-by-side: a bullet chart to display the two measures, and a bar chart to display the deviation. Placing the variance (deviation) in a separate chart makes it easy to compare the variance.

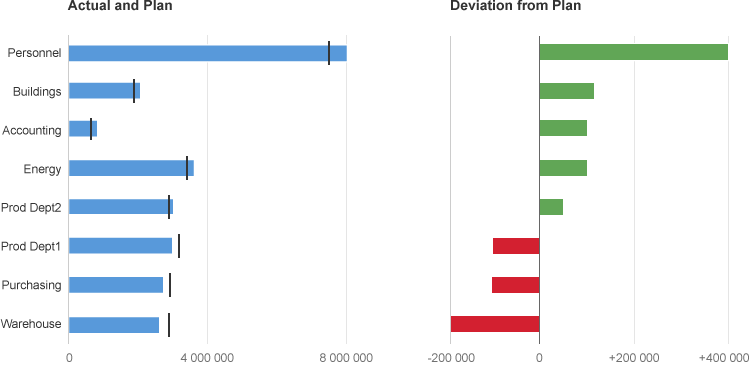
The chart below displays the variance between actual expenses and planned expenses for different cost centers and the deviation between them.

Actual and budget values and their deviations

For the same reason mentioned above, you should consider displaying the deviation in percentages as illustrated below:

Actual and budget values and their deviations in %

Time Deviation Only

This section explains how to show the deviation over time between two measures, and only the deviation. If you want to show the measures as well, please proceed to the the next section called ‘Time Deviation and Measures’.

Focus on Value

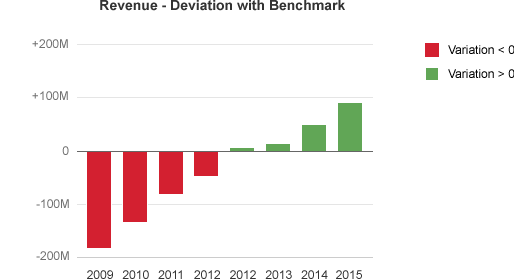
You can use a column chart when the value of the variance is more important than the trend of the variance.

Deviation over time in a column chart

Focus on Trend

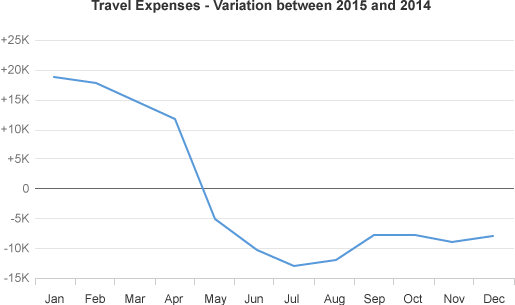
Use a line chart if you want to focus on the trend of the variation, as illustrated below.

Trend of a deviation over time using actual values

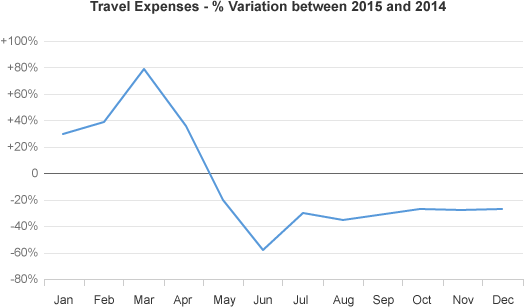
Sometimes, it’s better to see the deviation as a percentage. In these circumstances, choose one measure as the reference and express the deviation as a percentage of the reference. The chart below contains the same information as the chart above, but with the variation expressed in percentage. You can now see that the deviation in March and June were very high.

Trend of the deviation over time given as a percentage

Time Deviation and Measures

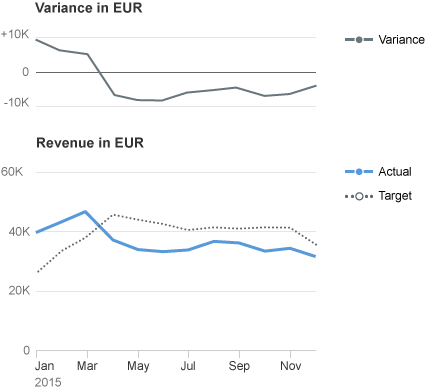
If you want to display two measures and the deviation in the same visualization, you can use two charts one above the other. And, if the trend of the measures and the variation is important, or if there are many data points, you can use two line charts as illustrated below.

Deviation and measures over time - Deviation in a line

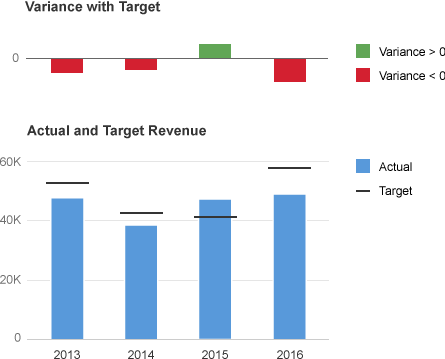
When the value of the variance is more important than the trend of the variance, you can use a bullet chart and a column chart side by side. The chart below displays actual and target values over time, as well as the deviation for each time period.

Actual and target values over time - Deviation in columns

Resources

Want to dive deeper? Follow the links below to find out more about related controls, the SAPUI5 implementation, and the visual design.

Elements and Controls

Implementation

Range Slider

A range slider is a user interface control that enables the user to select a value range within a predefined numerical interval.

Range slider
Range slider

Usage

Use the range slider if you want to select a value range within a predefined numerical interval. If you want to specify only a single value within a predefined numerical interval, use the slider instead.

Responsiveness

The range slider itself is not responsive. It adjusts to the responsiveness of its parent container by recalculating and resizing the width of the control. The range slider supports the cozy and compact form factors.

Types

Only a horizontal range slider is available.

Components

The range slider consists of:

  • Progress line
  • Minimum and maximum value
  • Grips
  • Tooltips or input fields
Range slider components

Behavior and Interaction

Changing Values

If the range slider is editable, the hand cursor appears when hovering over the range slider with the mouse. A tooltip also appears when hovering, displaying the current values of each grip. The grips move together with the corresponding tooltips.

The user can change the value range on the slider in two ways:

  • By using drag and drop to adjust the grips
  • By clicking the bar outside the value range. The corresponding grip then moves to the new position.

The grips can be moved with or without increments based on the predefined steps.

Range slider on hover

Range Slider with Input Fields

The range slider can be used with input fields instead of tooltips.

Range slider with input fields

Moving the Entire Range

Users can move the entire value range by dragging and dropping the progress line.

Range slider - Moving the entire range

Equal Values

The grips of the range slider can be positioned on the same value.

Range slider with equal values

Overlapping

The grips of the range slider can be moved across each other. The minimum can become the maximum, and vice versa.

Tick Marks

You can apply tick marks to the range slider. The tick marks are related to the step property. For example, if you have a range from 1 to 100 and a step of 10, the range slider will have 11 tick marks. The tick marks are responsive. If the distance between 2 tick marks is less than 8 px, all tick marks except for the first and last disappear.

Range slider with tick marks

Tick Marks and Labels

If tick marks are set, you can define labels for the tick marks. The labels are displayed below the tick marks and show the corresponding value of the tick mark. The labels must never overlap. You can also define labels only for specific tick marks if you don’t need a label for every tick mark on the slider. The application developer is responsible for defining a reasonable set of tick marks.

If there is not enough horizontal space to display all the labels, a responsive mechanism is activated. The first and the last label are always visible.

Range slider with tick marks and labels

Custom Values

You can define custom values as labels. This can be useful if your scenario requires descriptive intervals, such as as dates. Always keep the values as short and meaningful as possible.

Range slider with custom values as labels
Developer Hint
In order to use custom scales in a slider, you must map them to the floats for the slider scale.

Properties

  • The step property must be positive. If a negative number is provided, the default value 1 is used instead.
  • The minimum, maximum, and value properties can be decimals (float values). The slider automatically sets the minimum value to 0 and the maximum value to 100 by default.
  • The width of the control can be provided in percentage (%), em, px, and all possible CSS units. The slider automatically sets the width of the slider to 100% by default.
  • The range property determines the range in which the user can select values. If the value is lower/higher than the allowed minimum/maximum, a warning message is displayed.
  • The inputsAsTooltips property indicates whether input fields are being used as tooltips for the grips.

Resources

Want to dive deeper? Follow the links below to find out more about related controls, the SAPUI5 implementation, and the visual design.

Elements and Controls

Implementation

Choosing the Correct Chart Type

Charts are used to visually represent how numeric values relate to each other. Therefore, it’s crucial to define the type of relationship you want to illustrate when choosing the correct chart type.

Ranking

Rank items from highest to lowest, or vice versa.
For example: Rank countries by market share.
Use: Bar chart or column chart

For more information, see Chart – Ranking.

Comparison

Compare values of items in a list that has no particular order.
For example: Compare revenues in a list of products, or transaction volumes in a list of banks.
Use: Bar chart, stacked bar chart, bullet chart, heatmap.

For more information, see Chart – Comparison.

Variation Over Time

Show the variation of values over time.
For example: Show the stock level over time, or expenses by month compared to budget.
Use: Line chart, column chart, stacked column chart, bullet chart.

For more information, see Chart – Variation Over Time.

Part to Whole

Display the contribution of individual values to the whole.
For example: Show the percentage of sales attributed to various regions.
Use: Pie chart, bar chart, line chart, stacked bar chart.

For more information, see Chart – Part to Whole.

Deviation

Show the deviation, difference, or gap between two sets of values.
For example: Show the deviation between actual revenue and target revenue by product.
Use: Bar chart, bullet chart, column chart, line chart.

For more information, see Chart – Deviation.

Distribution

Show the distribution within a set of values.
For example: Show how exam scores are spread or grouped around the median score.
Use: Bar chart, column chart, stacked column chart, line chart.

For more information, see Chart – Distribution.

Correlation

Show the correlation between two or three sets of values.
For example: Show how sales revenues are impacted by customer age.
Use: Scatter chart, bubble chart, bar chart.

For more information, see Chart – Correlation.

Cumulation

Show the accumulation of successive values.
For example: Show cumulation of stock day by day, or cumulation of revenues and cost for profit and loss.
Use: Waterfall chart

For more information, see Cumulation (Waterfall Chart).

Geographical Values

Use a map to show the values associated with geographical areas.
For example: Show revenues by country or region on a map.

For more information, see maps.

Recources

Want to dive deeper? Follow the links below to find out more about related controls, the SAPUI5 implementation, and the visual design.

Elements and Controls

Implementation

No links.

Analytical Card

The analytical card is used for data visualization. It consists of two areas – a header area (either a standard header or a KPI header) and a chart area with a visual representation of the data. The analytical card is a single object card and does not contain a footer area. It can only be used in the overview page (OVP). In the resizable card layout, users can show more content/insights by resizing the card.

Responsiveness

The analytical card has a uniform horizontal width of either 20 or 25 rem, depending on the screen size. The height is flexible.

The cards can be used in both the fixed and resizable card layouts. As a general recommendation for the fixed card layout, we recommend using a limited number of data points (up to 4) or series (up to 2). For the resizable card layout, you can add more data points for larger card sizes, but still try to keep the series limited (up to 2).

The VizFrame charts within the cards are fully responsive.

Header Area

You can use two header types for the analytical card, depending on the use case:

Standard Header

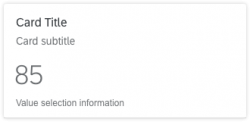
  • Title (mandatory): The title provides the most important information. We recommend using a single-line text, but you can also wrap the title to two lines.
  • Subtitle (optional): The subtitle can wrap to two lines, and gets truncated at the end of the second line. If the subtitle contains multiple qualifiers, separate them with comma. Do not repeat the chart title.
Standard header
Standard header

KPI Header

  • Title (mandatory): The title provides the most important information. We recommend using a single-line text, but you can also wrap the title to two lines.
  • Subtitle (mandatory): The subtitle can wrap to two lines, and gets truncated at the end of the second line. The unit of measure is shown at the end of the subtitle. We therefore recommend keeping the subtitle short and within one line. If the subtitle contains multiple qualifiers, separate them with comma. Do not repeat the chart title.
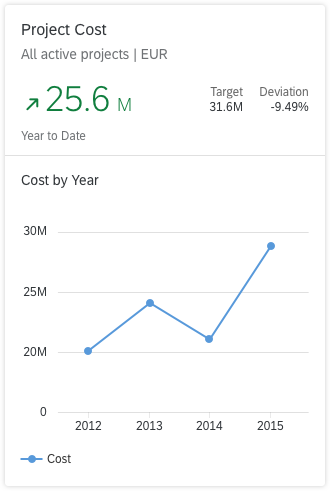
  • KPI area, containing the following elements:
    • Trend arrow (optional)
    • KPI value (mandatory): The KPI value uses semantic colors.
    • Percentage symbol (optional)
    • Value selection information (optional): Manually-entered text to provide a better description of the key value (for example, Number of Products). Use this element if the sorting information and the filters do not provide enough information to properly describe the value. This text truncates after one line.
    • Sorting information (mandatory): Describes the KPI/value.
    • Filters (optional): Can be modified to show meaningful texts.
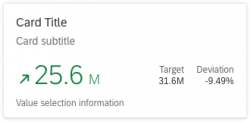
    • Target and deviation (both mandatory). Can be relative or absolute values.
KPI header
KPI header
KPI header
KPI header

Types

8 chart types are currently supported by the analytical card:

Information
For additional information about the different chart types, as well as tips for choosing the correct chart type, see the following articles:

Line Chart

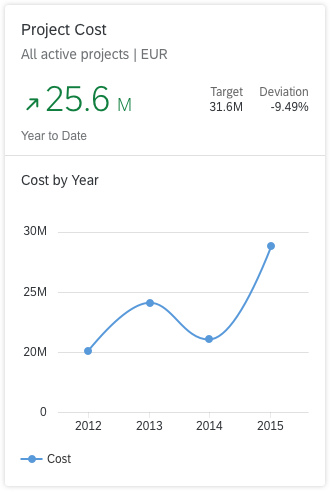
In general, the line chart is the most efficient chart for showing the evolution of a trend over a period of time. You can choose between two line types: linear (default), and spline interpolation.

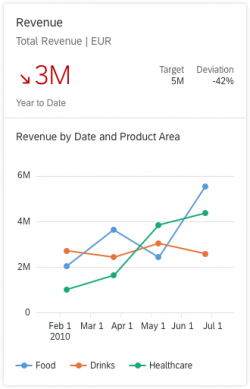
  • Avoid showing more than four lines on the same card.
  • When showing more than one line in the chart, do not use different units. All the lines should use the same unit, such as “EUR”.
  • You can use a line chart with both a time axis and another color dimension.

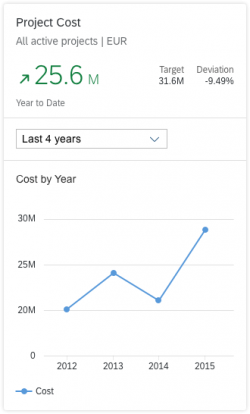
Line chart with time axis + color dimension

Use the line chart if…

  • You want to emphasize the evolution of a trend over a period of time.
  • You want to visualize data that has an intrinsic order, such as age, ranges, or ratings (but excluding time).

Do not use the line chart if…

  • You want to emphasize the values themselves. Use a column chart instead.
  • The data does not have an intrinsic order.

Note: For time series, we recommend using the time axis.

Analytical card with line chart and view switch

Bubble Chart

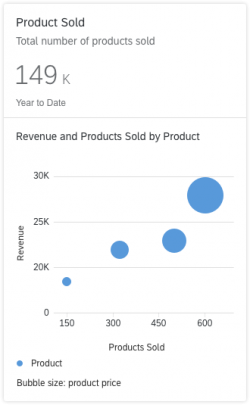
A bubble chart displays the correlation between three sets of numerical values. One set is represented by the horizontal axis, another set is represented by the vertical axis, and the third set is encoded in the size of the bubbles.

We recommend showing only one or two series. Because series are represented by specific bubble colors, having too many series/colors can make the chart hard to read.

The sizes of the bubbles are determined by the values in the third data series. The measure that is represented by the bubble size is defined below the chart.

Bubble charts are often used to facilitate the understanding of social, economic, medical, and scientific relationships.

Color

  • If the goal is to isolate outliers within a cloud of other bubbles, use the same color for all bubbles.
  • If the goal is to group bubbles that have the same characteristic, use one color per group. Warning: Too many colors can make the chart hard to read.
  • If the goal is to compare bubbles individually, use one color per bubble. Only use this option if there are very few bubbles.

Use the bubble chart if…

  • You need a rough approximation of the values encoded in the bubble size.
  • You want to represent data with three dimensions on a 2D chart.
  • You want to compare and show the relationships between labeled/categorized circles using positioning and proportions.
  • You want to display the correlation between three sets of numerical values.

Do not use the bubble chart if…

  • You need to represent information with only two dimensions.

Note: For time series, we recommend using the time axis.

Analytical card with bubble chart

Column Chart

Column charts are used to compare multiple values over time, or values that have an intrinsic order (such as age).

Columns are clustered side-by-side along the horizontal axis and are color-coded by series.

  • We recommend using no more than two series and a maximum of four category items.
  • If you want to show the trend over time for two series, you can use the line chart with two lines instead of two series of columns.

Use the column chart if…

  • Category items represent a time series. The natural orientation for time is from left to right.
  • Category items have an intrinsic order (such as age, range, or ranking).
  • You want to emphasize the values themselves, rather than the trend.

Do not use the column chart if…

  • Your data is not related to a time category or to a category with an intrinsic order.
  • You want to emphasize the trend. In this case, use the line chart instead.

Note: For time series, we recommend using the time axis.

For more detailed information, see column chart.

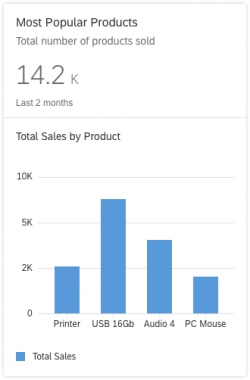
Analytical card with column chart

Stacked Column Chart

This type of visualization depicts items stacked on top of one other in columns, with the item categories differentiated by colored bars or strips.

This chart works only for time series and categories with an intrinsic order.

Use the stacked column chart if…

  • You want to display the variation of a sum of measures over a period of time.
  • The sum of the values is as important as the individual items.

Do not use the stacked column chart if…

  • Accuracy or comparisons are of primary importance. In this case, a line graph might be the better option.

Note: For time series, we recommend using the time axis.

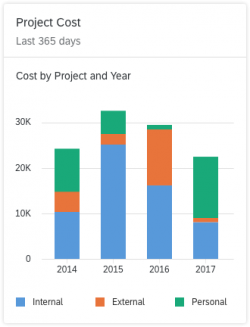
Analytical card with stacked column chart

Vertical Bullet Chart

The bullet chart is used to compare a primary value to a secondary value over time, or for a category that has an intrinsic order (such as age, range, or ranking).

The bullet chart supports primary values, secondary/comparison values, and additional values. For more information, see bullet chart.

Use the bullet chart if…

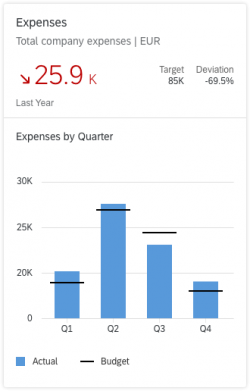
  • You want to compare a primary value to a secondary value using a reference point (for example, if you want to compare actual and planned costs per quarter).
  • The category items represent a time series. The natural orientation for time is from left to right.
  • The category items have an intrinsic order.

Do not use the bullet chart if…

  • Your data does not have an intrinsic order.
  • You have only one series of data.
  • There is no data series that can act as a reference point for the other data series.
Analytical card with bullet chart

Donut Chart

The donut chart represents parts of a whole, where the whole is always 100%. The data is displayed in rings. Each ring represents a distinct data series.

The donut chart can display absolute values (default) or relative values (%). To make the values easier to read, we recommend showing a maximum of 2 decimal places.

  • If NumberOfFractionalDigits is not specified in the annotation, the default is to display a single decimal place.
  • If NumberOfFractionalDigits is specified in the annotation, the chart shows the values with the defined number of decimal places (0, 1, 2, 3, and so on).

We recommend using a maximum of four sections in the donut chart. If there are more than four sections in the chart, you can use an Other section, which merges several sections into one. The number of sections included in the Other section is mentioned in the legend item.

Use the donut chart if…

  • You want to visualize the part as a percentage of the whole.

  • You have one or more category items that you want to plot.

Do not use the donut chart if…

  • You want to plot negative or zero values.
  • You have more than four categories or sections.
  • You want to compare data over time. You can use the column chart, line chart, stacked column chart, or bullet chart instead.

Note: If you are using donut chart in the resizable card layout, users will be able to see more of the sections that were grouped in the Other section as they increase the size of the card.

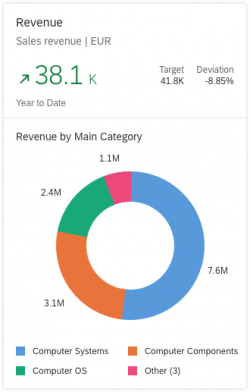
Analytical card with donut chart

Combined Column and Line Chart

Combined column and line charts are used to compare two sets of values over time, or for a category that has an intrinsic order (such as age, range, or ranking).

You could also use a column chart or a line chart instead, but using a combined column and line chart is the better choice if you want to clearly distinguish between the two sets of values, or if the values represent different measures, such as revenue and profit.

Use the combined column and line chart if…

  • You want to compare values in different categories.

  • You want to give a clear view of which category is higher or lower.

  • You want to use more than one measure.

Do not use the combined column and line chart if…

  • The combination of the data shown in the line and columns is not logical.

Note: For time series, we recommend using the time axis.

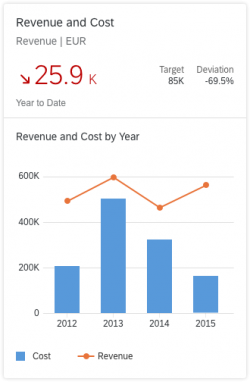
Analytical card with combined column and line chart

Scatter Plot Chart

A scatter plot chart displays the correlation between two sets of numerical values. The data is displayed as a set of points plotted on a horizontal and vertical axis.

We recommend showing only one or two series. Because bubbles in a series are color-coded, having too many series/bubbles can make the chart hard to read.

While the scatter plot chart can support different shapes, we recommend that you only use bubbles to make the chart easier to read.

If you need to increase or decrease the size of the bubbles, you can adjust the plotArea.markerSize property. The available range is from “4” to “32”. The default value of the bubbles is “10”.

Use the scatter plot chart if…

  • You want to show the correlation between two sets of numerical values (for example, the correlation between age and income).

Do not use the scatter plot chart if…

  • You want to show the correlation between three sets of numerical values. Use the bubble chart instead.
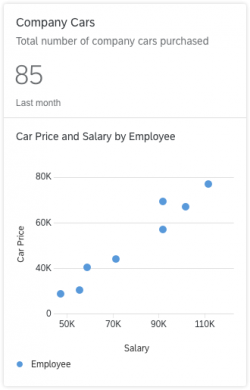
Analytical card with scatter plot chart

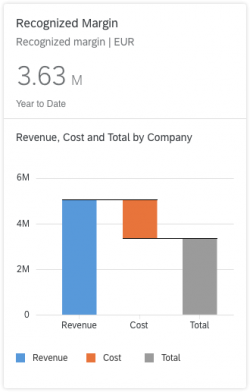
Waterfall Chart

A waterfall chart is a form of data visualization that helps users to understand the cumulative effect of a sequence of positive or negative values.

This type of chart is helpful for a variety of different scenarios. For example, it could be used to visualize financial statements or changes in performance, or to navigate data on population, births and deaths.

In the fixed card layout, we recommend showing only the subtotal and total information (up to 4 columns).

The waterfall chart can be used with categorical axis, time axis and semantic colors.

Use the waterfall chart if…

  • You want to show intermediate totals along the way before showing the final cumulative total.
  • You want to show the net value, by breaking down the cumulative effect of positive and negative contributions.

Do not use the waterfall chart if…

  • You want to compare multiple values over time, or for values that have an intrinsic order (such as age). In this case, use the column chart instead.

Note: For time series, we recommend using the time axis. Note that totals and subtotals are not supported when using a time axis.

For more information, see Waterfall Chart.

Analytical card with waterfall chart

Behavior and Interaction

The entire header area of the card is clickable. From there, the user can navigate to the specific app or view from which the card content originates. If you need to show detailed information about a specific data point, you can use single selection mode. In this case, it is up to the app developer to provide meaningful navigation. For example, clicking a section from the donut chart could lead to an object page that provides more information.

Analytical cards support 3 navigation modes. In all modes, clicking a blank area on the chart does not trigger any actions.

No navigation

If navigation is not defined in the identification annotation, clicking the header or the chart does not trigger any actions.

Data point navigation

If data point navigation is enabled, navigation within the chart is available only for data points. This is the default behavior: users can navigate from the header and from the individual data points.

For this header and chart navigation, set the navigation property to “dataPointNav”.

Header navigation

If you only need to offer header navigation without chart navigation, set the navigation property to “headerNav”.

Guidelines

Number of Data Points

There is no technical limitation on the number of data points, but be aware that too many data points can diminish the user experience. For example, if the card is only one column wide, and there is not enough space, the labels for the horizontal axis are displayed at 45°.

With the resizable card layout, you can load more data points when the card is wider than one column.

Chart Title

The chart title is always visible for each chart type. It describes the axes of the chart, and is constructed using the measures and dimensions of the chart. For example, Revenue by Quarter indicates that the y-axis represents the revenue, and the x-axis represents the quarters. The title is truncated at the end of the line.

Time Axis

You can use the different chart types with either a time axis or a category axis. We recommend using the time axis when the category items represent a time series. The time axis is more responsive and displays information in a more user-friendly manner than the category axis. Currently, the time axis is supported for the line, column, bubble, waterfall and combination charts.

The time axis has three main advantages:

  • It allows you to display dates and times in a responsive manner.
  • All the complexity involved with formatting the axis labels is taken care of automatically.
  • The physical spacing between the data points accurately represents the time scale, as opposed to being equidistant.

The analytical cards on the overview page automatically use the time axis if the following conditions are met:

  • The chart type is “Line”, “Bubble”, “Column”, “Waterfall” or “Combination”.
  • The chart is configured with only one dimension.
  • The data type of the dimension is either “datetime” or “edm.string”. If the data type is “edm.string”, it must contain the additional annotation in the OData metadata annotation (sap:semantics = “yearmonthday”).
  • If the chart type is “Bubble”, there must be exactly 2 measures.
  • If the chart type is “Combination”, there must be at least 2 measures.

Axis Title

The axis titles are always hidden, except in the bubble and scatter plot charts. Where the axis titles are hidden, use the chart title of the analytical card to describe the chart content. For example, Revenue by Quarter indicates that the y-axis represents the revenue, and the x-axis represents the quarters.

Axis Scaling

There are 3 axis scaling options for line charts, bubble charts, and scatter charts:

  • Default: The minimum and maximum are calculated from the dataset. 0 is always visible.
  • Adjust scale: The minimum and maximum are calculated from the dataset. 0 is not always visible.
  • Min-max: Manually set by the app developer.

Axis Labels

Try to avoid displaying labels at 45°. Use abbreviations for time periods, such as Jan or Feb for months, or Q1 or Q2 for quarters.

Semantic Patterns

The analytical card supports semantic patterns, such as dashes, dots, or hatches, in order to distinguish:

  • Actual values: What values are (solid pattern).
  • Projected values: What values might be (dashed line, hatched areas).

Currently, semantic patterns are supported for the following chart types: line chart, column chart, and vertical bullet chart.

Semantic Colors Based on Values

Use semantic coloring based on values when you want to show data points that are positive, neutral, or negativeBased on the defined threshold values, the color of each data point could be red, green, or orange. For more information, see colors.

Legend

Colors are assigned automatically and cannot be customized.

View Switch

You can use the view switch to offer the user different views of the data on one card. It can be used for filtering, sorting, or grouping (for example, by supplier or material group). The view switch is optional.

Resources

Want to dive deeper? Follow the links below to find out more about related controls, the SAPUI5 implementation, and the visual design.

Elements and Controls

Implementation