Overview Page (OVP) Floorplan

Information
This floorplan is implemented as an SAP Fiori Element.

Intro

View, Filter, and Take Immediate Action

The overview page (OVP) is a data-driven SAP Fiori app type and floorplan that provides all the information a user needs in a single page, based on the user’s specific domain or role. It allows the user to focus on the most important tasks, and view, filter, and react to information quickly.

Each task or topic is represented by a card (or content container). The overview page acts as a UI framework for organizing multiple cards on a single page.

The overview page is based on SAP Fiori elements technology, and uses annotated views of app data, meaning that the app content can be tailored to the domain or role. Different types of card allow you to visualize information in an attractive and efficient way.

At a Glance

  • Entry-level view of content on cards

  • One specific context and task area for one role

  • Content from different sources shows side by side – no need to switch screens

  • Information can be visualized on cards in different ways (texts, charts, lists, tables)

  • Micro actions let users react on the spot
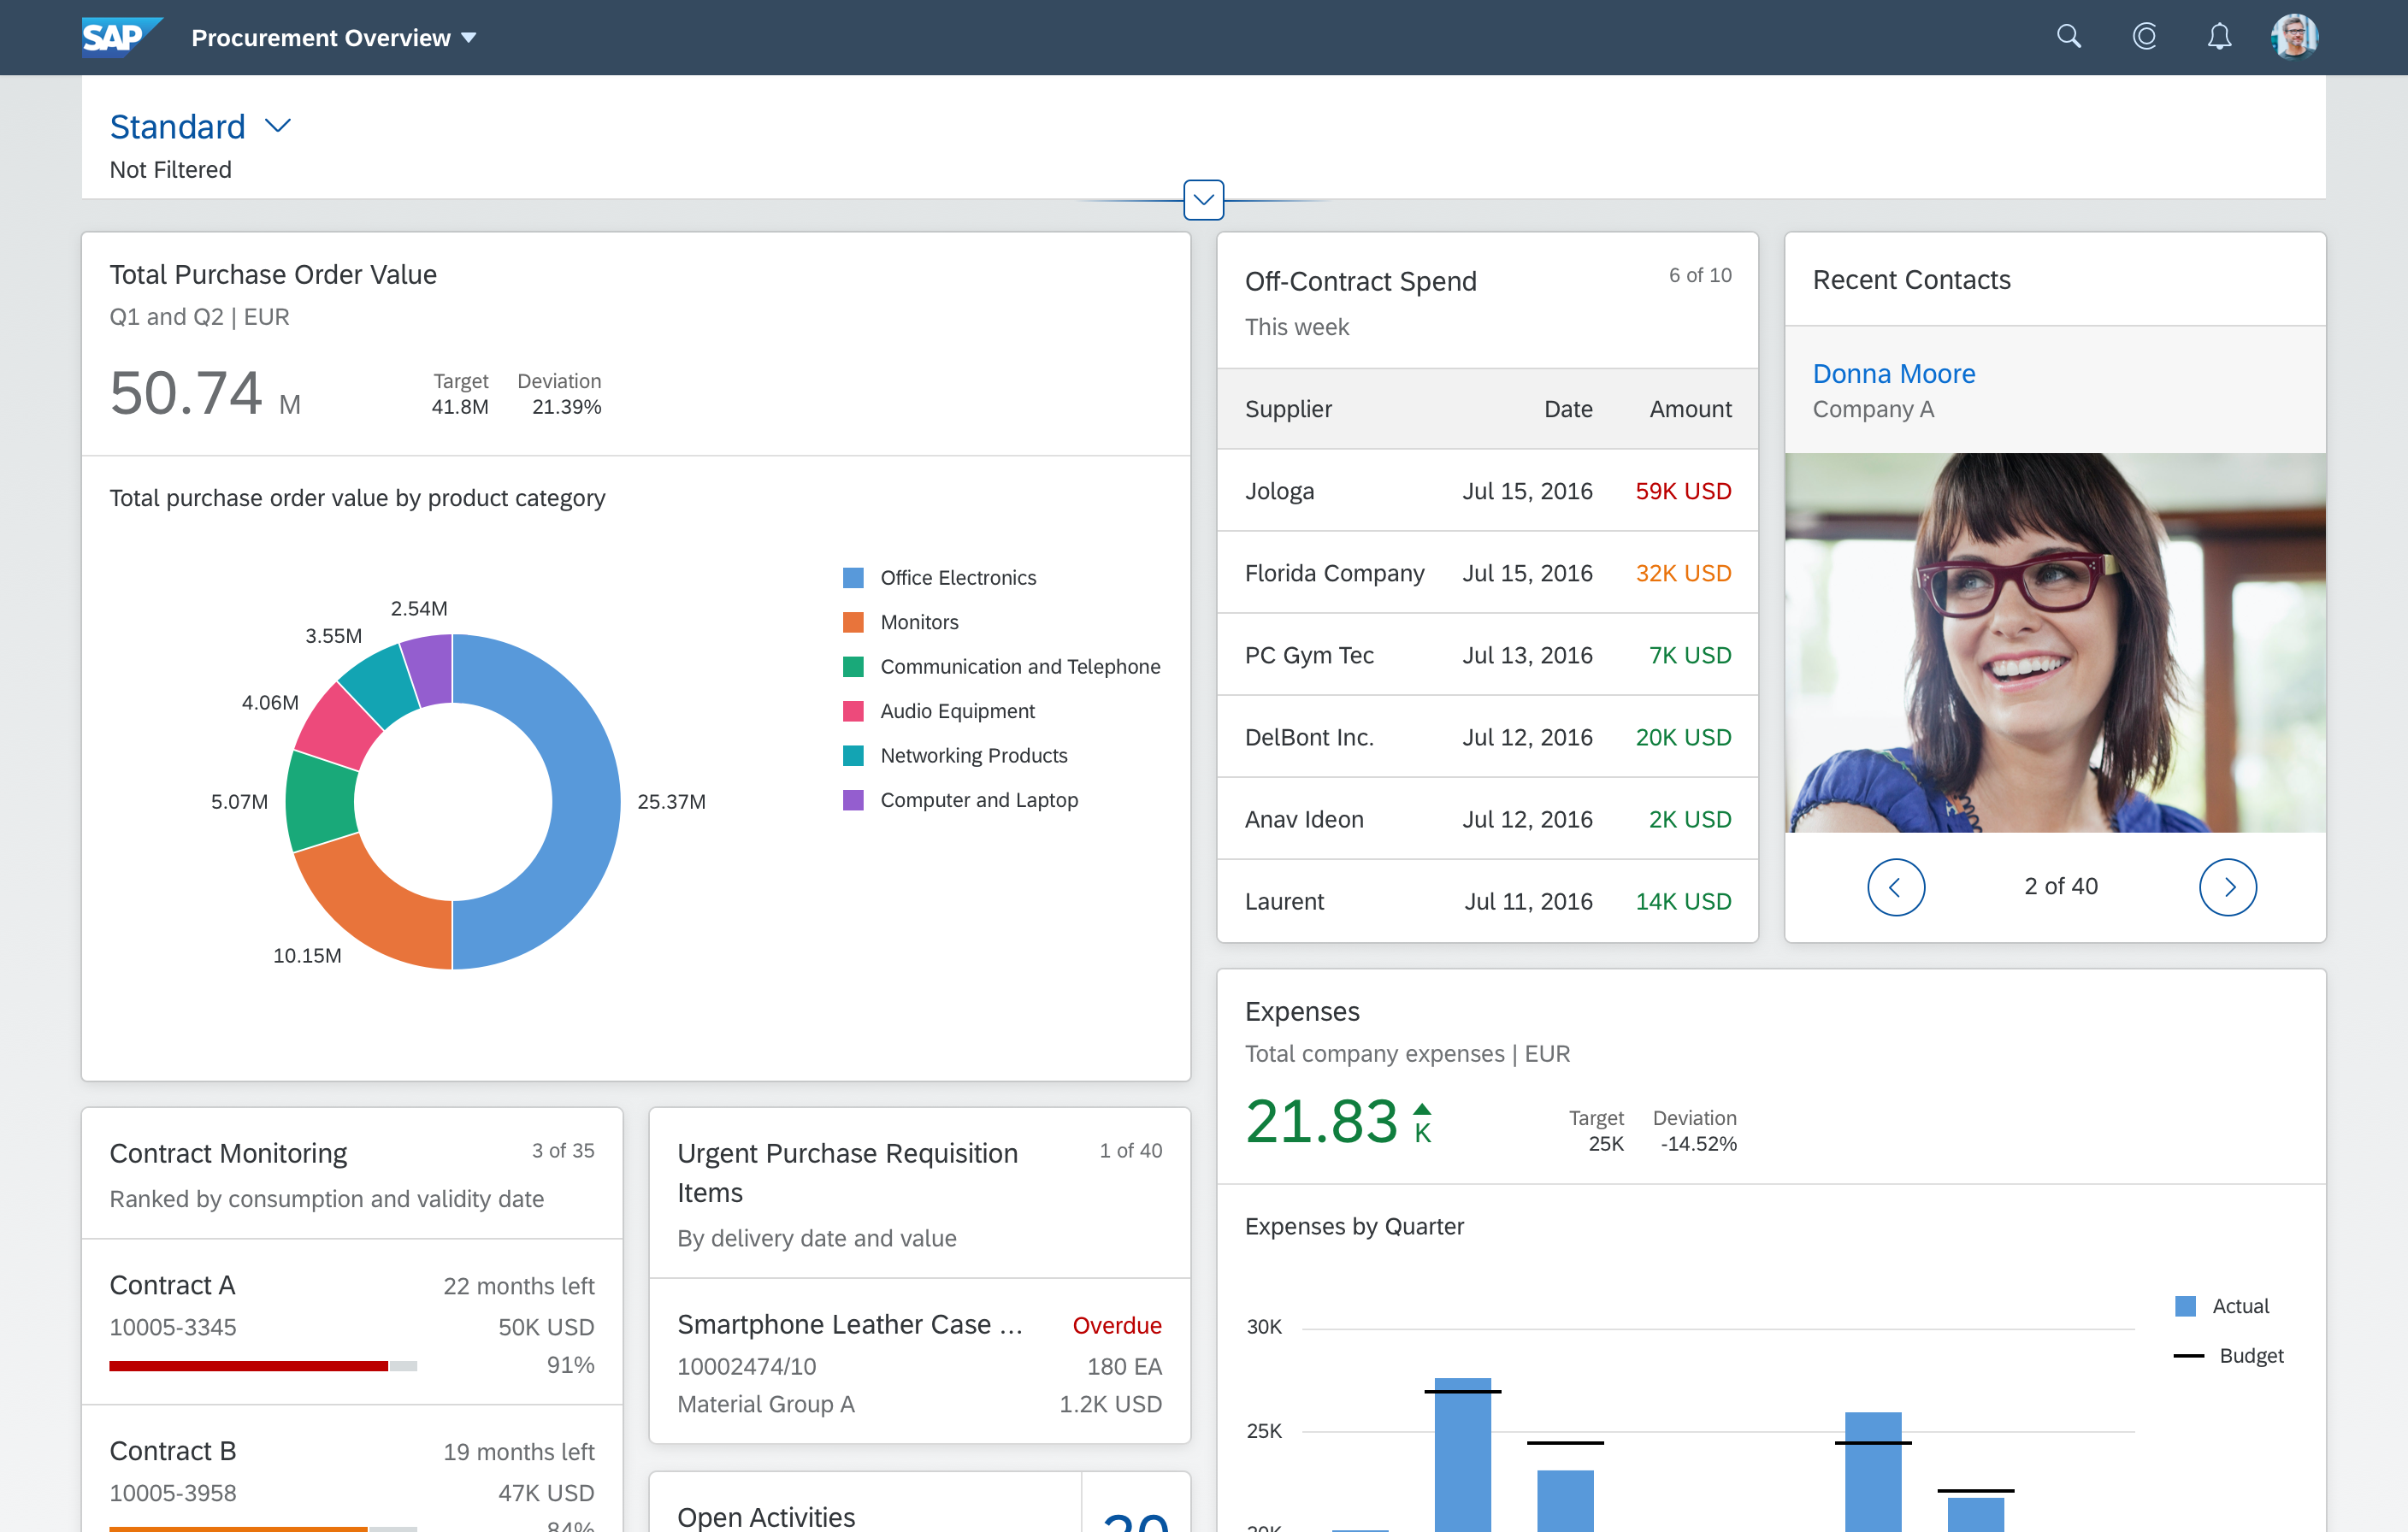
Overview page
Overview page

When to Use

Use the overview page if:

  • You want to provide an entry-level view of content related to a specific domain or role.
  • Users needs to filter and react to information from at least two different applications to complete their role-specific tasks.
  • You want to offer different information formats (such as charts, lists, and tables) on a single page.
  • You plan to have at least three cards. These cards should not all be of the same type.

Do not use the overview page if:

  • A high-level or birds-eye view of application content is sufficient.
  • You just want the user to launch an application. In this case, use the SAP Fiori launchpad home page.
  • You want to show information about one object only. In this case, use the object page.
  • You just represent one application and less than three cards. In this case, use the object page.

SAP Fiori Launchpad Home Page, Overview Page, and Object Page

The launchpad home page contains all of a user’s favorite apps and offers access to them via tiles. This covers all the roles that a user might have, such as employee, manager, production worker, or quality manager.

An overview page focuses on the key tasks for a specific role, and contains only the most frequently-used apps for that role. The overview page uses cards, which display more (preview) information than tiles because of their size, properties, and interaction areas. One card type also allows users to perform simple actions. Cards represent an entry-level view of application content.

Launchpad Home Page vs. Overview Page

Launchpad Home Page Overview Page
Framework (given) SAP Fiori application (optional)
“Birds-eye” view “Street-level” view
Single point of entry Specific business context for a role
One SAP Fiori launchpad per user Multiple overview pages per user possible
Access to all the user’s favourite applications Selected applications are presented as cards
Uses tiles Uses cards
No actions Micro actions

The overview page is always role-based. The user sees a heterogeneous set of information related to a specific business context and the tasks associated with a specific role. This is not the case with the object page, which contains homogenous, object-based information.

Overview Page vs. Object Page

Overview Page Object Page
Role-based Object-based
“Street-level” view “Details” view
Heterogeneous information Homogeneous information

Role-Specific Overview Pages

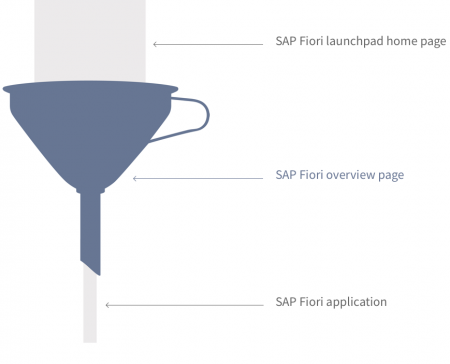
As you can see in the picture, the overall content scope (shown in gray) becomes more focused with each interaction step. An overview page brings together information from different sources that support a specific task or information need. Only provide an overview app for a role if it makes sense to do so.

If a role or user has several main tasks that each require a specific set of information, the role or user might also have multiple overview apps. For example, one overview app could be used to reflect the user’s role as manager, with information for managing team performance reviews. Another overview app could be used to track quality issues and other relevant information pertaining to the machines that the user is responsible for in the role of quality manager.

Metaphor – Different entry points in SAP Fiori

Components

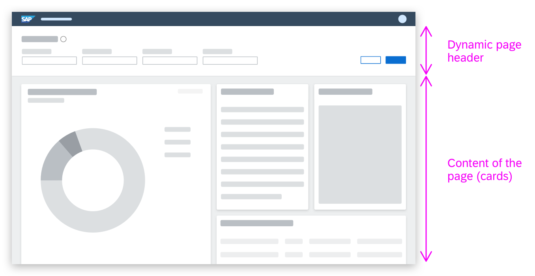
The basic structure and appearance of the overview page is governed by the dynamic page layout, and is divided into a header area and a content area.

This enables you to use variant management, text, and a smart filter bar in the upper part of the screen (dynamic page header). The content of the overview page is presented using cards.

Two different layouts are available, which determine the size and position of the cards: fixed card layout and resizable card layout.

Overview page – Basic structure

Dynamic Page

The dynamic page header comprises the header title and expandable/collapsible header content. Three different header variants are available for overview pages

In the overview page, the header content is used for the smart filter bar with the live update mode (variant 1 and variant 2): the results are updated immediately whenever the user changes a filter field. As a result, there is no Go button for the filter bar.

Users can expand/collapse and pin the header content with the two icon buttons below the smart filter bar:

  1. Expand/collapse header or   
  2. Pin/unpin header content 

Dynamic Page Variants for the Overview Page

The header title (either text or variant management) is mandatory, while the header content (smart filter bar) is optional. Variant 3 shows only a text in the header title.

Variant 1 Variant 2 Variant 3
Dynamic page header Yes Yes Yes
Header title Variant Management Text Text
Header content Smart Filter Bar Smart Filter Bar
Page content Cards Cards Cards

In this variant, the header title contains variant management and the header content includes the smart filter bar. The initial default uses the collapsed mode, because content is already available on the cards, and users can start right away. When the user scrolls or clicks, the header content expands as defined. The header title offers the Share menu, which enables the actions Send Email and Save as Tile.

Dynamic page variant 1 – Expanded mode

In this variant, the header title contains a text (Header Title in the example below) and the header content area contains the smart filter bar. The initial default uses the collapsed mode, because content is already available on the cards, and users can start right away. When the user scrolls or clicks, the header content snaps as defined.

Dynamic page variant 2 – Expanded mode

In the third variant, the header title contains a text (Header Title in the example below). This text serves the same purpose as the former page subtitle. The header content is empty (auto hidden) and therefore doesn’t snap. The content area displays the overview page cards.

Dynamic page variant 3 – Expanded/collapsed mode

Overview Page Layout

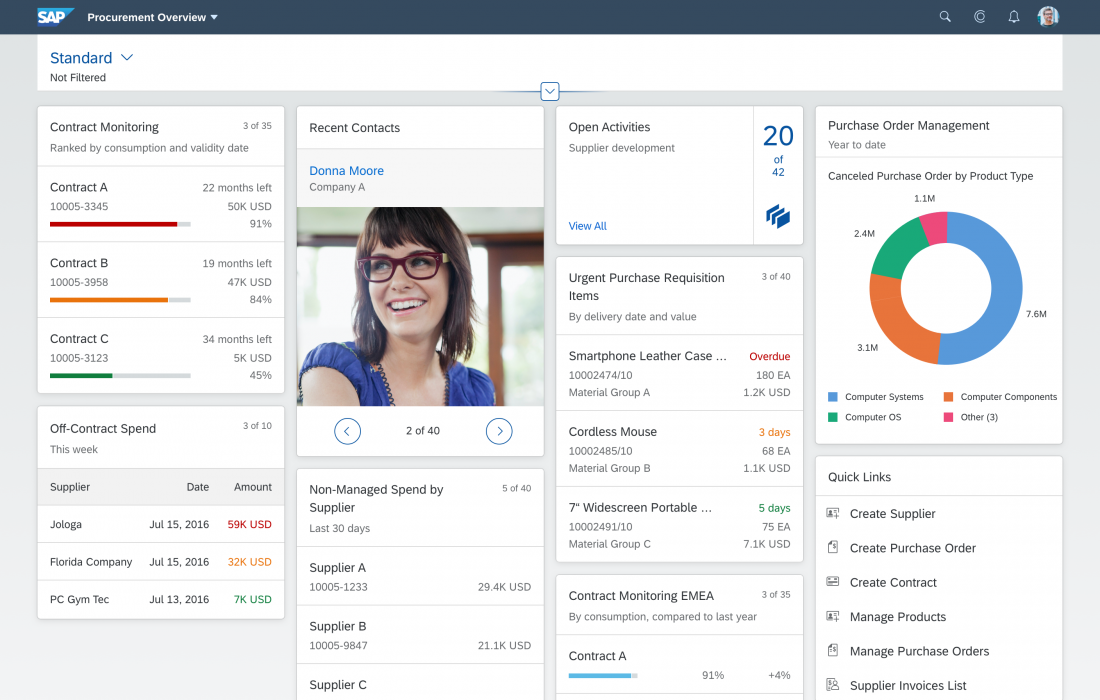
Fixed card layout
Fixed card layout
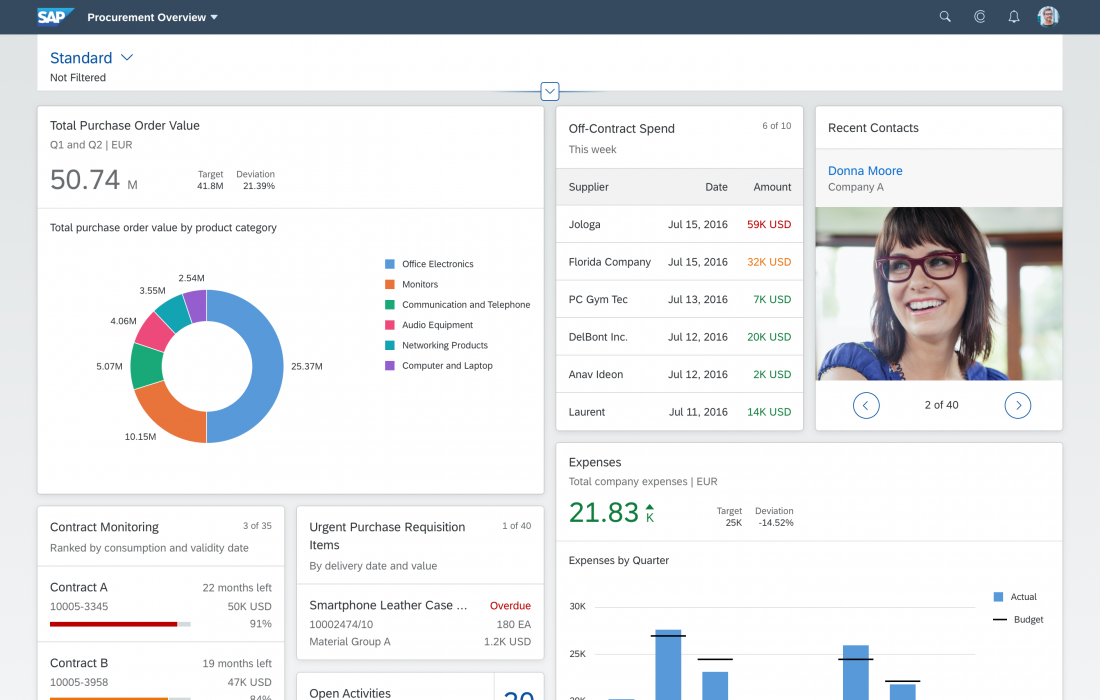
Resizable card layout

The overview page layout describes the position, size, and characteristics of cards in the content area below the dynamic page header.

There are two layout variants:

Only place cards on the overview page. Never add tiles.

Fixed Card Layout vs. Resizable Card Layout

Fixed Card Layout Resizable Card Layout
Fixed card width and predefined height Resizable card sizes (grid-based)
Users can’t influence the card size Users can influence the card size individually
Predefined static card characteristics Flexible content insights (such as more items, zoom, or different levels of detail)
Lower implementation effort – defined card patterns Higher implementation effort – content strategy required
Self-contained cards Highly interactive and flexible cards
Fast overview and navigation Fast overview, navigation, and investigation
Cards can be swapped Drag and drop supported for cards
Maximum of 5 card columns (letterboxing) Unlimited number of columns

Personalized Selection of Cards

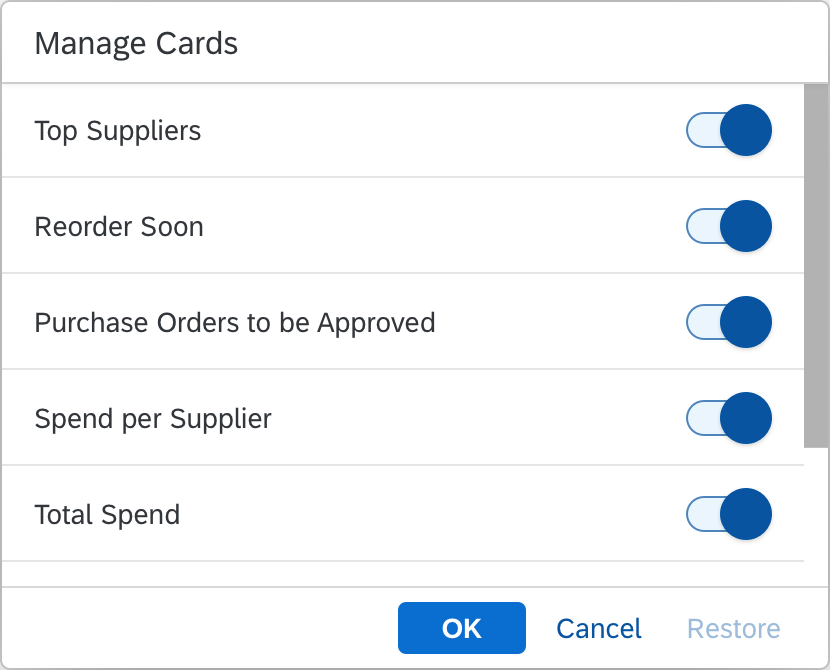
Users can also hide cards. The corresponding setting is in the user actions menu under Manage Cards. A dialog appears on the overview page, and lists the different card names. Users can opt to show or hide the cards using a switch control. Restore reinstates the default setup. The personalized setup stays until the user next changes it.

Each overview page app has its own Manage Cards setting. Users who work with several overview pages can personalize the cards shown for each one.

Overview page – 'Manage Cards' dialog after initial loading

Behaviour and Interaction 

As for any other SAP Fiori app, users open overview page apps by selecting a tile on the SAP Fiori launchpad home page, or by bookmarking the direct link in a browser. From the overview page the user decides which issues need attention, and navigates via cards to the relevant SAP Fiori apps. In addition, users can also access the navigation menu in the shell bar, which allows fast and easy navigation to other apps. The overview page supports navigation to both SAP Fiori and non-SAP Fiori apps. For SAP Fiori apps, it uses intent-based navigation. Non-SAP Fiori apps open in a new browser window.

In the screen flow, always position the overview page app between the SAP Fiori launchpad home page and the SAP Fiori app. The overview page doesn’t replace the SAP Fiori launchpad home page. Never start overview page apps from another SAP Fiori app.

The picture below illustrates the complete interaction flow:
SAP Fiori launchpad home page ➝ SAP Fiori overview app ➝ SAP Fiori app or non-SAP Fiori app

Overview page – Interaction flow

Initial Focus

When the overview page is loaded, set the initial focus as follows:

  • If no cards are loaded, and the filter bar is in manual mode, set the focus on the Go button or on the first filter field.
  • If no cards are loaded, the filter bar is in manual mode, and a mandatory field is still empty, set the focus on the mandatory field.
  • When all cards are loaded, set the focus either on the first card or the header of the first card.

Dedicated Floorplan

While other floorplans like the list report and object page can be combined in a single app, there is a 1:1 relationship between the overview page floorplan and the corresponding overview app. The overview page floorplan is never combined with other floorplans. Because of this, the terms “overview page floorplan” and “overview (page) app” are often used synonymously.

Cards

Overview page – Different card types (selection)

Cards are containers for app content, and represent an entry-level view of the most pertinent app data for a given topic or issue. The overview page can contain several cards that reference the same underlying application. However, each card must bring added value to the user, and not just repeat information already offered on another card.

Cards can display different types of content. They can show a chart, a list, a table, informative text, or a combination of two elements. Cards can also vary in size, depending on the selected layout. However, cards never have editable fields.

When designing cards, make sure that you define and format the texts on all the cards consistently. Check the UI text guidelines for the overview page for details.

For more information about the cards and card types available for the overview page, see the dedicated topics:

Information
Please note that the integration cards cannot be consumed by the overview page.

Responsiveness

The overview page is fully responsive and can accommodate typical laptop screens as well as larger desktop monitors. The responsive behaviour differs for the two layout types – fixed card layout and the resizable card layout.

Both feature responsive (collapsible) “columns” of cards that can scale all the way down to tablet or phone screen sizes. For more information on each card type, follow the respective links.

Top Tips

Before you start designing an overview page, familiarize yourself with following best practices to optimize the user experience. They reflect the basic findings of multiple usability tests across different scenarios and user groups.

  • Make a conscious decision on the number of cards: Show only cards that really support the specific role context or task.
  • Accentuate the most important information: Semantic colors in texts, charts, attract more attention. The same applies to larger cards.
  • Offer a well-balanced mixture of card types: Diversity makes it easy to recognize, select, and read information.
  • Define a deliberate card order: Users assume that bigger cards and cards at the top of the page are more important than others.
  • Group similar topics: Users assume that related cards will be shown next to each other.
  • Choose easy-to-read and actionable texts: If the user needs to take action, use the active voice (for example “Reorder Soon” when stocks are running low).
  • Be semantically consistent: Users expect crucial terms like “Urgent” or “Out of Stock” to be highlighted with semantic colors.

Related Links

Units of Measurement

This article describes the rules for units of measurement.

Guidelines

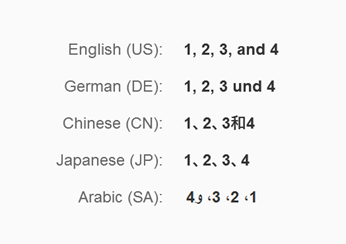
In general, use long text to display units of measurements, and do not use abbreviations, such as (ISO) codes.

Translate all units into the right language:

Developer Hint
Use the resource model provided by SAPUI5 to change properties based on the locale settings. (For example, to display “Stück” instead of “Pieces” when the application is used in Germany.)

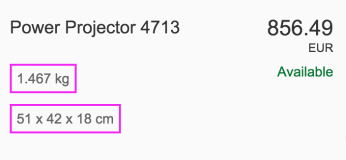
Use short text for common units like currency, weight, and length.

Format the numbers according to the rules of the corresponding control:

Do
Use long text to display units
Don't
Do not use abbreviations for uncommon units

Object Number

Use the object number control where technically possible as it offers a small font for displaying the unit. It also allows the numbers to be displayed in bold, for example, to highlight values on a table row.

Price per Quantity

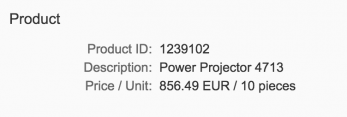
If you want to show a price alongside the corresponding quantity in one string, use “/” instead of text. This makes translation easier.

Do
Use a slash (/) for hyphenations
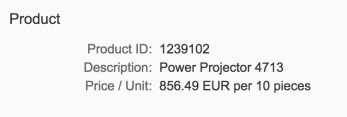
Don't
Do not use long text

Resources

Want to dive deeper? Follow the links below to find out more about related controls, the SAPUI5 implementation, and the visual design.

Elements and Controls

Implementation

Table Overview

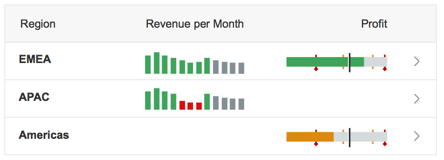
A table contains a set of line items, each displayed as a row that’s divided into columns. Line items can contain data of any kind, but also interactive controls, for example, for editing the data, navigating, or triggering actions relating to the line item.

To display data in tabular form, several table controls are provided. They belong to two groups that each share a consistent feature set:

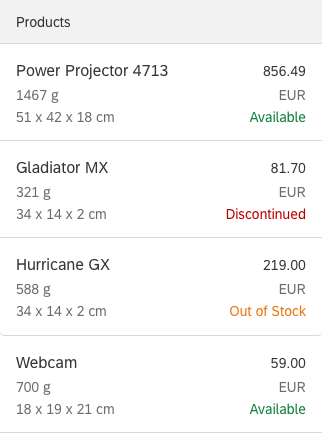
  • Fully responsive tables are the responsive table, list, and tree.

Use responsive tables to display a moderate amount of data. They can handle moderate amounts of data when the data is of average complexity, for example 200 items. They can handle more items when the data is less complex and fewer when the data is more complex.

  • Desktop-centric tables are the analytical table, grid table, and tree table. They are optimized for handling a large data sets, but not fully responsive.

Usage

Use the responsive table if:

  • You need a table to display a moderate amount of data. When your data is of average complexity, the responsive table can handle up to 200 items. However, more complex data lowers the limit, and less complex data raises it. Note that the limit is not on the number of items in the database or in the filtered results, but the volume of data loaded at any point. Factors that influence the exact limit include:
    • The number of loaded rows in the table
    • The number of displayed columns
    • The complexity of the cell content (for example, simple text vs. complex charts)
    • Other elements on the page (for example, multiple pages in a flexible column layout, or several tables/elements with more complex rendering on the page)
    • The browser used
  • The table content should be flexible and visually appealing. The responsive table offers the most flexibility for its content because all SAPUI5 controls, and even multiple controls, can be used. In addition, different rows can be based on different item templates.
  • The users focus on line items, not on individual cells.
  • A main use case involves selecting one or more items, and users need details to select them correctly.
  • Line items are independent of each other and no operation across columns is needed.
  • You want to have only one implementation for all devices. Make sure you adapt the responsive table design to offer the best solution for mobile devices.

For more information, see the responsive table control.

Use the list if:

  • You want to display a simple dataset.
  • A table would be too complex.
  • A list of actions is to be displayed.
  • Simple two-level hierarchies are required (by using grouping or navigation).
  • The main use case involves selecting one of several items based on only a few details.
  • You require a list for a list-detail scenario using the flexible column layout.

For more information, see the list control.

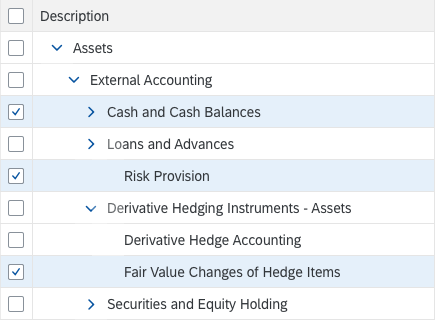
Use the tree if:

  • You want to display a simple hierarchical dataset.
  • You want to use a hierarchical list for a list-detail scenario using the flexible column layout.
  • Using a tree table would be too complex.
  • The main use case involves selecting one of several hierarchical items based on only a few details.

For more information, see the tree control.

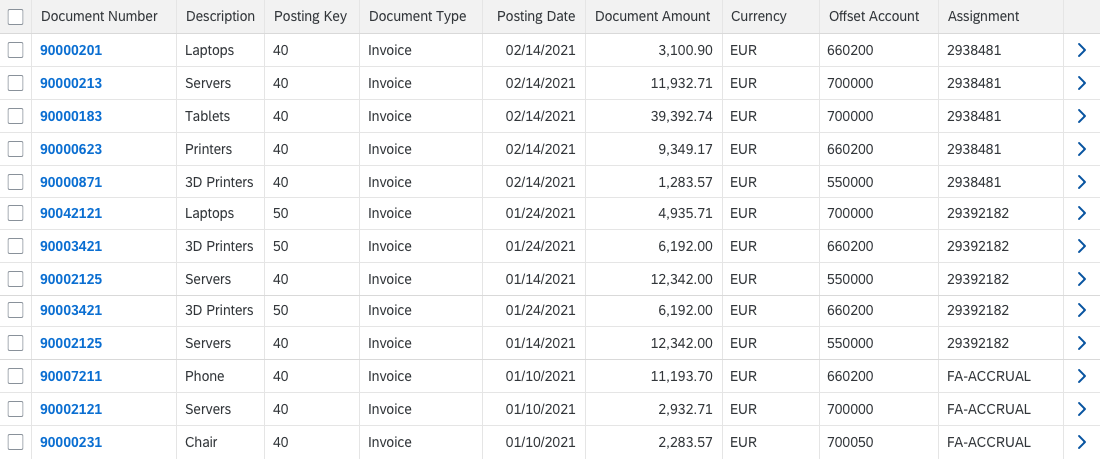
Use the grid table if:

  • You need a table to display a large amount of complex data. The grid table is optimized for scenarios that require large amounts of complex data to be loaded to the table. The number of items in the database or the filtered results are irrelevant.
  • The cell level and the spatial relationship between cells are more important than the line item, such as if users need to recognize patterns in the data, like in waterfall charts.
  • Comparing items is a major use case. The grid table layout remains stable irrespective of the screen width. In addition, a cell only ever contains one control.
  • The sequence of the items in the table is important.
  • Your use case is for tasks performed on desktop and tablet devices.

For more information, see the grid table.

Use the tree table if:

  • Data needs to be displayed in a hierarchical manner.

For more information see the tree table.

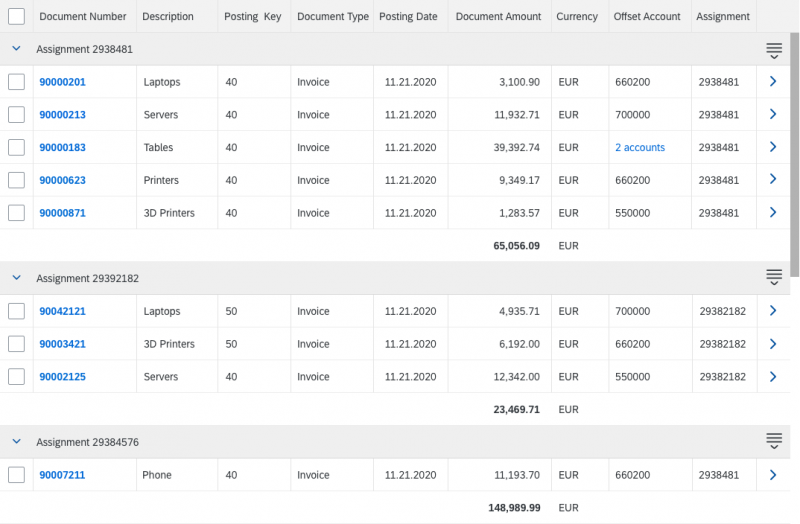
Use the analytical table if:

  • You need multilevel grouping as well as grand totals and subtotals.

For more information, see the analytical table.

Responsiveness

Fully Responsive Tables

The fully responsive tables adjust their appearance to the to the screen size so you can use it on all devices.

Make sure you design the best responsive table solution for the tasks performed on each device type. Sometimes, a solution without a table is more useful and useable for mobile devices.

Desktop-Centric Tables

The desktop-centric tables are not fully responsive, but available for only desktops and tablets, and they support touch interactions.

For mobile use cases, you need to:​

  • Create a new Fiori application with reduced complexity, not an exact match of the desktop application.
  • With the new application, address the most important use cases for users in a mobile context. The responsive controls (responsive tablelist or tree,) or a relevant control for your use case (for example a chart or the category navigation pattern) may suffice.

Types

Fully Responsive Tables

Guidelines
Always consider ways to reduce the amount of data loaded in the responsive table with, for example, filters, graphics, aggregation of information, and navigation.

Keep in mind that you should use the responsive table only to display moderate amounts of data, including factors like number of items and content complexity.

Responsive Table (sap.m.Table)

Based on the list, the responsive table provides:

  • An optimized view of a line item at a glance without any horizontal scrolling, regardless of the screen width.
  • Full flexibility for table content:
    • Any SAPUI5 control can be used in a cell, including micro charts and forms.
    • Using layout containers, such as a grid layout, allows more than one control to be used in a cell. Consequently, the cell shows more than one data point.
    • Templates with multiple rows are supported, so different items can have different layouts. For example, this can be used to show editable items and read-only items in the same table without switching modes. In this case, the editable items could have a completely different layout than the read-only items.
    • Items with different heights are supported. This allows for more dynamic content in cells, for example, to show lists or use text controls that wrap instead of truncate.
  • Smooth scrolling. This is done by rendering all items on the application background. Thus, the responsive table does not have its own scrollbar but uses the scrollbar for the whole page.
  • A very lightweight design.
  • Touch interaction support.
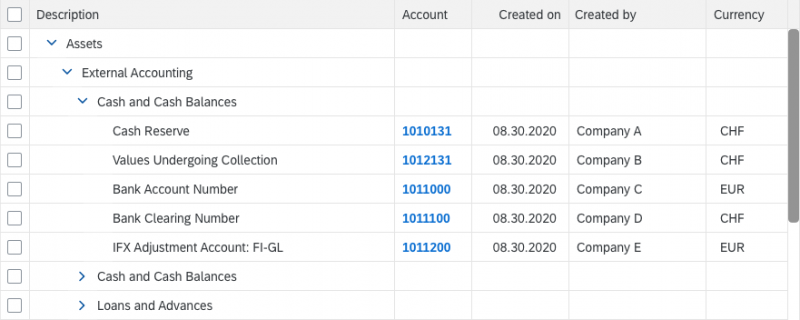
Responsive table
Responsive table

List (sap.m.List)

The list is the basis for the responsive table. It should be used whenever a table is too complex.

The list provides:

  • Full flexibility in regards to its content:
    • There are various specializations for specific list types.
    • With a custom list item, all SAPUI5 controls can be used inside a list. Using layout containers allows more than one control to be used in a custom list item.
    • Templates with multiple rows are supported, so different items can be shown in the same list.
    • Items with different heights are supported.
  • Smooth scrolling. This is done by rendering all items on the application background. Thus, the list doesn’t have its own scrollbar but uses the scrollbar for the entire page.
  • A very lean and lightweight design.
  • Touch interaction support.
List
List

Tree (sap.m.Tree)

The tree is based on the list. It should be used whenever a hierarchical view is needed, but a tree table is too complex.

The tree provides:

  • A standard tree item that provides an icon, a text (that wraps), and a counter.
  • Support for items with different heights.
  • Smooth scrolling. This is done by rendering all items on the application background. Thus, the tree doesn’t have its own scrollbar, but uses the scrollbar for the entire page.
  • A very lean and lightweight design.
  • Touch interaction support.
Tree
Tree

Desktop-Centric Tables

The following tables belong to the desktop-centric table group:

  • Grid table: This is the most basic table in this group.
  • Analytical table: This provides the following features on top of the grid table:
    • Grouping by several levels.
    • Automatic calculation of grand totals for a column and subtotals per group level.
  • Tree table: This provides a hierarchical view of the items.
The desktop-centric tables have the following limitations:

  • Content layout is less flexible:
    • The grid table supports only certain controls, mainly for displaying text or getting single-line text input from users. For example, you cannot add micro charts.
    • Only one control can be added per cell.
    • It supports only single-row templates.
    • All items need to have the same height.
  • Vertical scrolling is not smooth. For performance reasons, the content is not really scrolled but exchanged.

Grid Table (sap.ui.table.Table)

The grid table provides:

  • An optimized way to show large amounts of data. It supports an unlimited number of rows. It also supports a very condensed display of line items on non-touch devices, thus allowing more rows to be displayed on the same screen property.
  • Fixed control height, thus supporting horizontal and vertical scrolling (“viewport scrolling”). However, this also means that there are several vertical scrollbars on the screen for the page and table, which might be cumbersome on smaller screens.
  • Touch interaction supported.
Grid table
Grid table

Analytical Table (sap.ui.table.AnalyticalTable)

The analytical table is based on the grid table and is therefore quite similar to it.

In addition to the grid table, the analytical table provides:

  • Multilevel grouping
  • Display of grand totals per column and subtotals per group
Developer Hint
The analytical table needs analytical binding.
Analytical table
Analytical table

Tree (sap.m.Tree)

The tree table is based on the grid table and is therefore quite similar to it.

In addition to the grid table, the tree table provides:

  • One hierarchical column
Tree table
Tree table

Resources

Want to dive deeper? Follow the links below to find out more about related controls, the SAPUI5 implementation, and the visual design.

Elements and Controls

Implementation

Formatting Data – Overview

SAP Fiori applications are often used in an international context, and therefore need to be designed to adapt to different locales. Consistent rules for data formatting and characteristic data styles make the apps easy to work with, while enabling users to solve seamless workflows with cross-border processes and communication.

Types

Formatters can be applied to different types of data. SAPUI5 provides formatting capabilities to format dates, time, numbers, and comma-separated lists. It is also important to consider general formatting rules when displaying units of measurement.

Dates

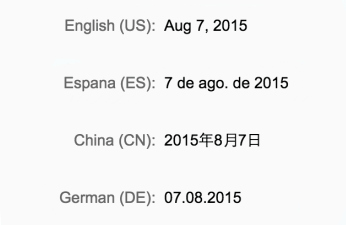
The SAPUI5 date formatter supports 5 different date formats based on international rules: short, medium, long, full, and relative.

For more information, see Formatting Dates.

Examples of date formatting

Times

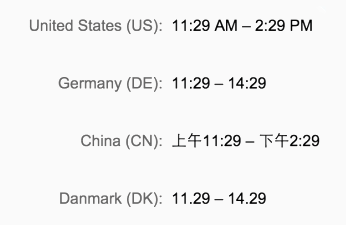
The time formatter supports 3 formats: short, medium, and long. The formatting depends on the locale defined in the browser settings.

For more information, see Formatting Time.

Examples of time formatting

Numbers

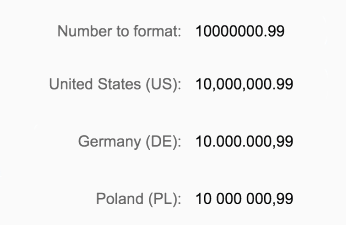
The number format depends on the data type (integer, float, currency, or percentage) and the relevant length (short, standard, or long).

For more information, see Formatting Numbers.

Examples of number formatting

Comma-Separated Lists

Comma-separated lists are typically used to show a series of values in a single line. The rendering of comma-separated lists depends on the locale.

Developer Hint
SAPUI5 provides a formatter for comma-separated lists.

Do not create comma-separated lists using hard-coded commas. The resulting format will be incorrect in some languages.

Comma-separated lists in different languages

Units of Measurement

The formatting for units of measurement depends on the type of unit, the language, and the respective control.

For more information, see Units of Measurement.

Examples of units of measurement

Resources

Want to dive deeper? Follow the links below to find out more about related controls, the SAPUI5 implementation, and the visual design.

Elements and Controls

Implementation

Handling Busy States

This article describes how to handle the busy state in SAP Fiori apps in general. You can set a busy indicator locally at control level (for example, on a page or for a button) using a busy state, or set it globally using the busy dialog. In SAP Fiori, the aim is to keep the blocking of UIs to a minimum, and to unblock areas where user interaction is possible. Because response time depends on available bandwidth and server performance, unblocking can take a second or more. In this case, we need to inform the user that the process is ongoing.

Usage

Busy indicators are used in the following areas:

  • Initial page loading
  • Dynamic fields and forms (asynchronous loading of fields based on user preselection)
  • Lazy loading of content, for example, in lists and tables
  • Searching and filtering, for example, lists, tables, and global searches
  • Primary actions such as Save, Update, and Delete
  • Deleting and updating lists or modifying tables
  • Partial loading of content

Setting the Busy State

The challenge here is to decide at what level and when the busy state needs to be set. The options are as follows:

  • Show the entire UI as busy (including SAP Fiori launchpad shell bar) using a busy dialog
  • Set a busy state at control level (for example, on a page or for a button)

To make the right decision, we first need to understand how a page or app is loaded.

The “Manage Products” example below uses a flexible column layout. We will also assume that the necessary data for labels, tables, and so on is loaded asynchronously, and that the mapping is done via binding.

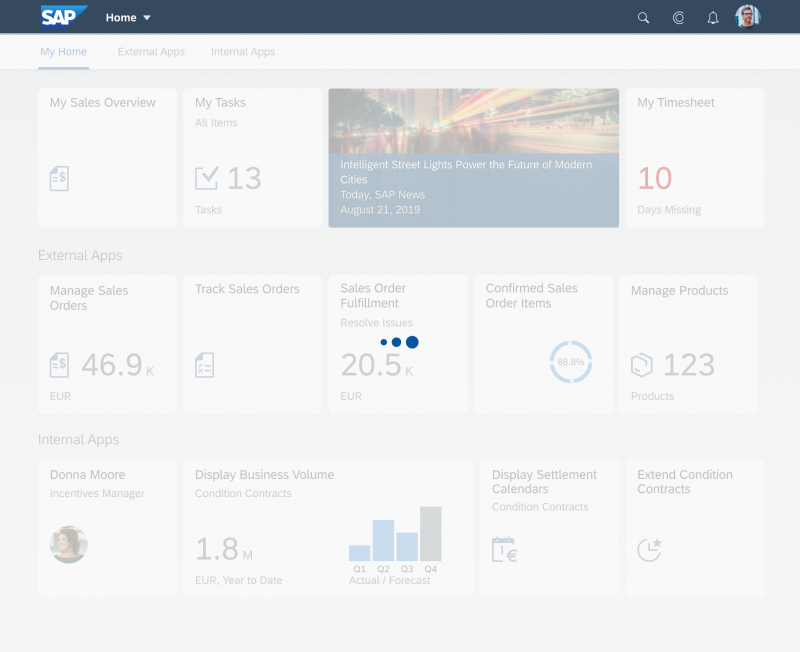
The app is launched from a tile on the home page. The busy indicator is shown until the initial application data is available.

Busy indicator to indicate busy state on the home page

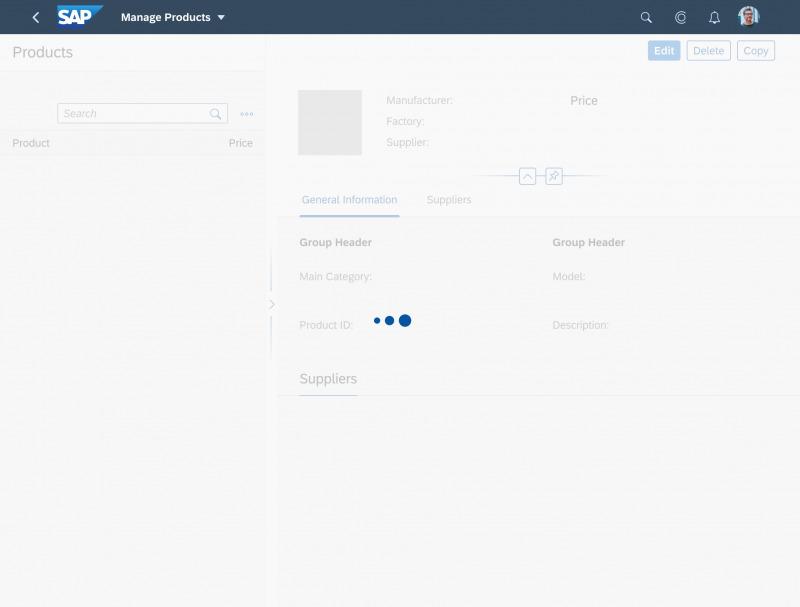
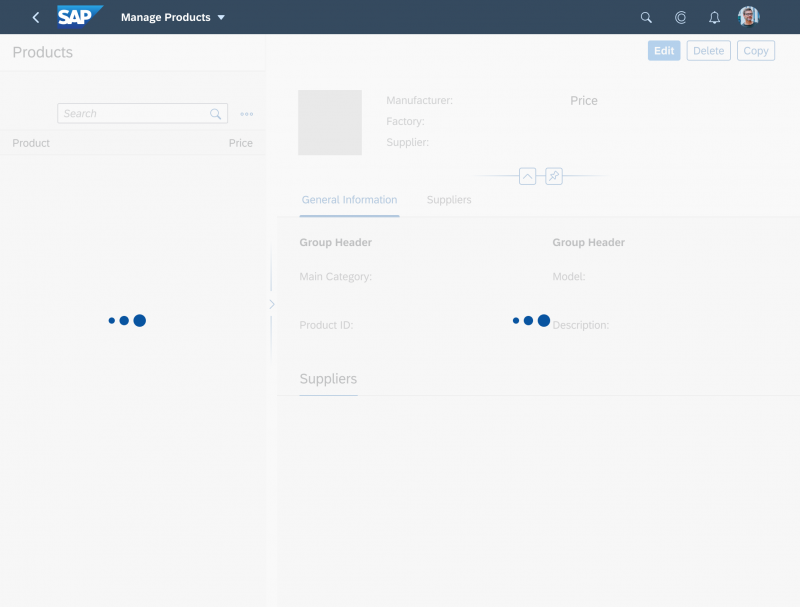
First, the UI description and metadata are loaded. This is the minimum for a basic functional UI. Until this data is available, the app UI needs to be blocked. In this case, we set the busy state from the flexible column layout control (sap.f.FlexibleColumnLayout).

Do not use the busy dialog to block the entire UI. Otherwise, this would also affect the shell bar, and the user would not be able to access shell features such as Sign Out or Search.

Busy state at app level

Once the metadata has been loaded, we can partially unblock the UI where it makes sense.

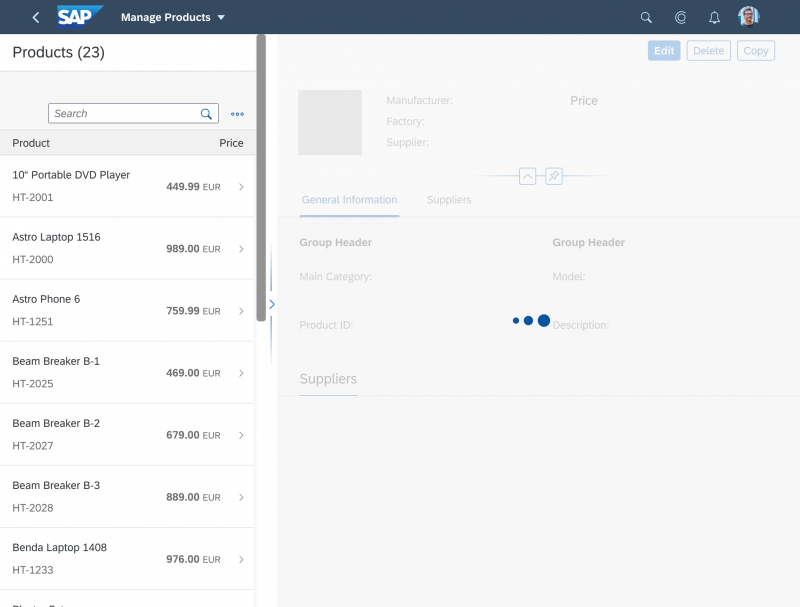
The busy state is set for the list column and the details area until the data has been loaded.

Separate busy states for list and detail areas

Once the data for the list area is available, the busy state is removed. Because the data for the details area is loaded asynchronously, its busy state is set separately.

List is visible, busy state for the details area

Guidelines

  • Only use the busy dialog if you do not want to allow the user to use the shell, for example, to navigate to the home page. In some cases, long-running processes require the user to be informed about the result in order to continue, for example, to a second step.
  • If multiple busy indicators overlap, the SAPUI5 framework ensures that only the one at the uppermost level is shown.

  • Do not use the busy dialog for app or page loading. Set the busy state at app level.

Resources

Want to dive deeper? Follow the links below to find out more about related controls, the SAPUI5 implementation, and the visual design.

Elements and Controls

Implementation