Recommendations

Intro

Intelligent systems can help users by recommending appropriate content or suggesting an action or input the user may “prefer”. In this case, we speak of a recommendation pattern and its impact on the UI.

In SAP Fiori, we differentiate between three types of recommendations: content recommendations, input assistance, and solution proposals.

Content recommendations - Structure
Input assistance - Structure
Solution proposals - Structure

Content Recommendations

The system filters the parts of the available content that may be interesting for the user, based on the user’s behavior or the content characteristics. Outside examples of typical “recommender” systems are Amazon or Netflix.

Input Assistance

The system assists the user by entering or filtering data. Typical examples might be a search phrase suggestion, an appropriate form template, or a set of suggested default values for certain fields, based on the user input and interaction history.

Solution Proposals

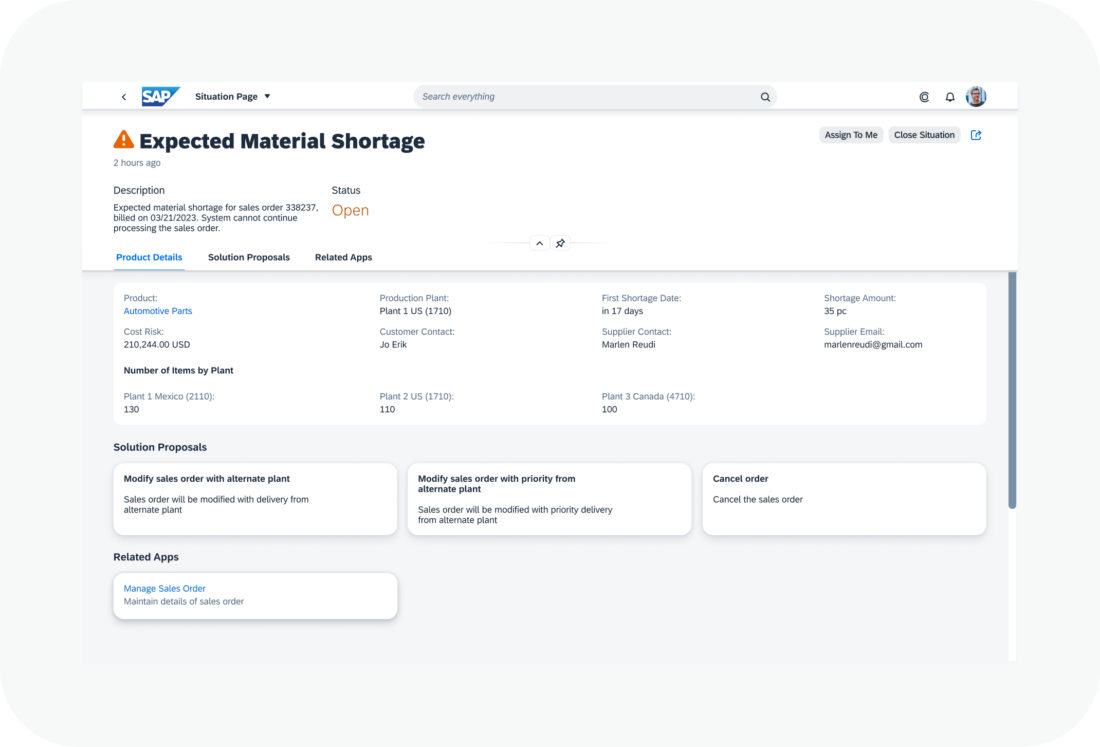
The system supports users working on complex problems by recommending specific actions or proposed solutions. In some use cases, this might be combined with a simulation of the possible outcome. Typically, solution proposals involve various decision support systems (DSS), which might also be integrated in a situation concept. Example use cases include payment and invoice matching, or material shortage scenarios.

Content Recommendations

Recommendation systems are intelligent services that provide a personalized and customer-centric experience. “Content” is any type of digital artifact (documents, files, links, videos, and so on). This can be internal content (such as a recommended training program or app) or third-party content (such as a market analysis or product video from an integrated provider).  Content is recommended to users according to their current needs and context.

Information
Note that you can only offer third-party content if the systems are integrated. Otherwise, the AI algorithm cannot assess the relevance of the content.

Visualization

The representation and placement of personalized content depends on the following factors:

  • Criticality: How important is the content? Do users need it to make key decisions around their primary goals?
  • Relevance: Where in the application or process does the content provide the most value?
  • Purpose: What can users do or achieve with the given content?
  • Value added: What can users achieve with the content that wouldn’t be possible without it?

Content recommendations are very individual and depend strongly on the use case. You can utilize all the controls offered by SAP Fiori to present the required content in the best way possible. However, you must ensure that the content adds value and is explained appropriately.

Guidelines
If your content recommendation supports a high-stakes decision, ensure that users:

  • Are fully aware that their actions are critical.
  • Are informed about the nature and quality of your content proposals.
  • Have a basic understanding of how recommendations have been computed.
  • Fully understand the consequences of their decisions.
  • Have the option to reverse their actions in case of human error.

For more information, see Explainable AI.

Design Rationale
Highstakes decisions are more common in a professional software environment than in everyday consumer apps, where the consequences of an action are usually easy to anticipate and revert.

While the implications of recommending unsuitable educational content to an employee are likely to be minimal, recommendations around critical business decisions can potentially cause irreversible damage (for example, recommending an unreliable supplier or business partner, leading to the failure or premature termination of a project or contract).

It’s therefore vital to enable users to take an informed decision.

Input Assistance

System recommendations for the user input can be provided on two levels:

  • Form level: A recommendation for the complete form (“form variant”).
  • Form element level: A recommendation for a single form element.

In both cases, we need to design the following micro interactions:

  • Detect: As a user, I need to see which values were suggested by the system.
  • Explain: As a user, I want to understand the reasoning behind the system recommendation.
  • Compare: As a user, I need to be able to compare existing human input with the system recommendation.
  • Act: As user, I want to accept or reject system recommendations.

“Human First” Principle

Human input always wins against machine input.

The following rules can be derived from this principle:

  • The system can prefill empty fields with recommendations.
  • A user’s input cannot be overwritten by a system recommendation without the user’s approval.
  • Active approval of the system recommendation by the user turns it into user input.

Assistance at Field Level

We plan to extend the concept of form validation to design for the interaction rules listed above.

Warning
The explanation and comparison micro interactions are still under investigation. Some aspects of the design shown below may differ from the final design.
Different constellations of human input and system recommendations

Detection

Use the “information” value state (blue color) to highlight the fields with proposals from the system.

Comparison

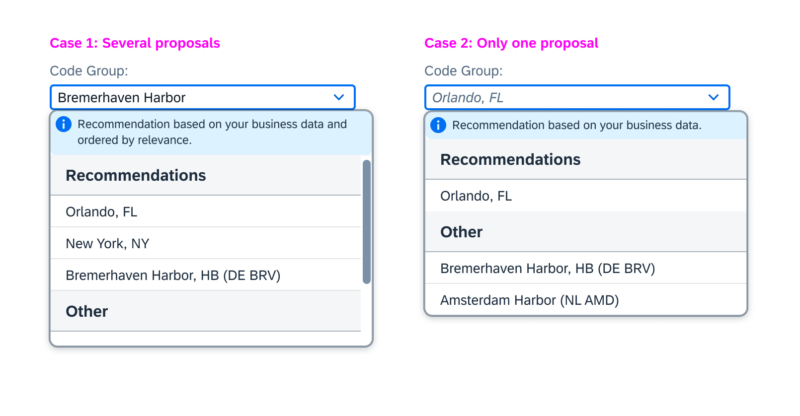
For input and multi-input fields, you can use autocomplete suggestions to display the alternatives recommended by the system, which are shown on focus.

Input Assistance

Action: Approve or Reject

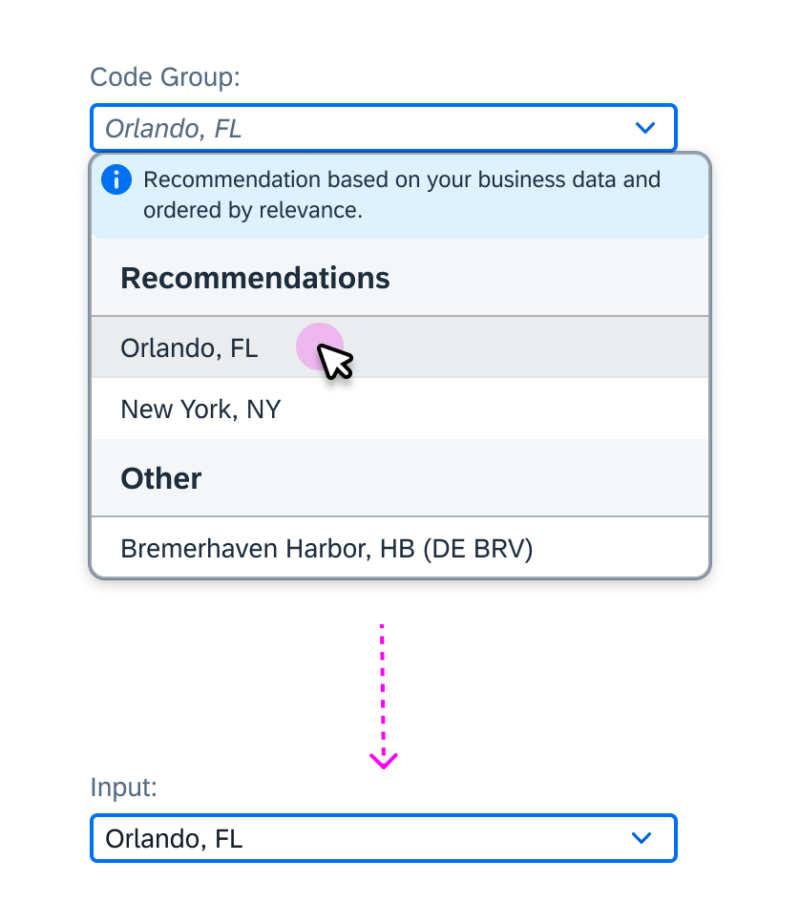
Users can accept the system recommendation in two ways:

  • Implicitly, by submitting the whole form.
  • Explicitly, by selecting an alternative in case of conflict.

Users can explicitly reject a system recommendation by starting to edit it in the input field.

Explicit acceptance of a system recommendation

General Guidelines / Open Issues:

  • Explanations: You may need to explain system recommendations in more detail. Check the guiding principles for explanations to determine your own scope.
  • Assistance at form level: In the first iteration, input assistance at field level does not support multiple recommendations.
  • Edge cases: The current concept covers the use cases that are based on direct input controls (input and multi-input). We plan to explore input assistance for other controls (such as radio buttons, checkboxes, or sliders) in the next iteration, depending on emerging use case requirements.

Solution Proposals

In most of the use cases, the solutions are presented as a list of recommendation items, which are grouped in a recommendation block.

Recommendation Item

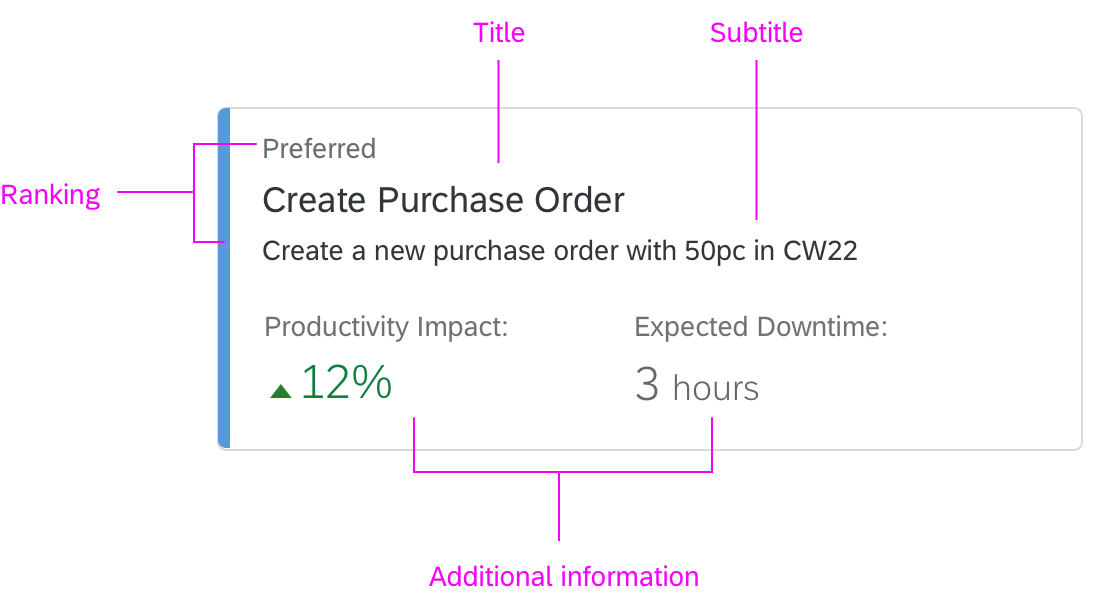
As a minimum, a recommendation item must have a meaningful title that links to an action. Depending on the use case, you can expand the presentation of your recommendation by using custom variant of the list Item control. The example below shows the anatomy of the most complex case with all optional elements.

Recommendation item anatomy

Title and description: Give the recommendation a short and meaningful title that describes the proposed action. You can expose more information by using an additional description. Longer texts can be truncated after the second line, but we recommend avoiding truncation altogether. If you do opt to use truncation, offer a More Info button for showing the rest of the text.

Action: To apply a recommendation, the user executes an associated action. Depending on the form of the recommendation item, the action can be triggered by clicking the entire list item, or by clicking a dedicated button.

Selection: Depending on the use case, users might need to see a preview of the results first. In this case, the triggers for the “preview” and “final action” must be separated.

Preferred proposal:  Depending on your use case, you can highlight a recommendation item as a preferred proposal. For details, see Ranked recommendations in the Recommendation Block section below.

Recommendation Block

Several recommendation items form a recommendation block. The example below shows the anatomy of a horizontal recommendation block based on a grid list.

Recommendation block anatomy

Recommendation block header: The block toolbar contains a meaningful and short block title, which describes the set of proposed solutions. It can also offer additional functionality that applies to the whole recommendation block, such as an additional explanation of the model behind the recommendations, or an option to provide explicit user feedback to reinforce the underlying model.

Recommendation block items: Recommendation items are the main content of the recommendation block. Depending on the use case and space constraints they can be organized horizontally, vertically, or as a grid.

Ranked recommendations: You can highlight the first item of the recommendation block to indicate the preferred proposal. We recommend highlighting only one (the preferred) item in the list, and placing it at the top. You can use the semantic colors for highlighting if this is required by your use case.

Guidelines

  • Explanation: Provide the user with at least with a basic explanation of how the recommendations are generated (for example, “App recommendations based on your interactions during the last week”). Ideally, the system should be able to explain each recommendation.
  • Feedback: Give users an option to provide explicit feedback for each recommendation. In addition, you should gather implicit feedback (signals) from the user. Think about all the possible signals and their relevance (importance) upfront during the UI design.
  • Fallback scenario: Define the system behavior for cases where recommendations are missing or “less relevant”. Think about what is better for your users: to see a non-relevant recommendation or to see nothing. In most cases, silence is golden. Design your UI in a way that allows you to hide the recommendation block if there are no recommendations. Users should still be able to accomplish the task manually, or at least be informed about possible workarounds.
  • Ranking recommendations: Depending on your use case, you may want to rank one or all recommendations. Explain the ranking logic to the user. Use list item highlighting and text labels for ranking. Avoid showing scoring explicitly unless it is relevant for the user decision.
  • Less is more: Do not recommend because you can. Recommend only what makes sense.

Related Links

Treemap Chart

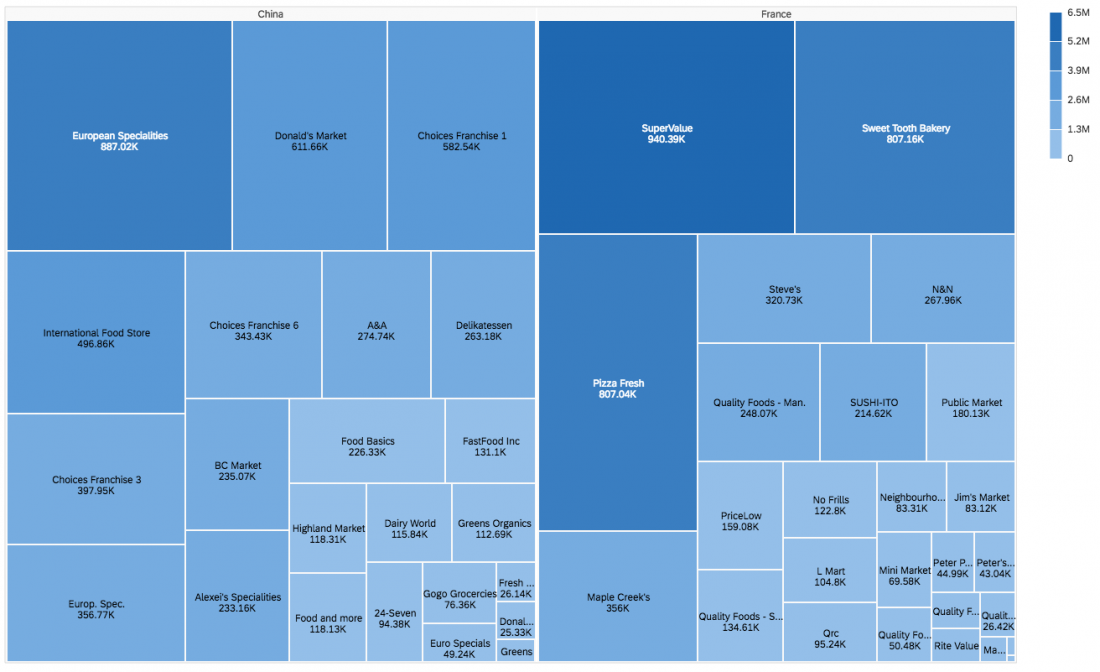
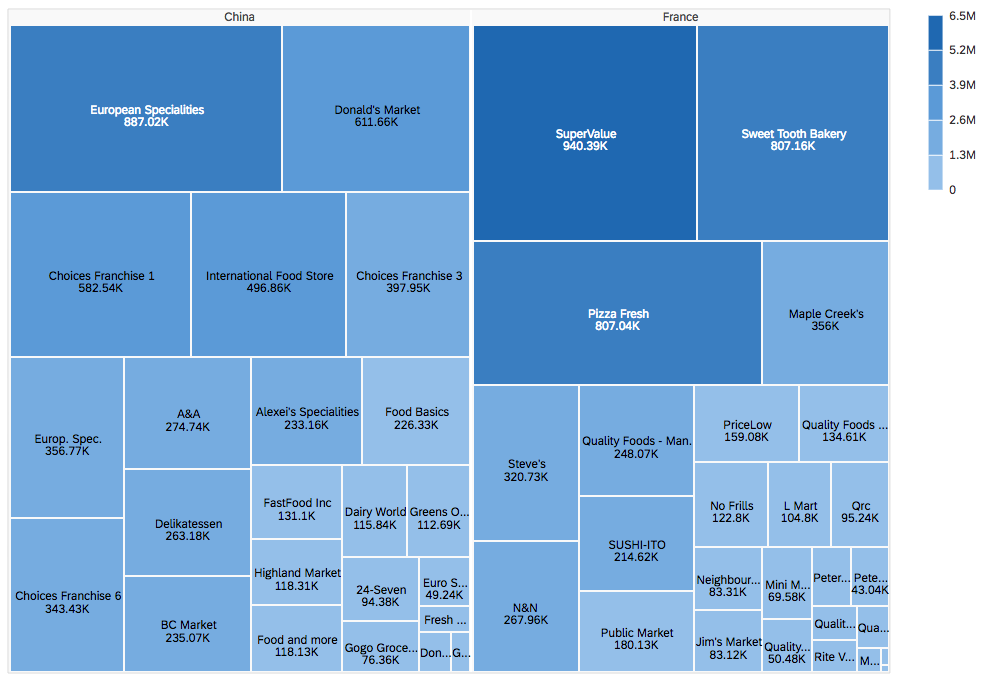
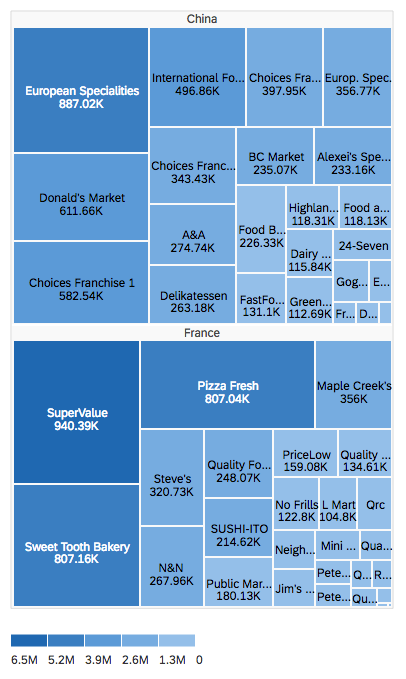
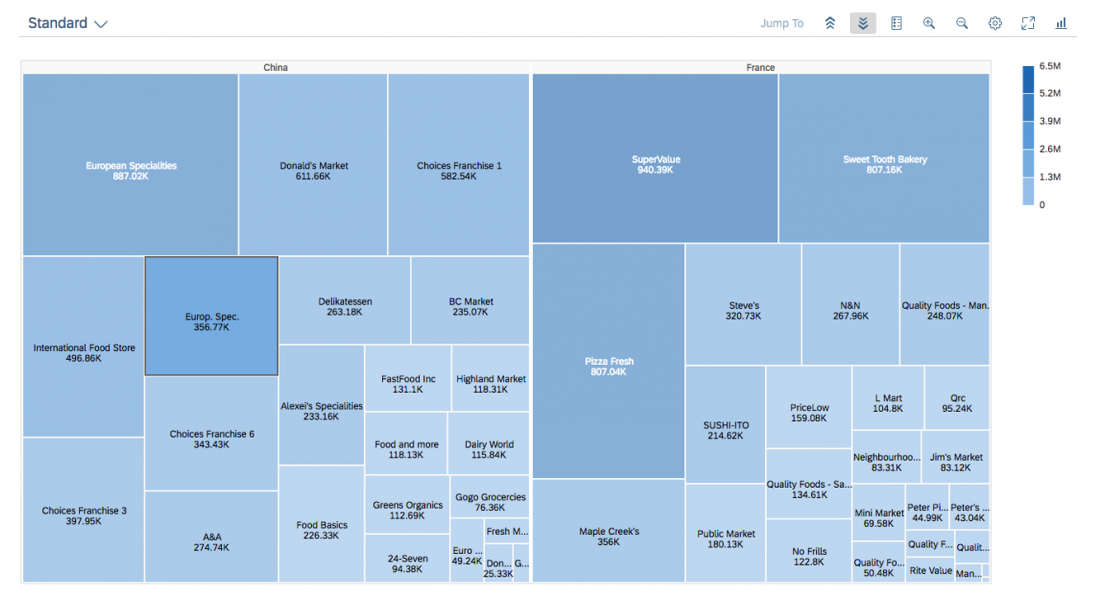
Treemaps are used to display hierarchical data. The information is displayed as a cluster of rectangles varying in size and color, depending on their data value. The size of each rectangle represents a quantity, while the color can represent a number value or a category. Treemaps are economical in that they can be used within a limited space and yet display a large number of items simultaneously. Treemaps allow you to view trends and make comparisons quickly.

Treemap chart
Treemap chart

Usage

Treemaps are one of the most compact and space-efficient options for displaying hierarchies and are also great for comparing the proportions between categories via their size. When there is a correlation between color and size in the tree structure, the user is able to see patterns that would be difficult to spot in other charts.

Use the treemap if:

  • Space is limited and you want to give users an overview of a large amount of hierarchical data.
  • You cannot use conventional graphs, such as bar charts, because there are too many items to represent as bars in a single graph or in a series of graphs on one screen.
  • You want to offer a quick, high level summary of the similarities and anomalies within one category, as well as between multiple categories.
  • You want to enable part-to-whole comparisons.
  • You want to enable rough comparisons between top-level categories, as well as comparisons within categories at a lower level.

Do not use the treemap if:

  • You want to enable precise quantitative comparisons. In this case, use the bar chart instead.
  • The dataset contains only a small number of categories. In this case, we recommend using the bar chart.
  • There is a big difference in the magnitude of the measure values.
  • You would like to display negative values. They cannot be displayed in treemaps.

Responsiveness

The treemap chart is fully responsive. When the size of the screen gets smaller, the labels start to truncate and hide if there is not enough space.

Treemap chart - Size L
Treemap chart - Size M
Treemap chart - Size S

Color Palette

The treemap chart supports sequential and semantic color palettes.

Legend

The treemap chart supports both the legend and value-based legend.

  • Use the legend if you are using semantic colors.
  • Use the value-based legend if you are using the sequential color palette.

Drilldown

You can let users drill down through the hierarchical data. This is done by selecting a rectangle and pressing the Drill Down button in the chart toolbar.

Drilldown in a treemap chart

Selection and Popover

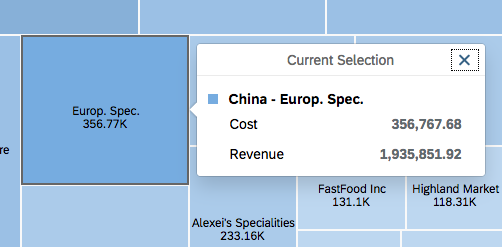
When the user clicks on a rectangle, all the associated values are displayed in a popover. You can also customize the popover to display other information and actions.

Resources

Want to dive deeper? Follow the links below to find out more about related controls, the SAPUI5 implementation, and the visual design.

Elements and Controls

Implementation

Chart – Range Selector

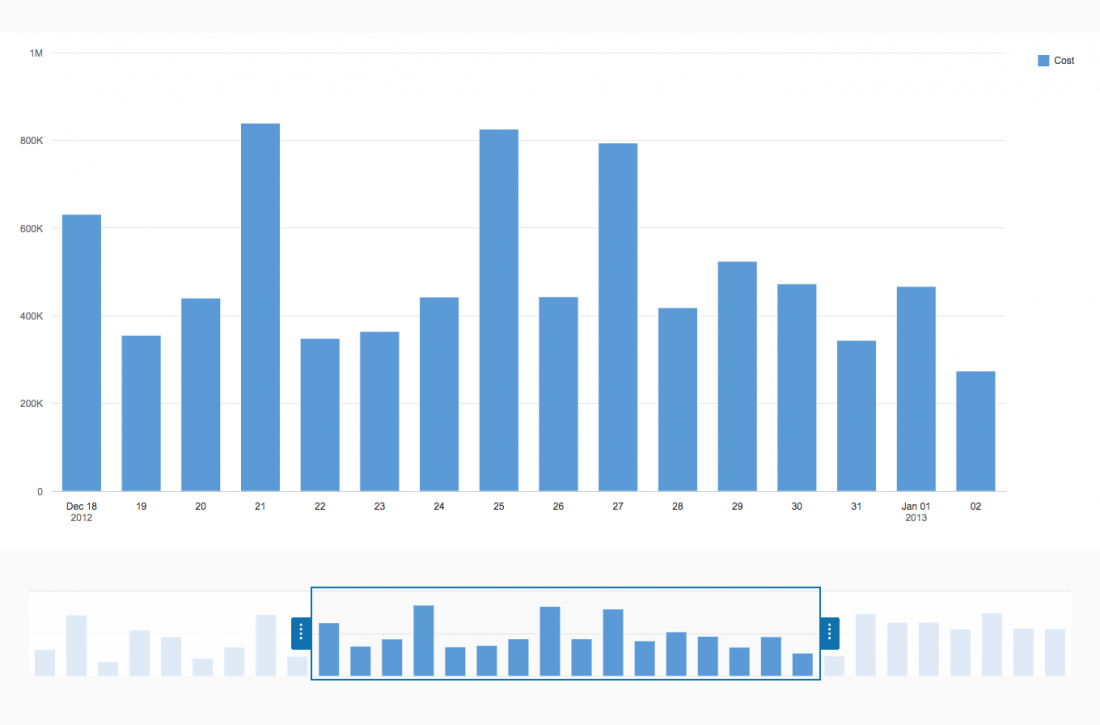
The range selector is a user interface control that enables the user to select a range of data points in a dataset. The control gives a visual preview of the dataset in the form of a chart.

Range selector with column chart

Usage

Use the range selector if:

  • You have a large dataset and want to focus on a certain range of data points.
  • The dataset is combined with a chart above (preferable).
  • You intend to use the same chart visualization in the control and above it.
  • You are using a column chart or line chart.

Do not use the range selector if:

  • It is for decoration only.
  • You have a small dataset.
  • You intend to use different chart visualizations in the control and above it.
  • You want to use the range selector instead of a chart.
  • You are using chart types other than a column chart or line chart.

Responsiveness

The range selector is responsive. The layout of the control is identical on both desktop and mobile devices. On a mobile device, the range selector has a maximum height of 7.5 rem.

Size S
Size S
Size M
Size M
Size L
Size L

Behavior and Interaction

Changing Values

The user can change the range in two ways:

  • By using drag and drop to adjust the grips.
  • By clicking the bar outside the selected range. The corresponding grip then moves to the new position.

Moving the Entire Range

Users can move the entire selected range by dragging it. When you hover over the selected range, the cursor changes to indicate that the range can be dragged.

Positioning and Overlapping

The grips of the range selector cannot be positioned on the same value. The grips cannot overlap.

Properties

  • You can use the vizType property to choose the type of chart that will be displayed in the range selector. The supported charts are column chart and line chart.
  • You can use the width and height properties to set the size of the range selector. On a mobile device, the range selector has a maximum height of 7.5 rem.
  • You can use the valueAxisVisible property to show or hide the value axis.
  • You can use showStartEndLabel to set a start and end label for the range selector.

Resources

Want to dive deeper? Follow the links below to find out more about related controls, the SAPUI5 implementation, and the visual design.

Elements and Controls

Implementation

Situation Handling

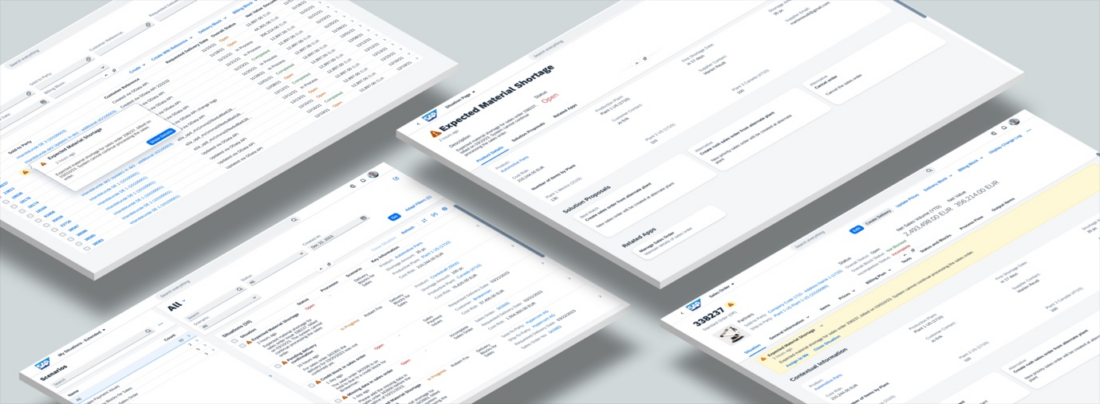
Situation Handling helps businesses run smoothly by automatically informing the right users about the issues that require their attention, for example, consumed contracts, pending confirmations and approvals, deviating deliveries, and upcoming deadlines.

Users can see situations displayed in business apps and in an app dedicated to situations. They can also be informed by notifications on SAP Fiori launchpad or by email.

Situation Handling notifies the right users of issues that require their attention

Situation Handling is available for SAP S/4HANA and SAP S/4HANA Cloud. In addition to informing users about issues, Situation Handling also monitors how the situations are addressed. The collected context data can be exported to Intelligent Situation Automation on SAP BTP, which has advanced analytics capabilities and enables the automatic resolution of situations.

Situation Handling consists of the following:

  • The standard framework that provides situation cases that you can use out of the box.
  • The extended framework that enables you to both create your own situation cases and benefit from predefined situation cases.

When to Use

Do

Use Situation Handling if:

  • You want to bring exceptional circumstances to the attention of the right user.
  • The business issue is not part of an application.
  • The business issue is not part of a standard business process.
  • You want to support users with contextual information and solution proposals.
Don't

Don’t use Situation Handling if:

  • You just want to send notifications.
  • Your issue is compliance relevant.
  • Something is, or should be, a standard feature of your application.
  • The issue is based on a standard business process and is unexceptional.

Components for Progressive Disclosure

Situation Handling comes with multiple components for the UX pattern of progressive disclosure. It improves usability by delivering users information and capabilities, gradually: Initially, users see the appropriate situation component displayed according to where they are on the interface. They can seek additional levels of detail about the situation according to their needs and goals.

Situation Indicator

The minimum display is the situation indicator (XS).

Situation indicator
Situation indicator

Description of a Situation

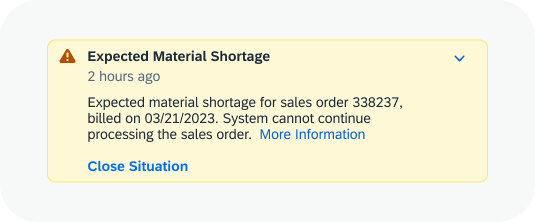
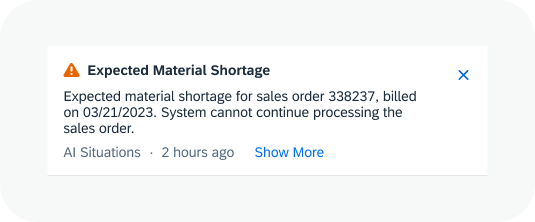
The short description of a situation (S) is used, for instance, for list items or for the situation message strip embedded in business apps.

It must include:

  • Situation title
  • Date of occurrence
  • Situation description

Examples

  • Situation message strip
  • Situation notification

Situation Preview

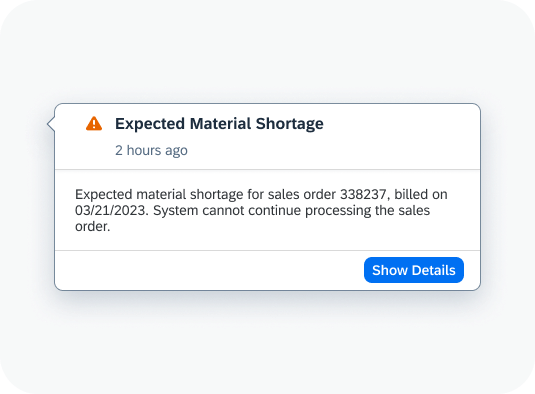
The situtation preview (M) is used, for example, when selecting a situation indicator.

It includes:

  • Description of a situation
  • Navigation to detail view

Examples

  • Situation card
  • Situation preview

Situation Detail View

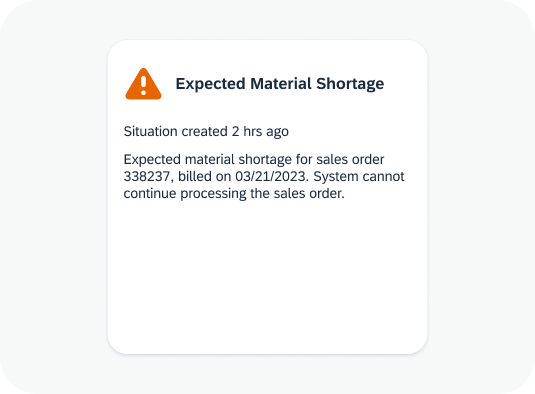
The situation detail view (L) is displayed on the situation page in the Situations app or on an object page of a business app.

This view contains a brief description and contextual information that helps the user make an educated decision. It also includes either actions to resolve the situation or navigation options to related applications, or both actions and navigation options.

Examples

  • Situation page
  • Object page section

Texts for the User

Describe the situation to the users in a way that supports them in understanding and resolving the issue. For guidance, see: Situation Handling Framework – UI Text Guidelines.

Situation Proposals

Where possible, offer concrete actions that can close a situation, such as Assign Contract and Reschedule Purchase. If the solution is more complex, offer navigation options to related business apps.
Situation detail view
Information
For more information about the components and their use, see:

For best practices for informing users, see: Situation Handling Framework – UI Text Guidelines.

Behavior and Interaction

Situations are displayed in various locations in the SAP Fiori environment. The navigation adheres to the principle of progressive disclosure in a well-defined way.

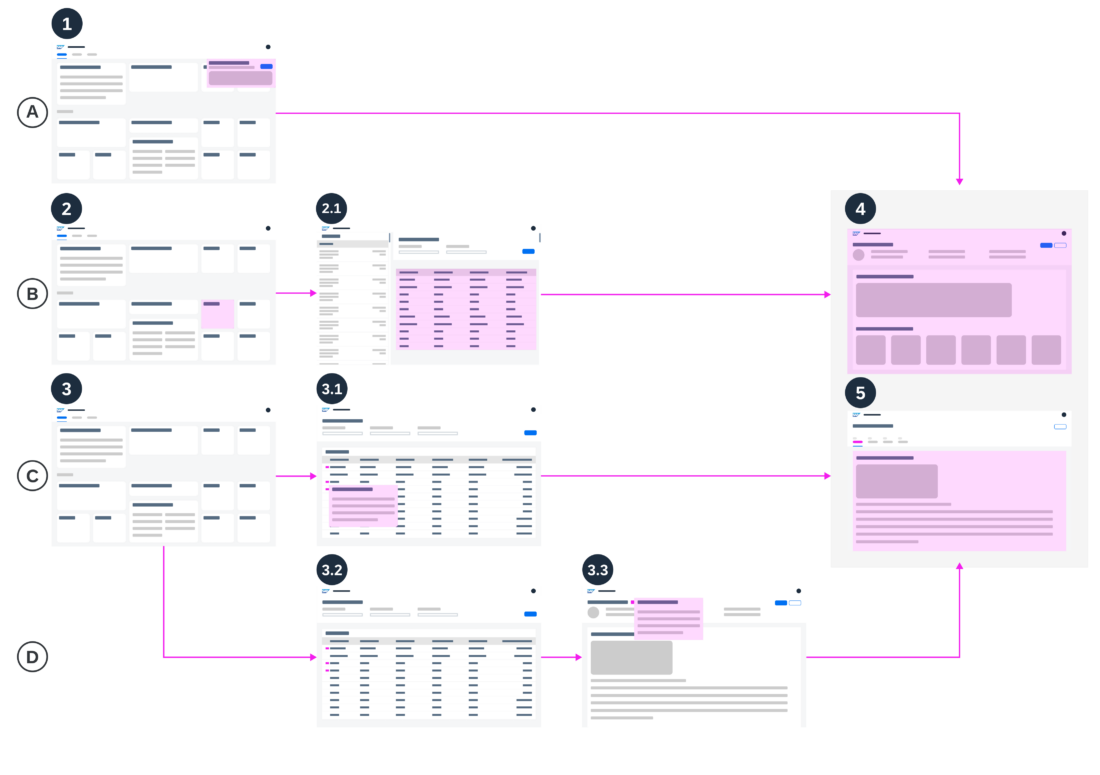
Navigation paths
Navigation paths

The navigation paths take various use scenarios into consideration. Here are some examples:

A. Navigation from a situation card or a notification

Users select a situation card on the My Home page or a notification on SAP Fiori launchpad (1) and navigate to the situation detail view. Depending on the configuration, this is the situation page in the My Situations – Extended app (4) or an object page in a business app (5).

B. Navigation from the Situations app

Users open the Situations app (2) and it displays the list of situations (2.1) in their area of responsibility. They select a situation to navigate to the situation detail view, (4) or (5) depending on the configuration.

C. Navigation from the situation indicator displayed with a list item in a business app

In a business app (3), users choose the interactive situation indicator next to a list item and a popover displays the situation preview (3.1). They select Show Details to navigate to the situation detail view, (4) or (5) depending on the configuration.

D. Navigation from the situation indicator in the header of a business app

In a business app, on an object page, users select the interactive situation indicator (3.2) after the object page title and a popover displays the situation preview (3.3). They select Show Details to navigate to the situation detail view, (4) or (5) depending on the configuration.

Top Tips

  • Situation granularity: Situation Handling is designed to support users in exceptional circumstances. Limit the number of situations per user so that users can focus on their daily business.
  • Texts for the user: Describe the situation to the users in a way that supports them in understanding and resolving the issue. Get guidance with the Fiori UI Text Guidelines. (for more information, see)
  • Use of notifications: Use notifications with care and avoid overwhelming users. Restrict notifications to urgent and important issues. Also consider aggregating notifications where possible.
  • Solution proposals: Where possible, offer concrete actions that can close a situation (such as Assign Contract and Reschedule Purchase). If the solution is more complex, offer navigation options to related business apps.

Related Links

Overview Page – Stack Card | Quick View Card

Take Action on the Overview Page 

As well as giving users access to content from multiple applications using different visualizations, the overview page can also let users take immediate action. This is supported by a special interaction pattern with a set of closely-integrated card types: the stack card, object stream, and quick view card. These three card types are only ever used together, and navigation between them has been optimized to best support user needs.

A stack card is a collection of quick view cards, which provide a footer area with actions. These quick view cards are displayed in the object stream (overlay). The advantage of using stack cards is that users don’t have to leave the overview page, and therefore don’t lost their focus.

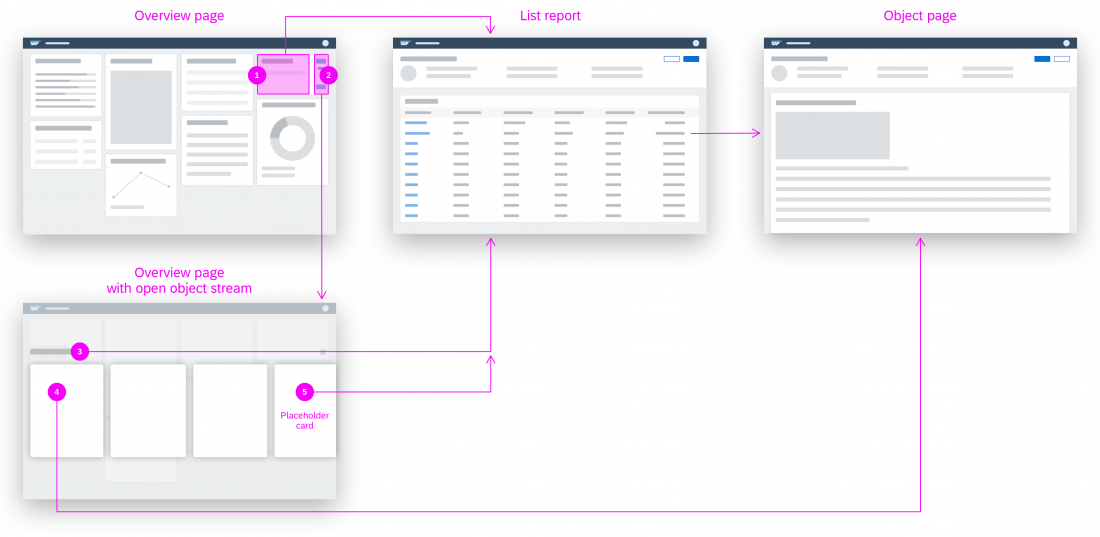
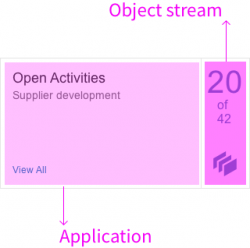
Overview page – Navigation overview of stack card, object stream, and quick view card

Explanation:

  1. Stack card (left side): Opens the parent application (such as a list report with all approvals).
  2. Stack card (right side): Opens the object stream.
  3. Heading of the object stream: A link that navigates to the parent application (such as a list report with all approvals).
  4. Single quick view cards within the object stream: Offer navigation to the object details (such as an object page with the selected approval), as well as actions.
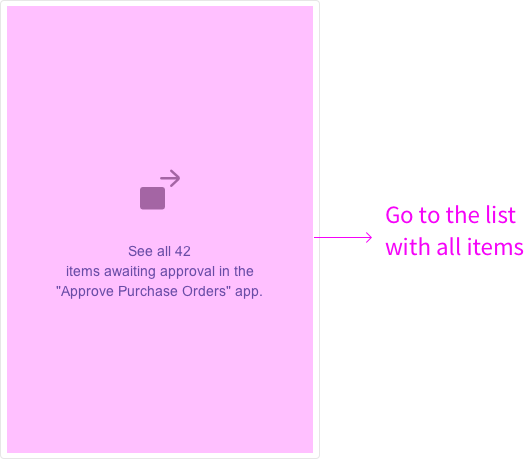
  5. Placeholder card: The last card a one-click area and navigates directly to the parent application (such as a list report with all approvals).

Stack Card

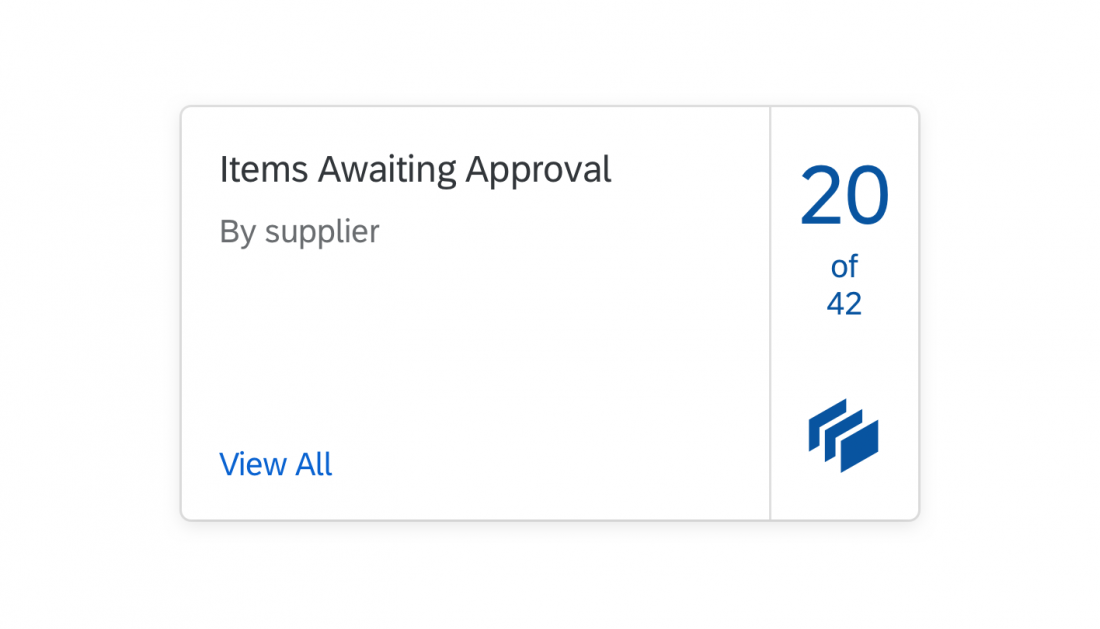
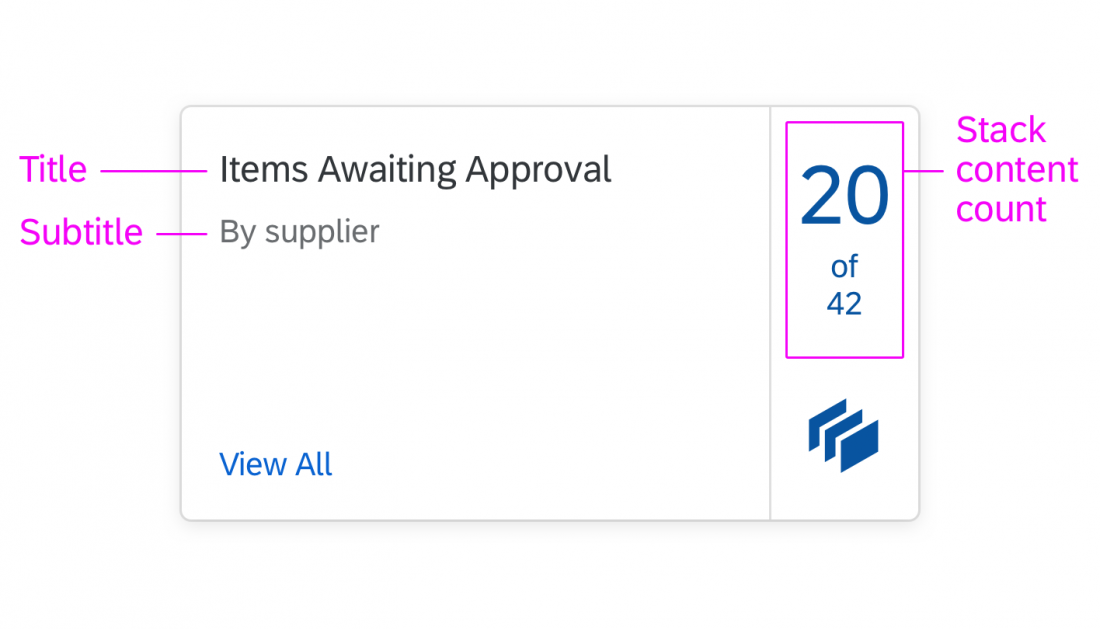
A stack card is a special collection of single-object quick view cards, based on a topic or action. Unlike the other card types, the top-level stack cards don’t show any application content. Instead, they act as an entry point to an object stream containing multiple cards.

Stack cards have the following components:

  • The title is the top element and is always required. It is used as the heading for the detail view, and comprises 1-2 lines of text.
  • The subtitle is optional. You can use it to qualify the title, offer an explanation, or show a status. The purpose of the subtitle is explain the content of the stack in one line, so its usage depends on the context.
  • The stack content count indicates the number of cards in the stack (object stream). The object stream can contain up to 20 cards. Below the number of cards in the stack, you see the total number of items returned for the annotated view (for example, “20 of 42”).

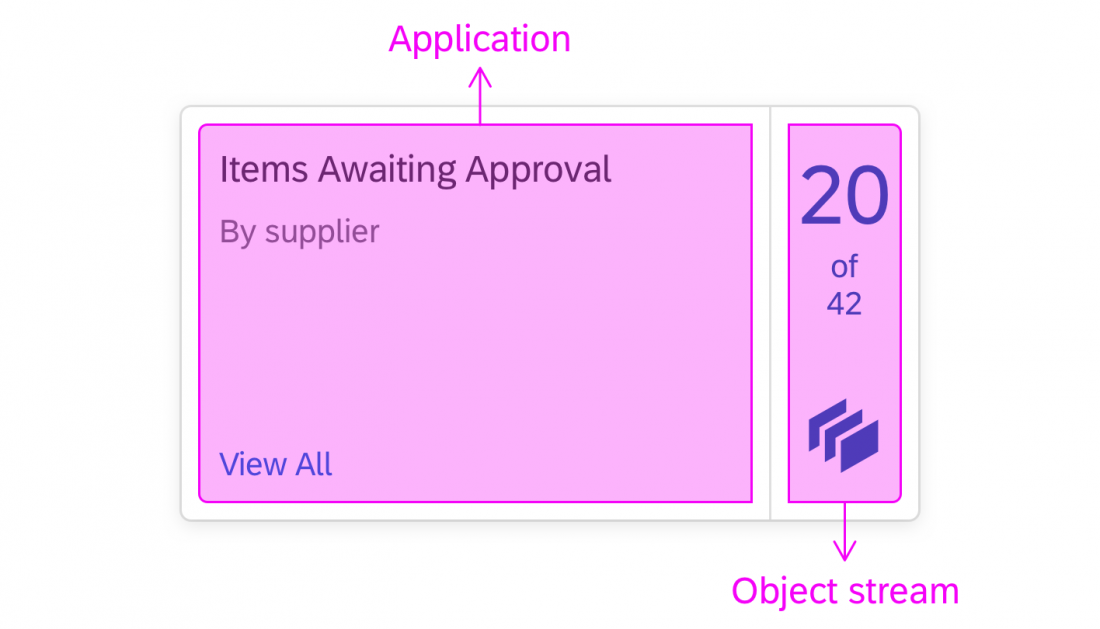
The top-level stack card contains two clickable navigation areas:

  • The left area and View All link navigate to the parent application, where the user can see all the objects returned for the annotated view (42 in the example above). The placeholder card and heading inside the object stream have the same navigation target.
  • The right area opens the object stream, which contains a scrollable collection of cards presented in an overlay format. The user can browse individual cards, with the option to view, inspect, or take action.

Object Stream

Overview page – Object stream

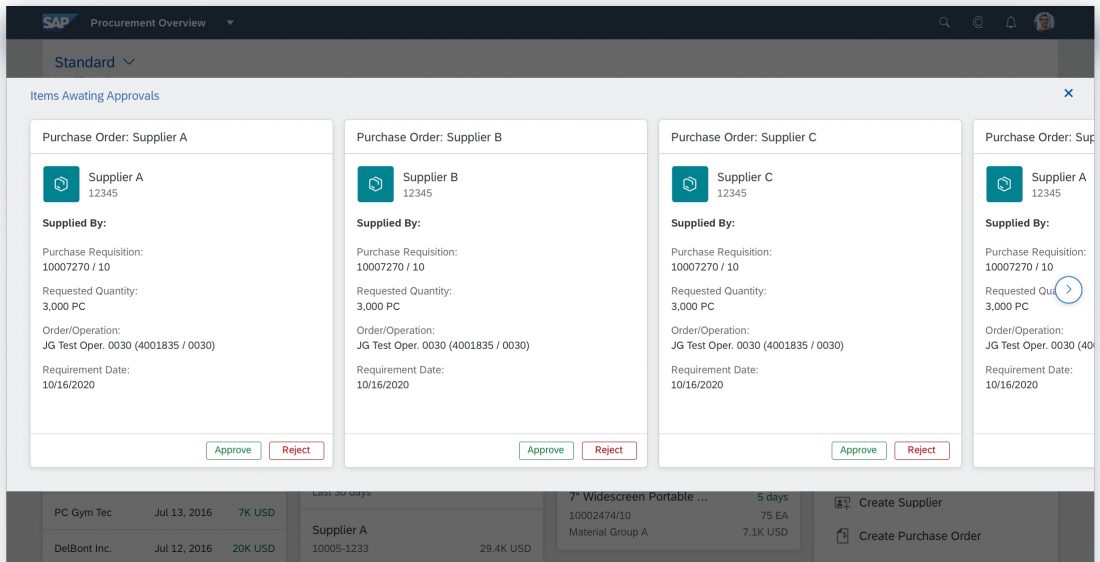
Clicking the right-hand area of the stack card opens the object stream. The object stream appears on top of the overview page as a modeless overlay, and serves as a layer for showing quick view cards with actions. The overlay has heading on the top left, and a Close button on the right. The heading is the same as the stack card title, and links to the full result set in the parent application (same target as the left-side navigation on the stack card and the navigation from the placeholder card). Clicking outside the overlay area also closes the object stream.

The object stream can have up to 20 cards (maximum), which all get their content from the same parent application. By default, the cards are ordered chronologically, with the most recent items first. However, app developers can define the best object stream sorting option for their own needs and content. If the number of cards exceeds the available space in the overlay window, an arrow icon appears on the right for scrolling. Mobile device users can swipe to see more cards. If the object stream is empty, the stack link is not active and the overlay cannot be opened. The stack count number displays 0. If only one item is returned, the object stream contains just a single card.

The header area of the quick view cards in the object stream navigates to the detail view for that specific object in the parent application. The footer area of the quick view cards can also offer actions.

Object Stream – Scroll Arrows

Scroll arrows only appear on desktop devices. If all the cards in the object stream fit on the screen, the arrows are not visible. If the number of cards exceeds the available space, an arrow icon appears on the right when the user mouses over the object stream overlay. Mousing over the arrow button area scrolls the cards across the screen from right to left. As soon as the first card on the left moves out of the visible overlay area, a second arrow appears on the left for moving in the other direction. Once the last card is in full view, the arrow on the right disappears.

Placeholder Card

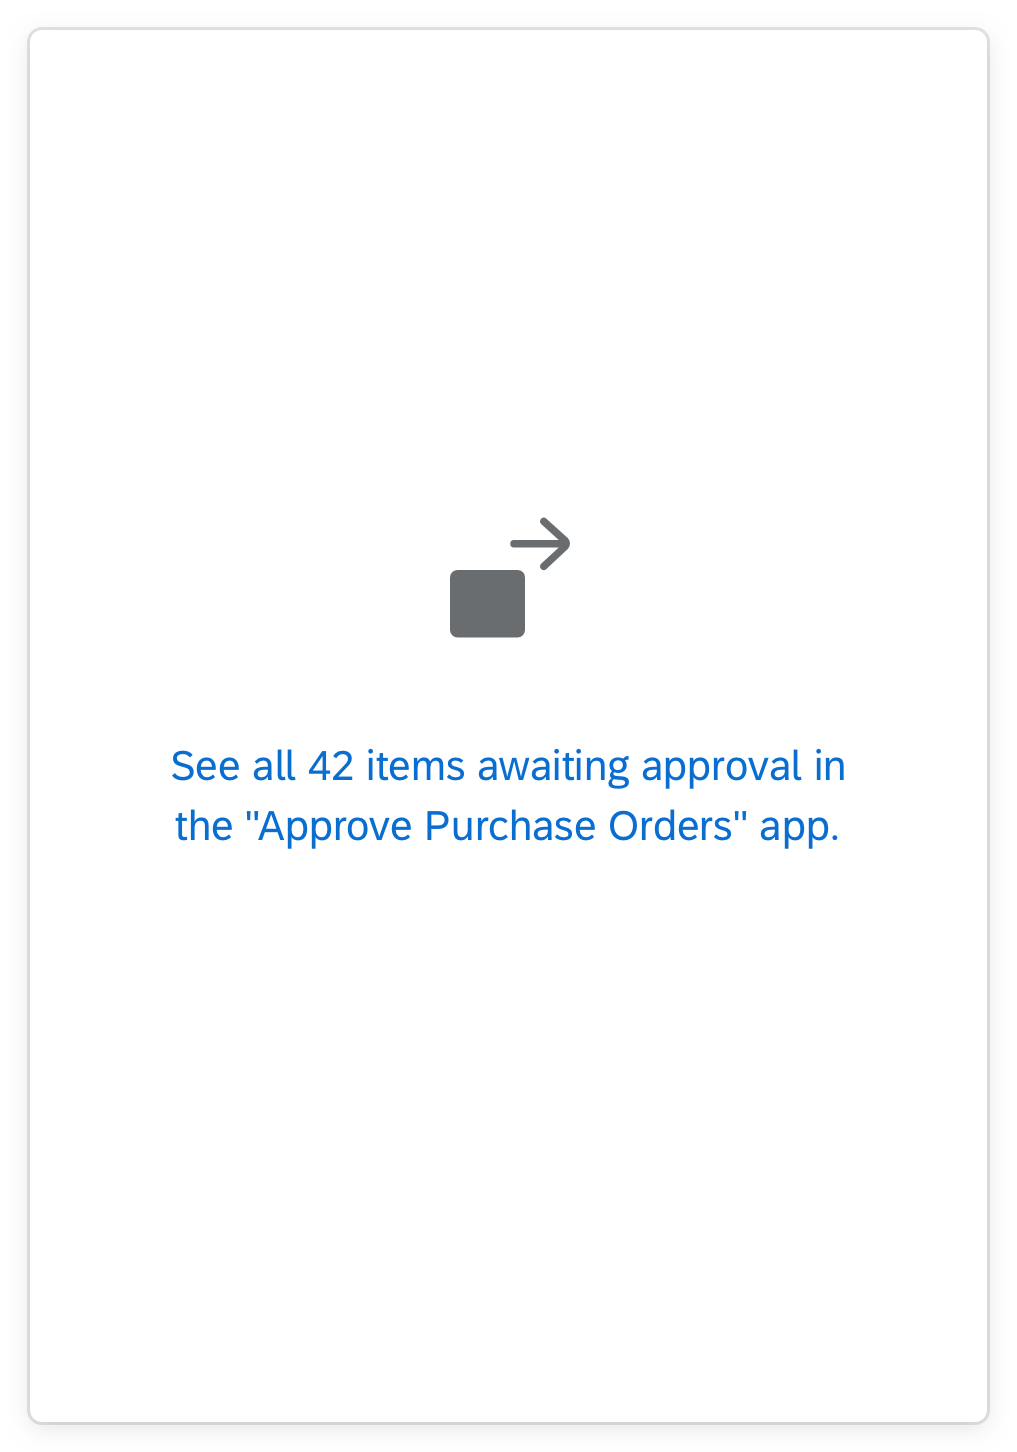
If the number of items returned for the annotated view exceeds the maximum 20 cards allowed in the object stream, a placeholder card is added automatically at the end of the stream (as card 21). The entire placeholder card is navigable, and takes the user to the full result set in the parent application.

The text on the placeholder card is composed as follows:

See all [total] [items] in the“[app name]” app.

Where:

  • The values for [total] and [app name] are supplied by the system.
  • The term for [items] must be rephrased by the app team to reflect the type of item or business object. For more information, see Mandatory Adjustments.

Examples:

  • See all 42 items awaiting approval in the “Approve Leave Requests” app.
  • See all 42 purchase orders awaiting approval in the “Approve Purchase Orders” app.
Overview page – Placeholder card

Object Stream – Tablet Version

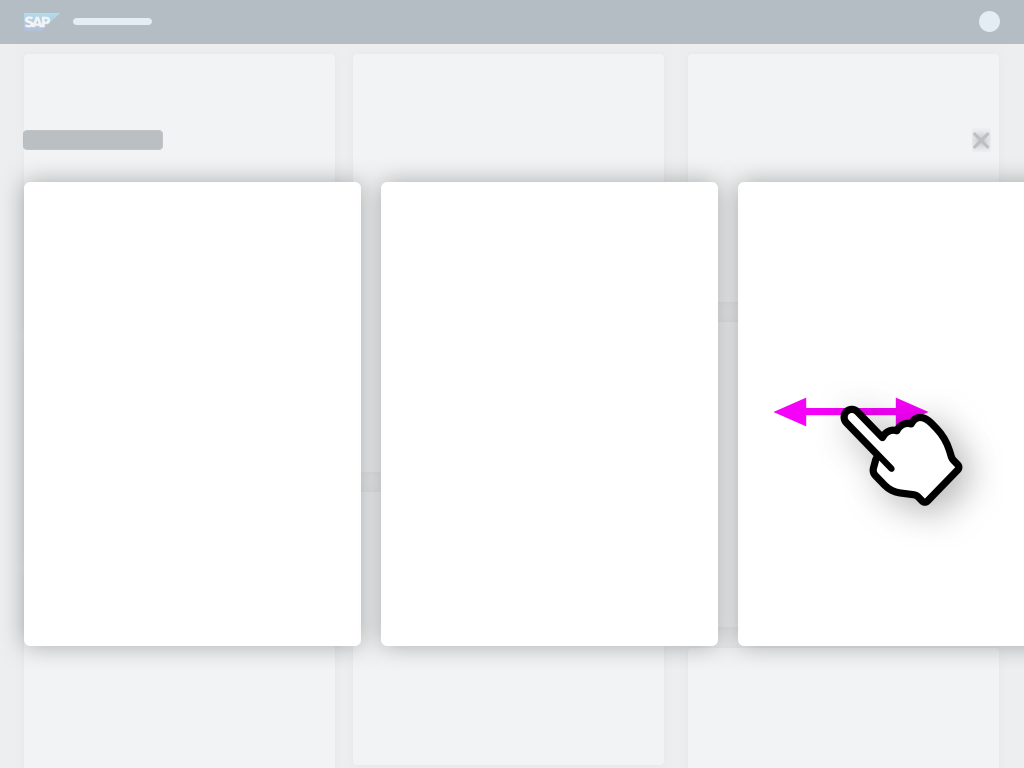
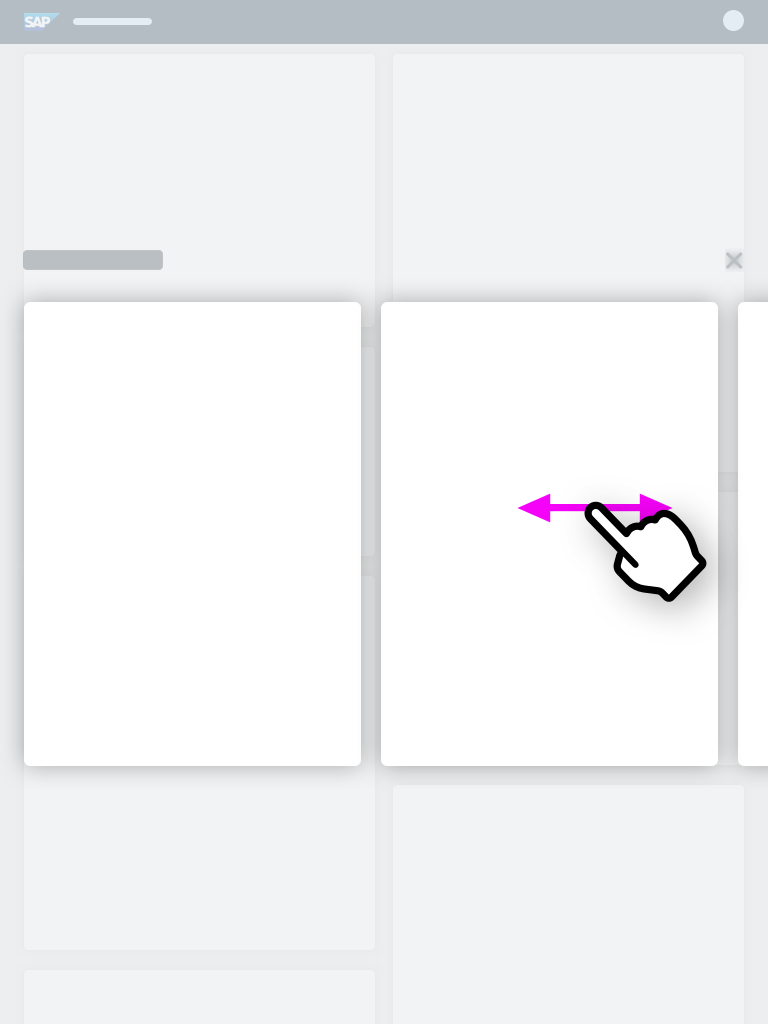
On tablet devices, the modeless overlay expands horizontally. It also expands vertically to accommodate the card height and allow space for the title and Close button. The user can swipe through cards and perform micro actions. Swiping a card into view moves the entire object stream. Tapping the Close button closes the stack card and returns the user to the main overview page. There are no scroll arrows on touch devices.

Tablet in horizontal orientation
Tablet in portrait orientation

Object Stream – Phone Version

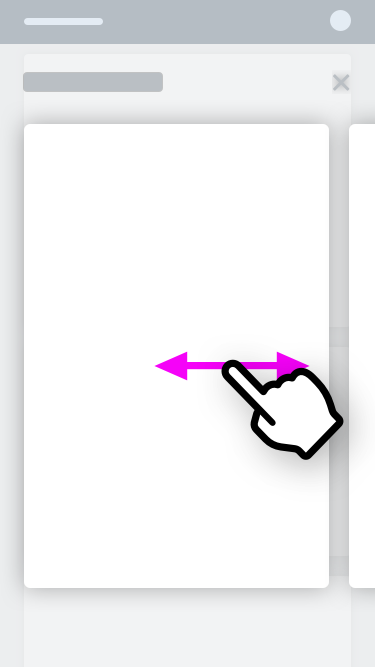
On smartphones, the overview page layout collapses to a single column in both portrait and landscape modes. Tapping the right-hand navigation area of a stack card opens the object stream on top of the overview page in a new full screen window.

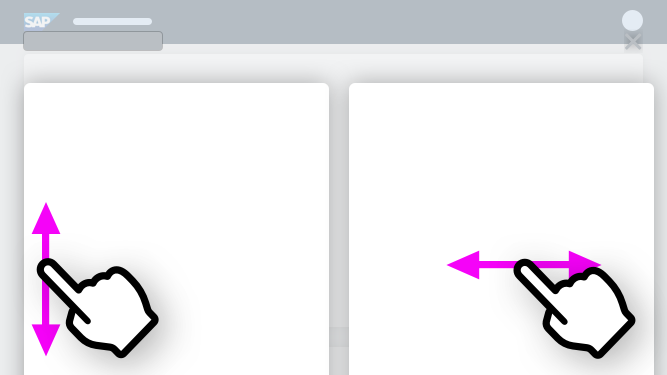
The object stream expands horizontally and vertically to accommodate the card height, and to allow space for the title and Close button. The user can swipe through the cards and perform micro actions. Swiping a card moves the entire object stream. Since the cards are too large to fit on the screen in landscape mode, users can also scroll vertically to see the full card content. Tapping the Close button closes the stack card and returns the user to the main overview page. There are no scroll arrows on touch devices.

Phone in horizontal orientation
Phone in portrait orientation

Quick View Card

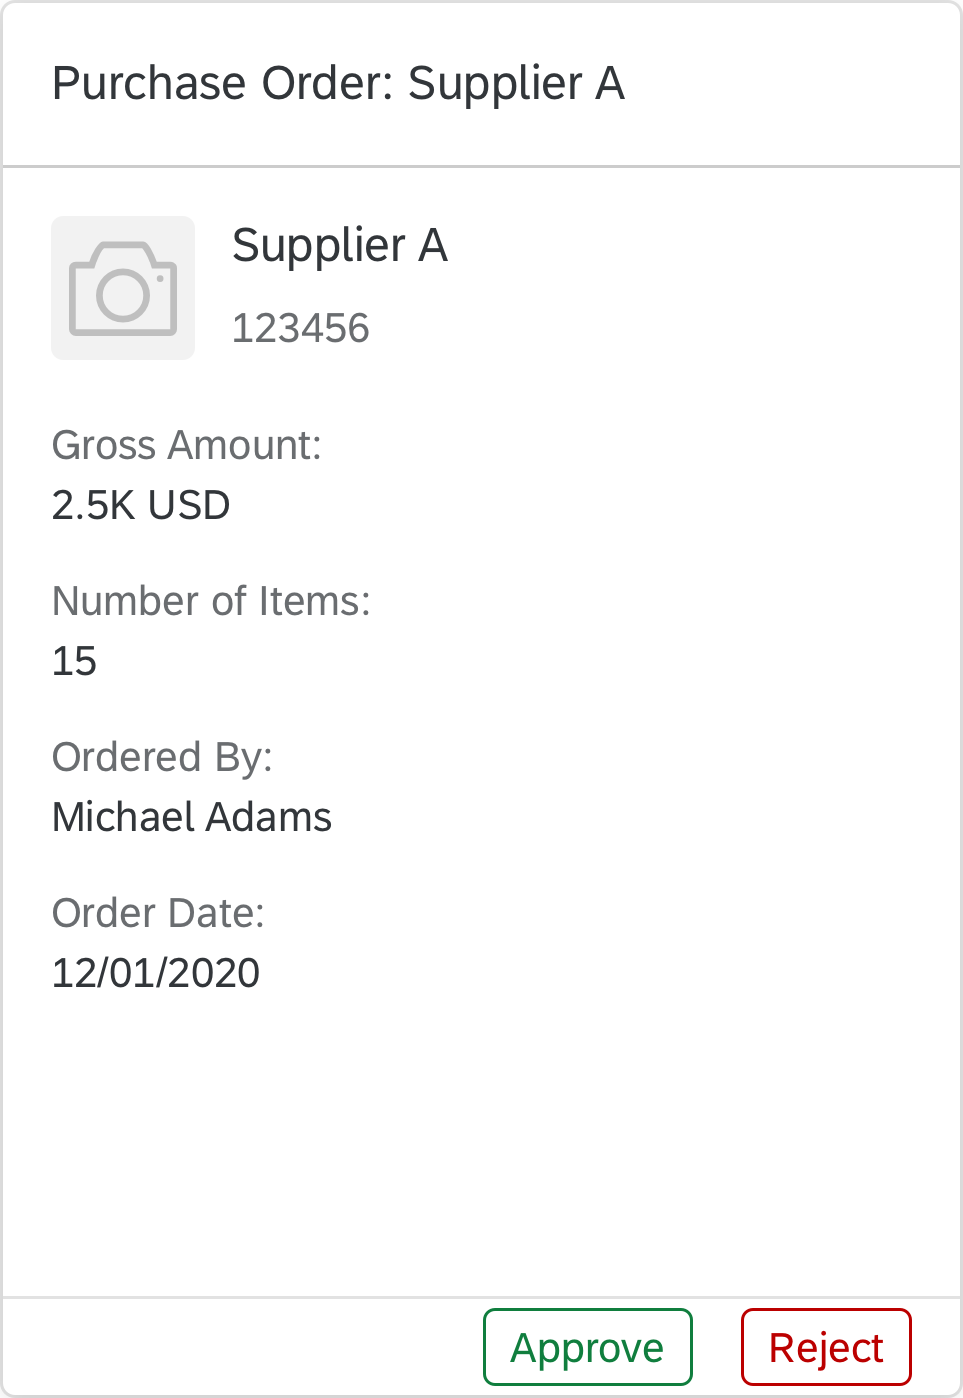
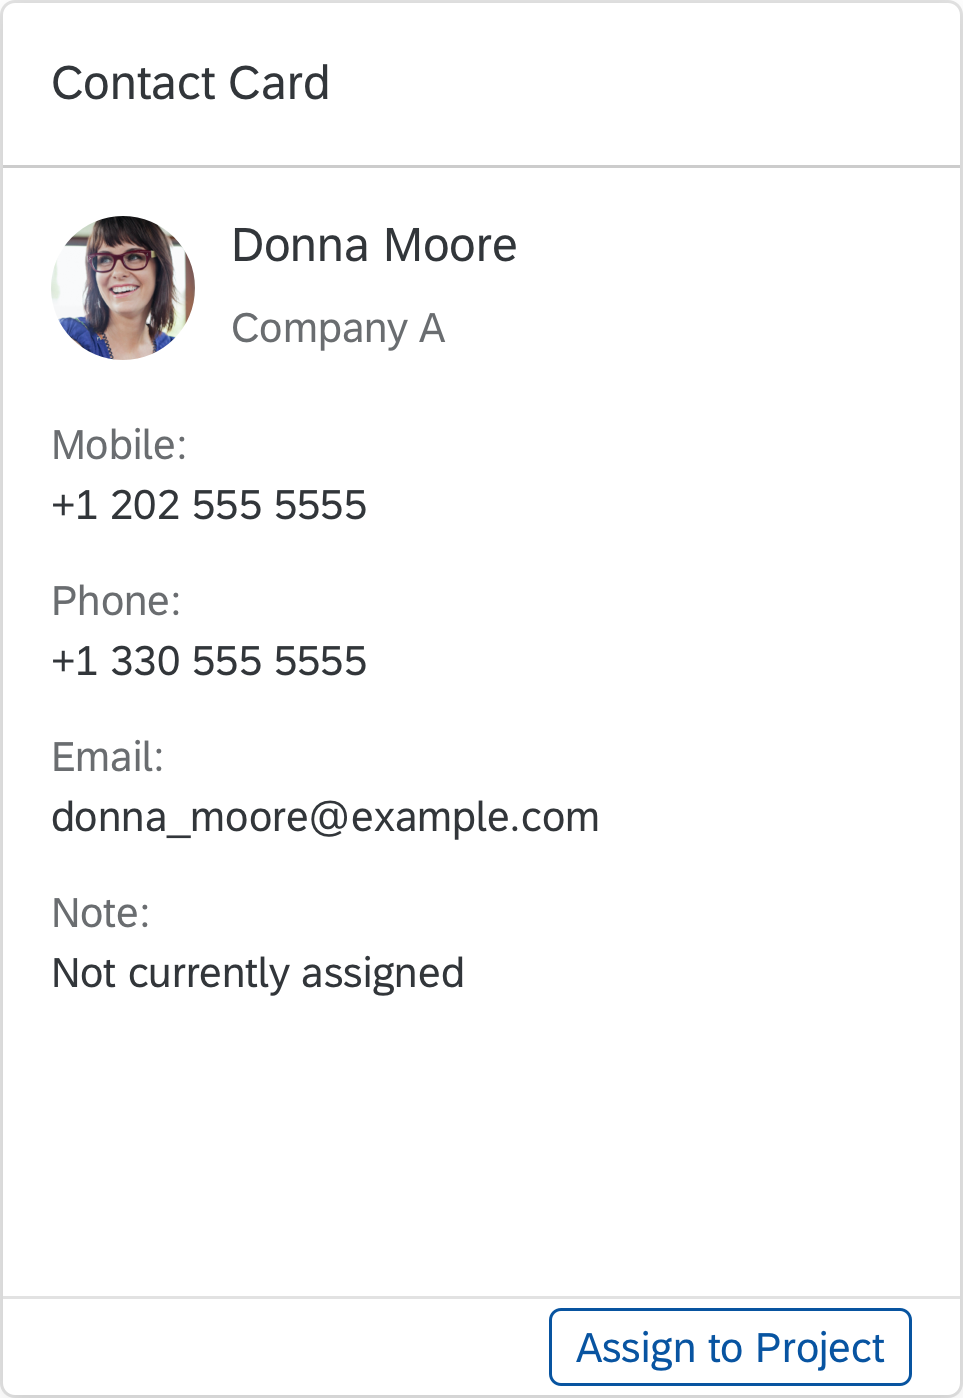
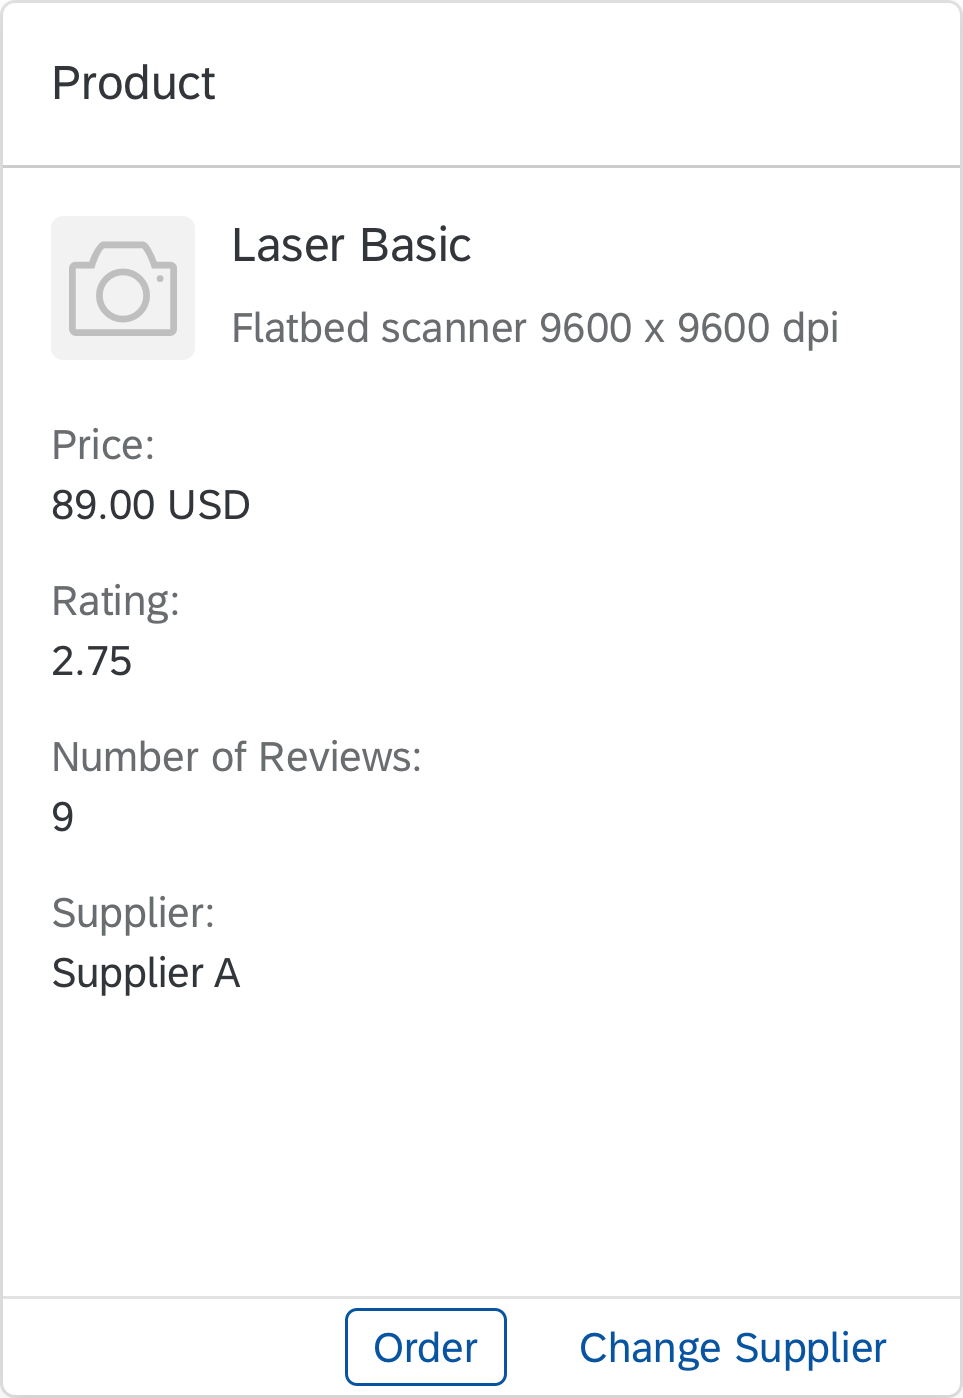
Quick view cards are single-object cards. They display the basic details for one object, such as the name, address, and phone numbers for a contact. This card type is only available within the object stream; you can’t place quick view cards on the overview page itself. The quick view card inherits the SAPUI5 element sap.m.QuickView.

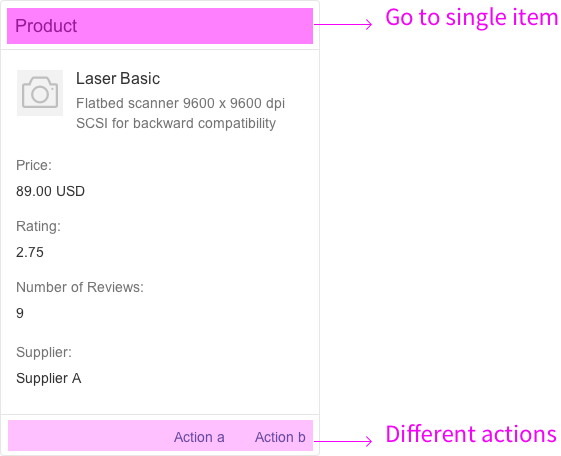
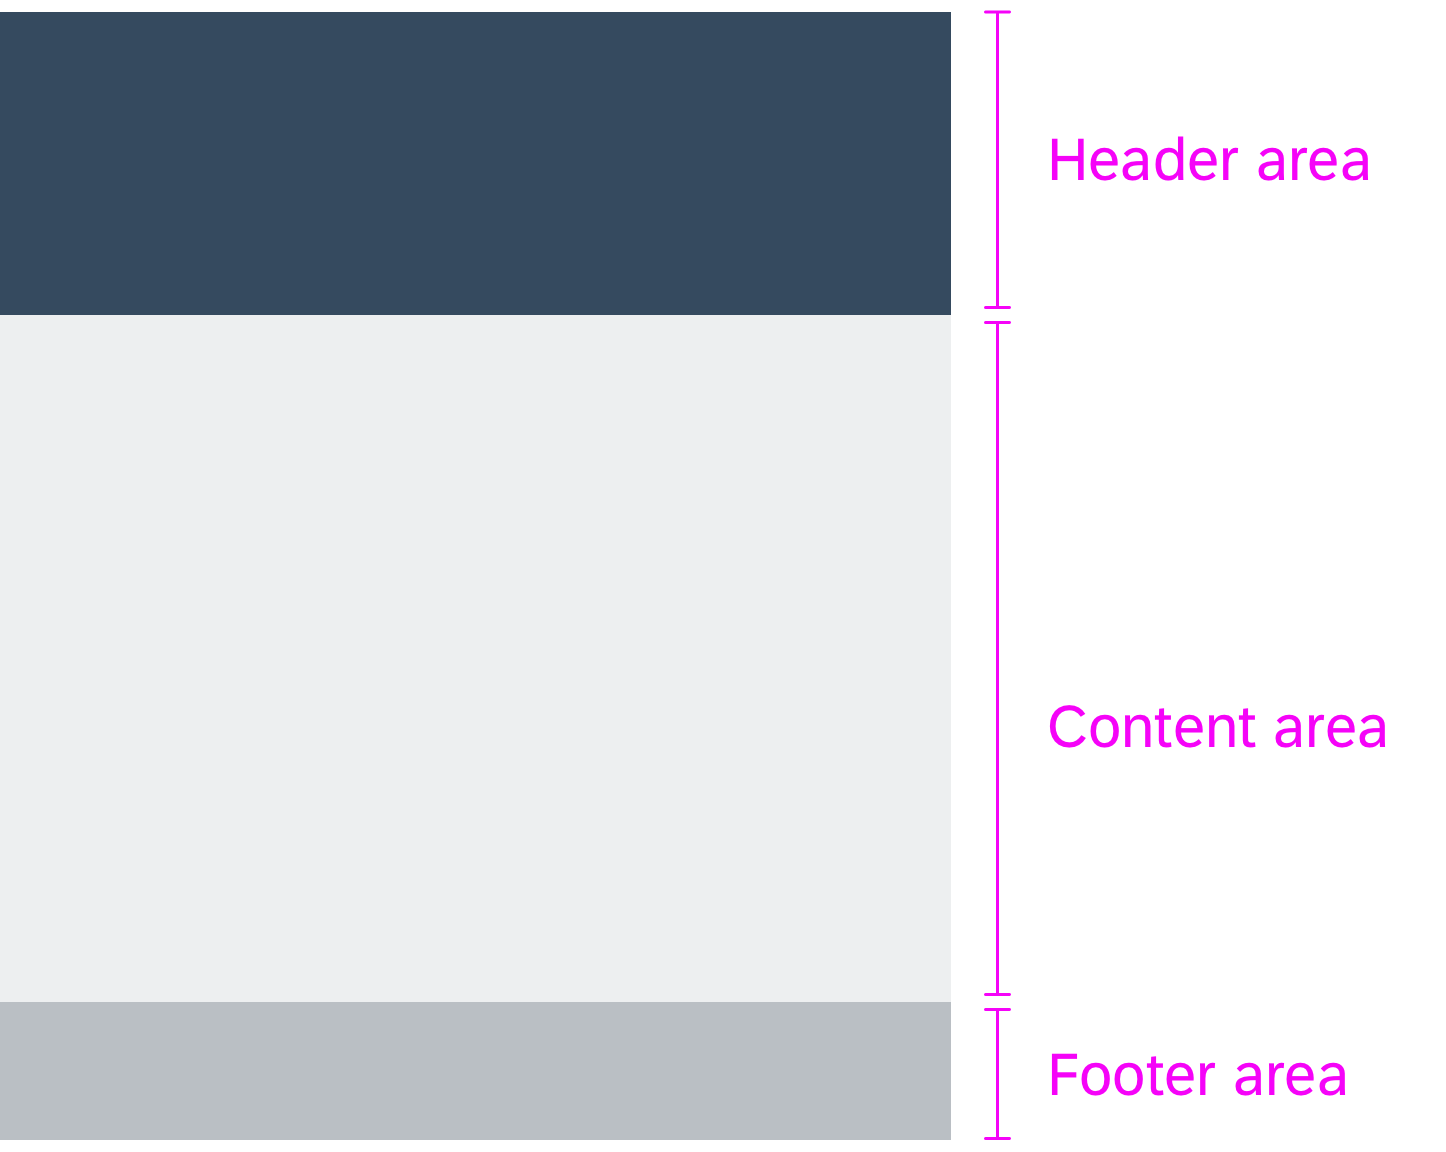
The header area contains a static text, such as Purchase Order, and an optional dynamic text, such as 1005-3345. In this way, each card header can show different content. Clicking on the header area of the card opens the detailed view of the object in the corresponding parent app. If the content area of a card cannot display all the information, a scrollbar appears on the right. Only the footer area of the quick view card can provide actions. The footer bar is a specific feature of the card anatomy for quick view cards.

Card anatomy of the quick view card
Quick view card for a contact
Quick view card for a product
Quick view card for a purchase order

Actions on Cards

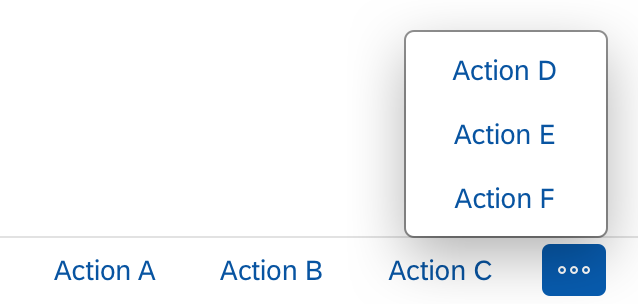
Only quick view cards within an object stream can have actions in the footer area. The overflow toolbar manages how the actions are displayed. All actions are right-aligned. Any actions that don’t fit into the available space move into the overflow action sheet, represented by the ellipsis ( ). A maximum of six actions are allowed in the footer area. Only offer actions the user really needs in the specific context.

Footer area with additional actions in the overflow

There are two possible types of action: navigation and function import. Any combination of navigation and function import actions is allowed. Error or confirmation messages are displayed directly on the overview page. Always overwrite the predefined default text for errors in a message box: Formulate your message in plain language (without code), describe the issue precisely, and suggest a constructive solution.

Type: Navigation

Navigation is “intent-based” and takes the user to a different SAP Fiori app that specializes in executing an action. Navigation actions are always multi-click (meaning they can be repeated over and over). The destination screen opens in the same browser window, and any error or task confirmation messages are handled by the supporting application, not the overview page.

Type: Function Import

Function imports are custom OData service operations for actions. These actions are handled by the overview page, rather than by another SAP Fiori app. The interaction depends on whether or not the action requires user input:

  • If the action requires additional user input, the input parameters are handled directly on the overview screen without further navigation. A dialog appears on top of the card, allowing the user to enter data or make a selection. An example of additional input might be the rejection reason for a “Reject” action.
  • If the action has no input parameters, the action request is sent immediately. Once the action has been completed, the card disappears from the object stream.

Action on Phone

If an action on a card requires an input dialog box, use a full screen dialog on smartphones.

Resources

Want to dive deeper? Follow the links below to find out more about the SAP Fiori overview page.

Elements and Controls

Implementation

Overview Page – Table Card

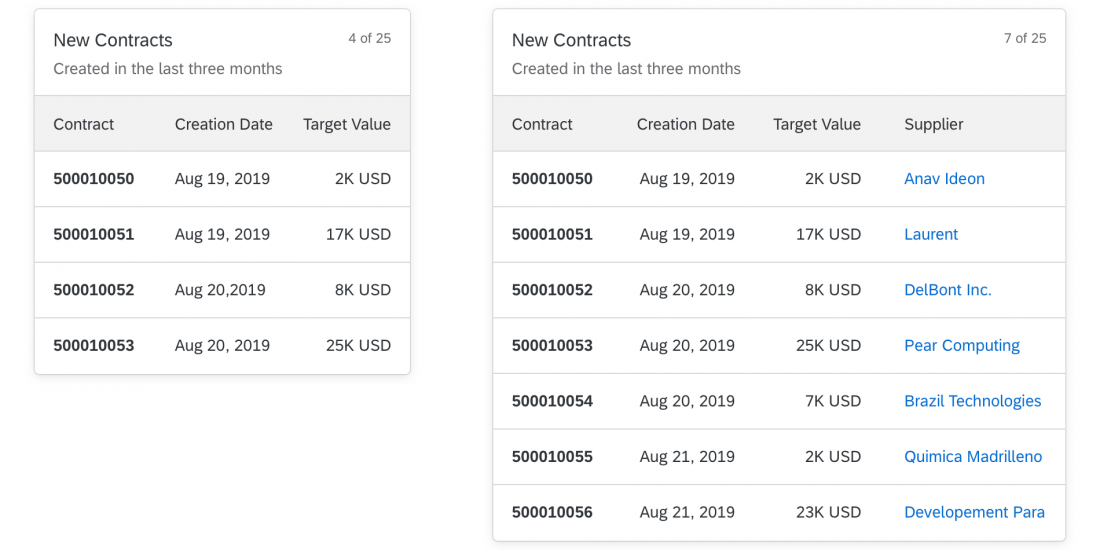
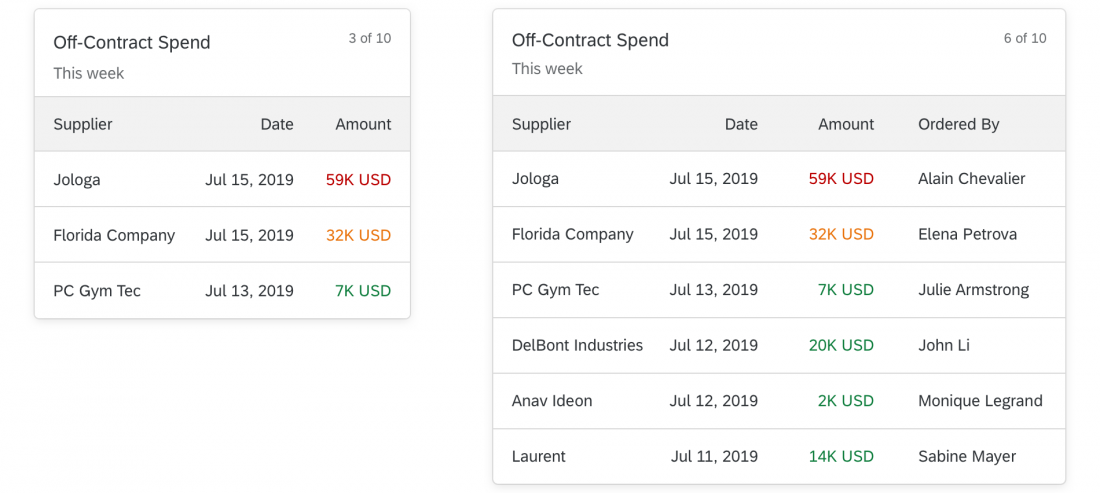
Table cards are a type of object group card, and display a set of items in a table format. Table cards use the responsive SAPUI5 control sap.m.Table. For general information on cards, see Cards.

Navigation

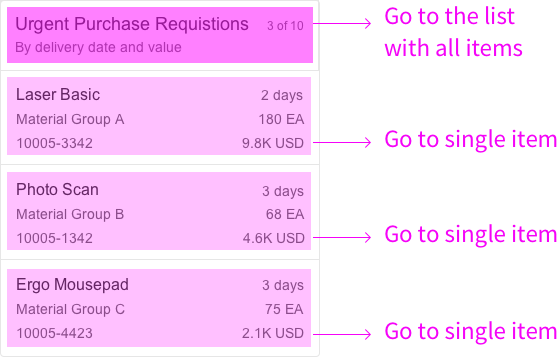
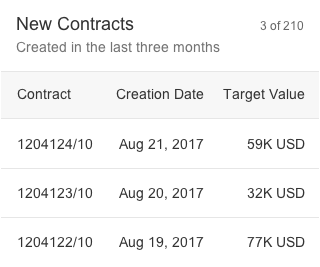
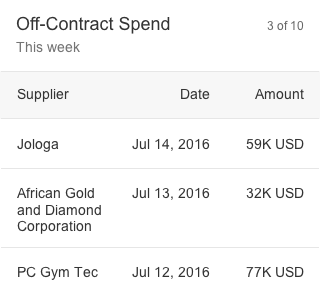
Clicking the header area of a table card opens the parent application, which uses the same filter as the annotated card, and shows a list of all the objects returned for the result set. The counter indicates how many items are showing on the card in relation to the total number of relevant items: [Items on Card] of [Total Items], as in 3 of 10.

Clicking a list item (row) on the card opens the detail view for that specific object in the same parent application. You can also use the smart link control in table cards. However, only use smart links if they add genuine value in your use case. Otherwise, you risk confusing users by offering too many navigation targets.

All three columns can show either a data field or a data point. Data points can use semantic colors.

Because the header area and line items are based on the same result set, they must always link to the same target application. You can also integrate a view switch inside the content area of a card.

Size of a Table Card

The fixed card layout defines a specific size. The height can vary depending on the number of table cells. Tables are limited to a maximum of 3 columns and 3 rows, with a maximum of 3 lines of text per row. To see the full result set, the user needs to navigate to the parent app.

In the resizable card layout, users can see more content/insights by resizing the cards.

Resources

Want to dive deeper? Follow the links below to find out more about the SAP Fiori overview page.

Elements and Controls

Implementation

Overview Page – List Card

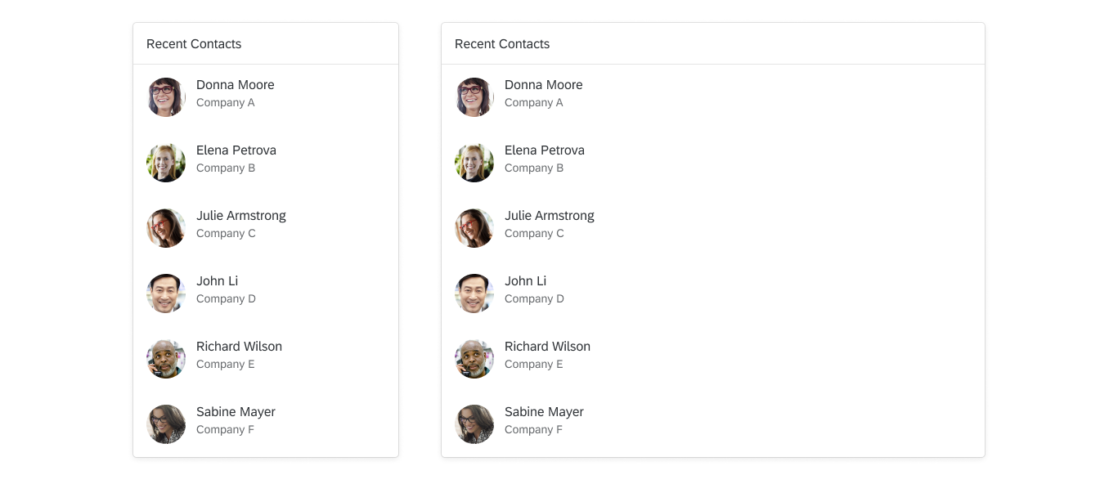
Lists with Different Flavors

List cards display a set of items or links in a list format. The overview page supports three types of list card: list card, bar chart list card, and link list card. You can also show icons and images. For general information on cards, see Cards.

List Card

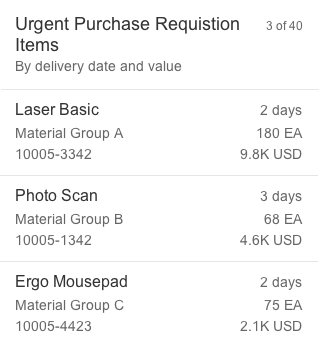
List cards are a type of object group card, and display a set of items in a vertical list. List cards use the sap.m.List container in the content area.

Navigation

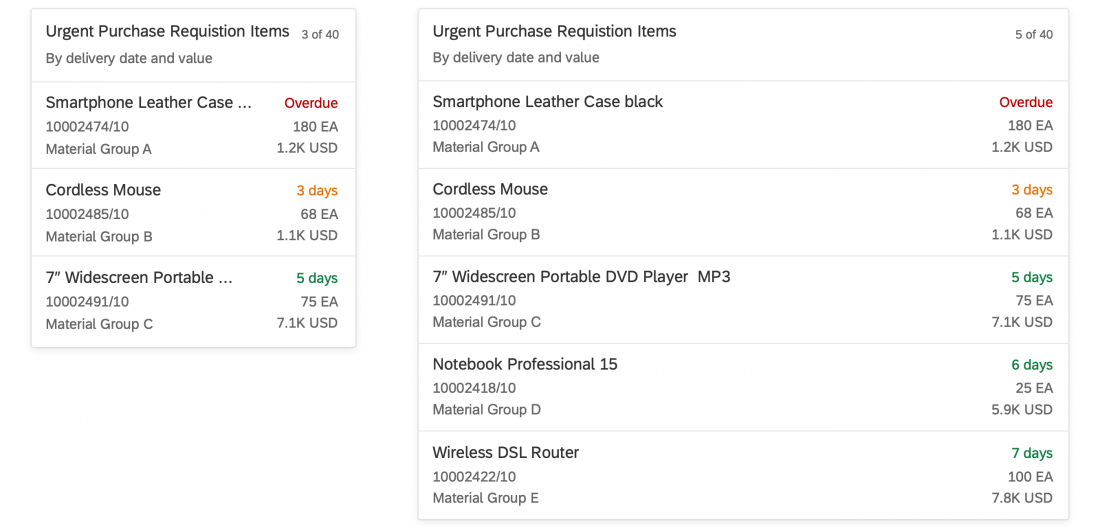
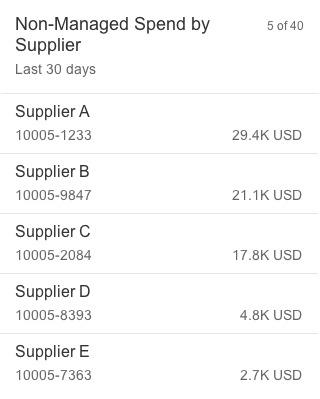
Clicking the header area of a list card opens the parent application, which uses the same filter as the annotated card, and shows a list of all the objects returned for the result set. The counter indicates how many items are showing on the card in relation to the total number of relevant items: [Items on Card] of [Total Items], as in 5 of 40.

Clicking a list item (row) on the card opens the detail view for that specific item in the same parent application. Only aggregate list items in exceptional cases.

Because the header area and line items are based on the same result set, they must always link to the same target application. You can also integrate a view switch inside the content area of a card.

List Item Types

Two different list item types are available:

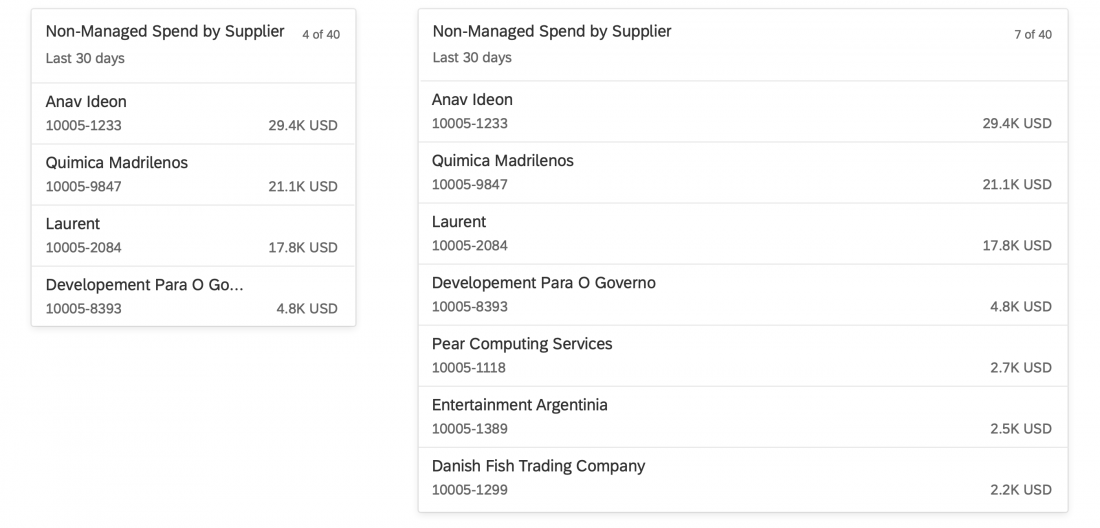
  • The standard list item always shows 3 pieces of information and inherits the properties of the SAPUI5 control sap.m.StandardListItem.
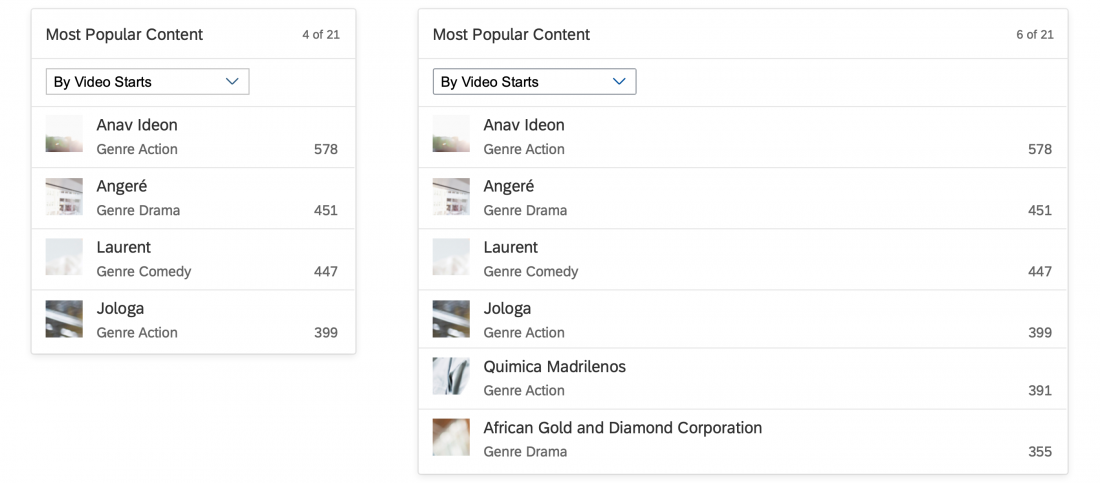
    You can also show an (optional) icon or image on the left.
  • The extended list item can show up to 6 pieces of information and inherits the properties of the SAPUI5 control sap.m.ObjectListItem.

In addition, you can display the data on the right-hand side in semantic colors.

You can only use one type of list item on any given card.

Standard list item
Standard list item
Extended list item
Extended list item

Size of a List Card

The fixed card layout defines a specific size. The height of list cards can vary, depending on the number of text fields. Show no more than five standard list items and no more than three extended list items on one card. To see the full result set, the user needs to navigate to the parent app.

In the resizable card layout, users can see more content/insights by resizing the cards.

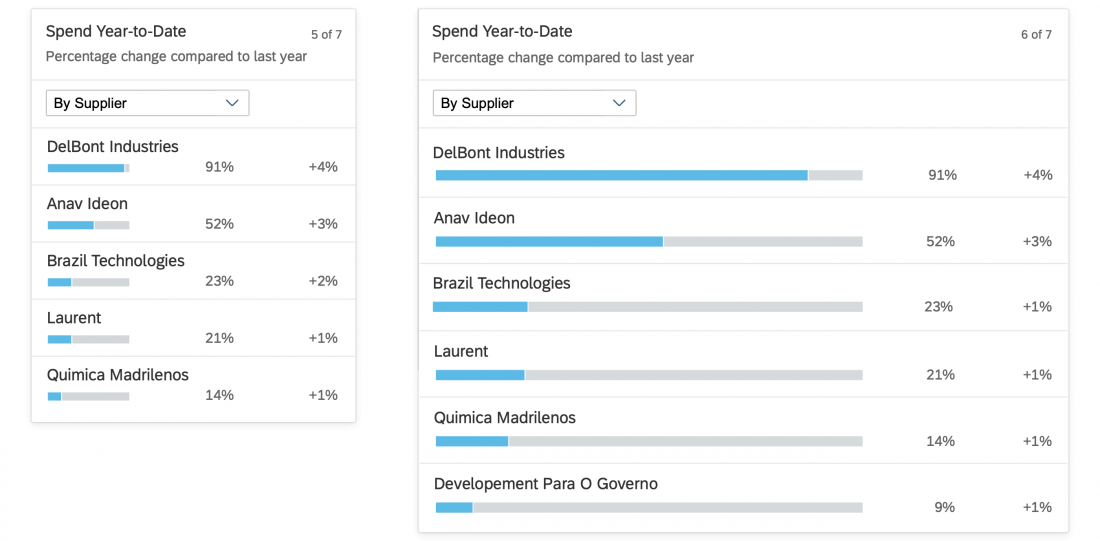
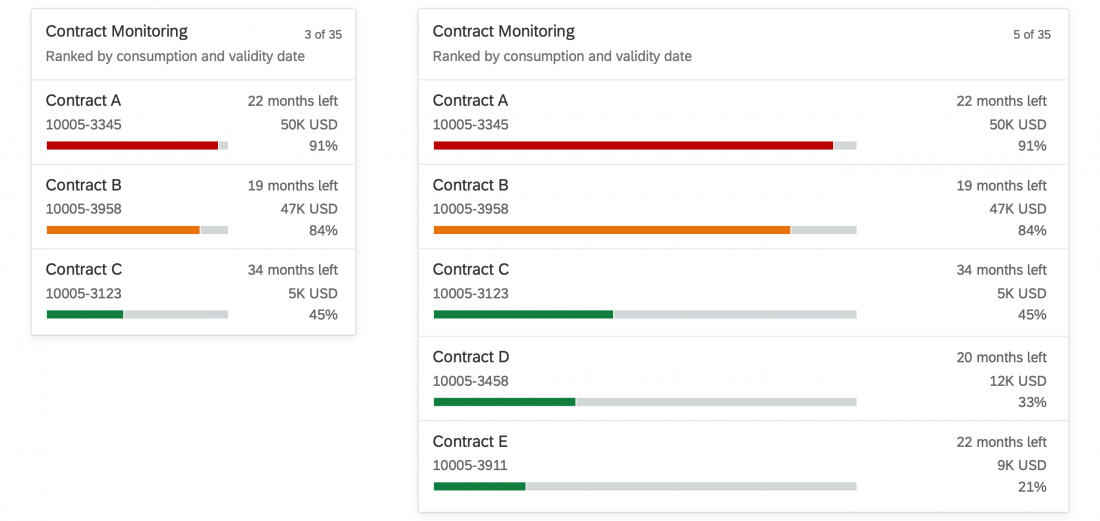
Bar Chart List Card

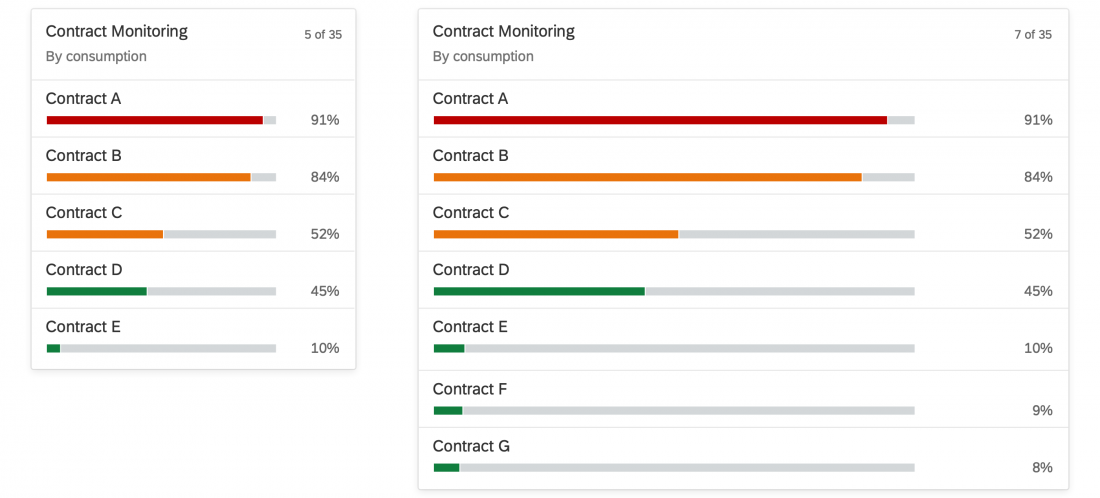
Bar chart list cards are a type of object group card, and display a set of items in a vertical list. Unlike list cards, bar chart list cards are embedded in another component: the comparison micro chart. This allows you to display negative values and use semantic colors.

Navigation

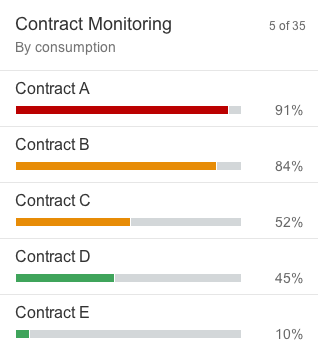
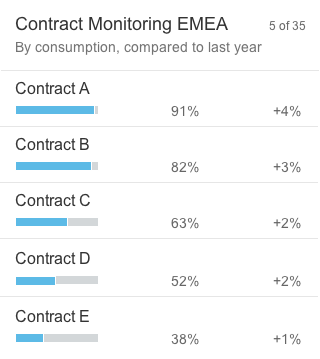
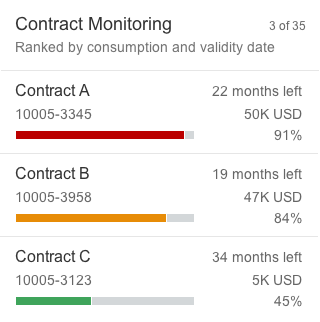
Clicking the header area of a list card opens the parent application, which uses the same filter as the annotated card, and shows a list of all the objects returned for the result set. The counter indicates how many items are showing on the card in relation to the total number of relevant items: [Items on Card] of [Total Items], as in 5 of 35.

Clicking a list item (row) on the card opens the detail view for that specific item in the same parent application. Only aggregate list items in exceptional cases.

Because the header area and line items are based on the same result set, they must always link to the same target application. You can also integrate a view switch inside the content area of a card.

Bar Chart List Item Types

Three different list item types are available:

  • The standard list item always shows 3 pieces of information.
  • The condensed list item can show up to 4 pieces of information.
  • The extended list item can show up to 6 pieces of information.

You can only use one type of list item on any given card.

Standard list item
Standard list item
Condensed list item
Condensed list item
Extended list item
Extended list item

Size of a Bar Chart List Card

The fixed card layout defines a specific size. The height can vary, depending on the number of text fields. Show no more than five standard/condensed list items and no more than three extended list items on one card. To see the full result set, the user needs to navigate to the parent app.

In the resizable card layout, users can see more content/insights by resizing the cards.

Link List Card

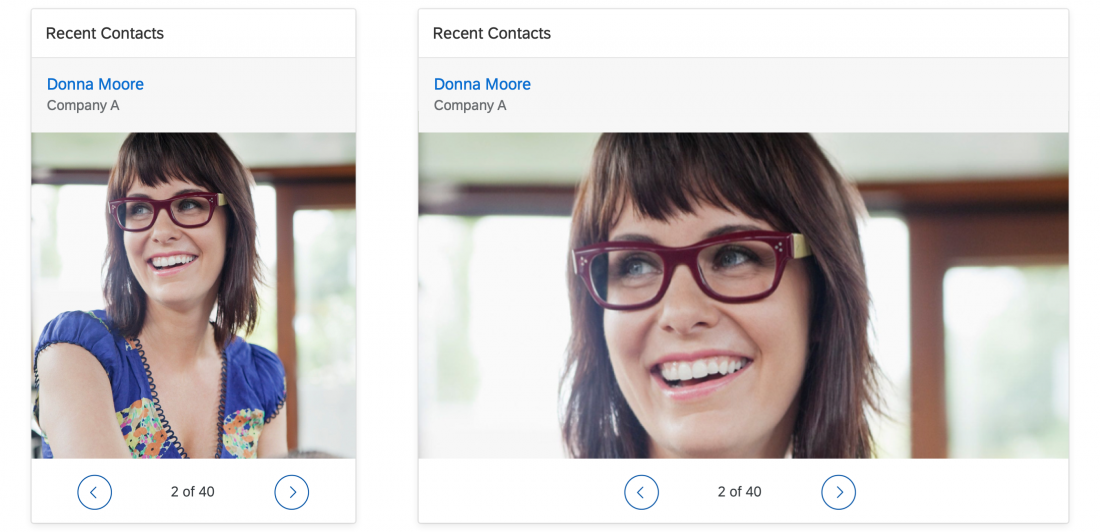
Link list cards allow you to display a collection of links or images that can reference both internal and external targets. Links and images are handled as two separate variants: list and image.

Variant Type: List

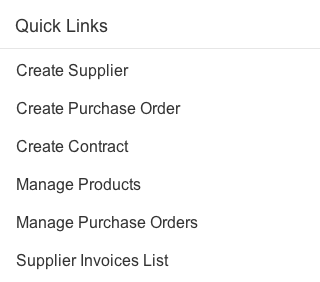
The list variant shows a collection of links that can navigate to a target or open a popover with additional information. You can also show an optional subtitle below the link with a description or additional information. The link text and subtitle are each limited to one line.

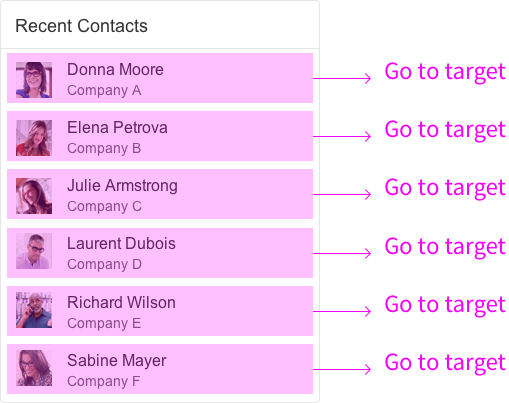
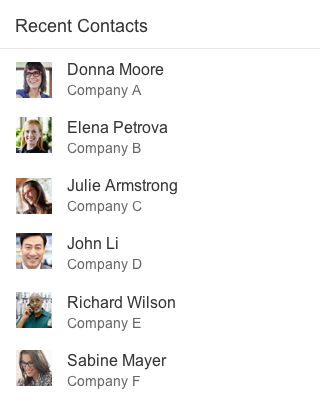
You can display an icon or image before each link. For example, you might want to include app icons for set of links to recently-used apps, or images for a list of recent contacts. Use icons and images consistently:

  • If you opt to use icons, show an icon before every link.
  • If you include images, use a placeholder for images that are not available.

Variant Type: Image

Overview page - Link list card (image variant)

The image variant uses the sap.m.Carousel control to display one or more images. If the carousel contains only one image, the Previous and Next icons and the paging indicator are not visible. The link and an optional subtitle are displayed above the carousel. The link text and subtitle are each limited to one line.

Size of a Link List Card

In the fixed card layout, link list cards with the variant type “list” can have a maximum of 6 links. There is no maximum limit for cards with the variant type “image”.

In the resizable card layout, there is no maximum limit. Users can see more links by resizing the cards.

Resources

Want to dive deeper? Follow the links below to find out more about the SAP Fiori overview page.

Elements and Controls

Implementation

Overview Page – Cards

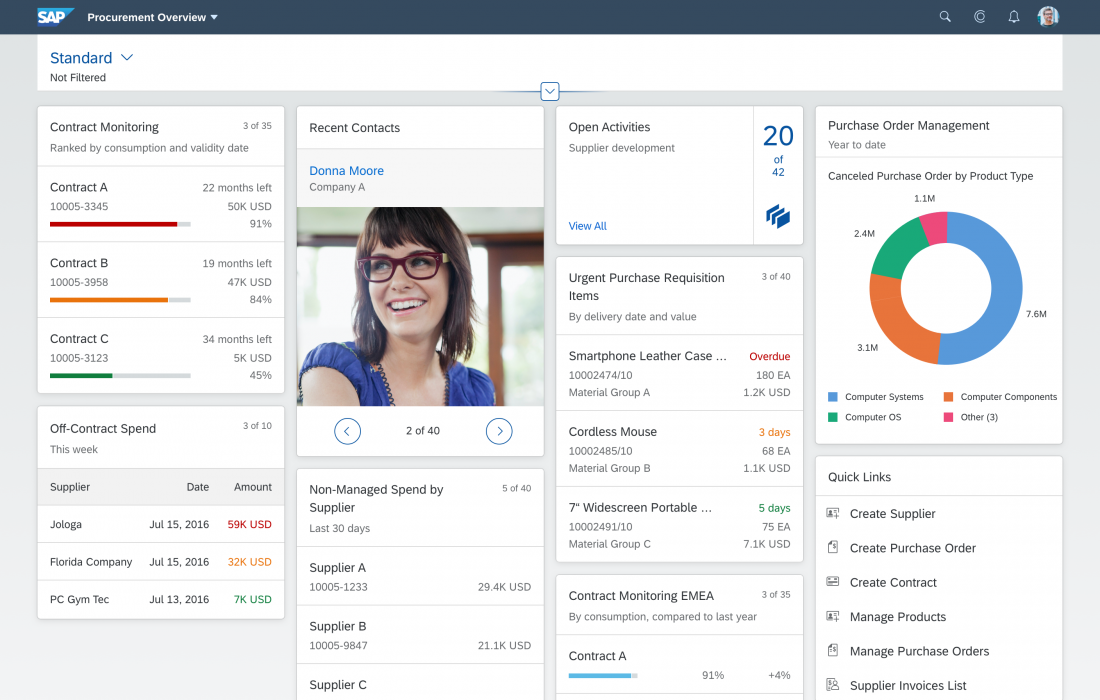
Cards – Harmonized and Powerful Information

Each task or topic on an overview page is represented by a card. The overview page acts as a UI framework for organizing multiple cards for one role on a single page .

Cards are containers for app content, and represent an entry-level view of the most pertinent app data for a given topic or issue. Technically, a card is a smart component that uses UI annotations to render its content. Cards allow you to show application content from different sources side by side – without requiring the user to switch screens. Cards differ in the content they display: They can show a chart, a list, a table, informative text, or a combination of two elements. However, cards never have editable fields.

Cards can focus on a single object or topic, or on a group of objects. Cards can also vary in size, depending on the selected layout.

The overview page can contain several cards that reference the same (parent) application. However, each card must bring added value to the user, and not just repeat information already offered on another card.

Before you start designing cards for an overview page, see the best practices.

At a Glance

  • Cards are small previews of application content.
  • Each card represents a specific topic, task, or perspective.
  • Cards help users to focus by applying progressive disclosure principles.
  • Cards are powerful and beautiful.
  • Cards offer a variety of visualizations.
Overview page with different card types (extract)

Card Anatomy

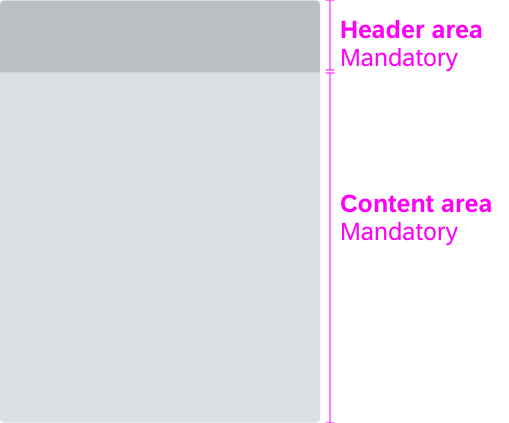
Each card comprises two components: a header area and a content area. The header and content areas are mandatory. A footer area is only used for actions in the quick view card.

The interactive navigation in the header and content areas is represented by a hover effect.

When designing cards, make sure that you define and format the texts on all the cards consistently. For details , check out the UI text guidelines for the overview page.

Card anatomy
Card anatomy

Card Header

The card header area is mandatory, and serves the following purposes:

  • It indicates what the card is about.
  • It functions as a navigation area for opening the parent app, whereby the whole header area is clickable. We highly recommend offering this navigation to enable users to move seamlessly to the app details without losing focus on the task in hand  (exception: link list card). 
  • A counter shows how many items are on the card in relation to the total number of relevant items.
  • An overflow menu with options to add the card to the My Home page or to refresh only the data in the card, not the entire page.

The height of the header area is variable; it expands vertically to accommodate the text. The header area can contain two text fields: a mandatory title, and an optional subtitle. The primary purpose of the header area is to identify the content source, summarize the focus of the card (title), show any relevant parameters (subtitle), and offer navigation to the content source (parent app).

Title

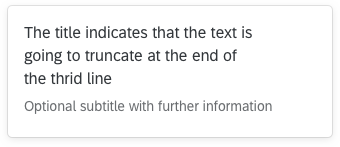
The title is mandatory and represents the card’s “point of view”. In one or two words, it explains why this card exists and why a user might want to use it. It is a natural language reflection of the annotated view. Titles that exceed three lines are truncated with the ellipsis ().

Subtitle

The subtitle is optional. You can use it to qualify the title, offer an explanation, or show a status. The use of the subtitle can differ, depending on the card type. Subtitles that exceed one line are truncated with the ellipsis (…).

Card header with counter

Counter

The counter in the header area indicates how many items are showing on the card in relation to the total number of relevant items:

Format: [Items on Card] of [Total Items]
Example: 5 of 40 

The counter is right-aligned and is never truncated (the title wraps instead). The width of the counter is flexible, depending on the amount of data. [Items on Card] can show a maximum three digits, and [Total Items] a maximum of four digits. For larger numbers, a scaling factor is shown. If all the relevant items are visible on the card, no counter is shown. There is also no counter if there is an issue loading a card, or no items are found for the filter criteria.

In the resizable card layout, the card counter adapts to the card size. If the user increases the size of a card with a scaled counter, the counter shows the exact number of items (without the scaling factor). The scaling factor appears when values exceed 1000.

Card counter in different cases

Overflow Menu

The overflow menu lets users perform the following actions:

  • Refresh: refresh only the data in the card, not the entire page.
  • Add Card to My Home: add the card to the Insights area of the My Home page.

Card Content

The content area is mandatory and is reserved for application content. Content is currently displayed on cards by embedding SAPUI5 controls that specify the properties and data format. For example, an embedded standard list control provides formatting, such as row height, font sizes, and the number of text blocks.

The resizable card layout also has a special kind of the content area, called mini content. It describes the minimum height for the card content.

Card Types

The overview page supports the following standard card types:


You also have the option of creating custom cards. Custom cards allow you to define the appearance and the type of content within the content area of a card.

Important: Only use custom cards if the features required for your use case are not offered in any way by the standard cards for the overview page. If your basic requirements can be reasonably covered by one of the standard cards, always use the standard card, even if there are technical or visual limitations.

Appearance

Texts in Cards

Make sure that you define and format the texts on all the cards consistently. Check the UI text guidelines for the overview page for details.

Formatting Dates, Times, Amounts, and Currencies

Apply the following formats:

  • Dates: The default is the relative date format (for example, Today). However, you can also use the medium date format (such as Aug 7, 2015).
  • Times: Times are not visible by default, but if you need to show a time, use the short format (for example, 11:28 AM).
  • Integers/Float/Currencies: Use the short format (for example, 1K for 1000).

Refresh Behavior

You can set a specific refresh interval for the card content. All cards are refreshed at once.

Keep the user in mind: the shorter the refresh interval, the more disruptive it is for users.

Navigation and Interaction

The navigation and interaction depends on the technical card type:

The view switch enables you to reduce the number of similar cards and avoid repeating information.

Single-Object Cards

Cards that feature content with a single focal point, detail, or entity are called single-object cards. An example is a quick view card with information about a particular product. Analytical cards are also single-object cards. The header area of this card type always navigates to this specific focal point, detail, or entity. The content area can also have interaction areas (for example, a section in a chart, or a telephone number for a contact). However, only quick view cards can have actions in the footer area.

Interaction for a single-object card

Object Group Cards

Cards that feature a subset of items grouped by a common criterion are called object group cards. A typical example would be a list of purchase orders grouped by delivery date, amount, or supplier. The cards do not have actions, but each row or list item is selectable, thus providing direct navigation to the object details within the parent application. The header area of this card type always navigates to all items in the list or table. Object group cards include all types of list cards, bar chart list cards, and table cards.

Interaction for an object group card

Link List Cards

Link list cards allow you to display a collection of links or images that can reference both internal and external targets.

  • Links can navigate to a target or open a popover with additional information.
  • Clicking an image opens an image carousel.
Interaction for a link list card

Stack Cards

A stack card is a special card type for showing a collection of single-object cards. Stack cards have 3 components with different navigation areas:

  • The top-level stack card opens the collection and contains two clickable areas: the left area navigates to the parent app (with the list of all items), and the right area opens the object stream.
  • The object stream shows individual cards that represent objects from the parent application. The object stream heading links to the parent application, while individual cards can contain links and actions relating to the respective object. A Close button returns the user to the stack card.
  • The last card in the object stream is the placeholder card. The entire card is navigable and leads the user directly to the parent application.
Interaction for a stack card
Interaction for a placeholder card

View Switch

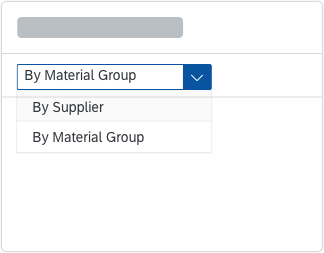
You can use a view switch to offer several different content areas on one card, which can help to reduce the number of cards on the overview page. The user chooses the view using a select control. You can only combine views that have a common denominator. The options offered by the select control merely offer different perspectives. For example, a card “Purchasing Spend” (title in the header area) could offer two views “By Material Group” and “By Supplier” (options in the select control). The view switch is located in the upper part of the content area.

You can use the view switch for the following cards:

View switch
View switch

Resources

Want to dive deeper? Follow the links below to find out more about the SAP Fiori Overview Page.

Elements and Controls

Implementation

Overview Page – Fixed Card Layout

Self-Contained Cards

The fixed card layout is a layout for the overview page. It comes with predefined card characteristics that support automatic, easy and fast card design. The cards have a fixed width, and the height is determined by the card type and the embedded control.

The cards are ordered in responsive and collapsible columns. The number of columns is also fixed to keep the focus on the middle of the screen and show the set of cards in a compact display (a kind of letterboxing). For more information, see Responsiveness.

The fixed card layout is one of two layout options for the overview page. The other is the resizable card layout.

Before you start designing cards for an overview page, see the best practices.

At a Glance

  • Easy and fast card design using predefined card framework

  • Fixed card width and predefined height

  • Arbitrary card order

Overview page – Fixed card layout

Fixed Card Sizes

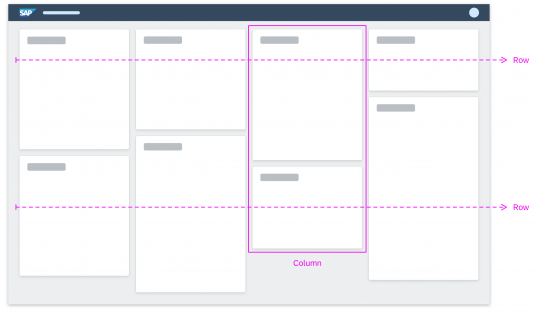
Grid

The grid is based on rows and columns. The spacing of 1 rem between the cards is always stable. Furthermore, there is a minimum width of 20 rem per card (corresponding to the column width). The columns with the cards adapt to the available screen real estate (also see Responsiveness).

Based on the underlying grid, users can rearrange the cards (see Rearranging Cards – Behavior).

Fixed card layout – Grid

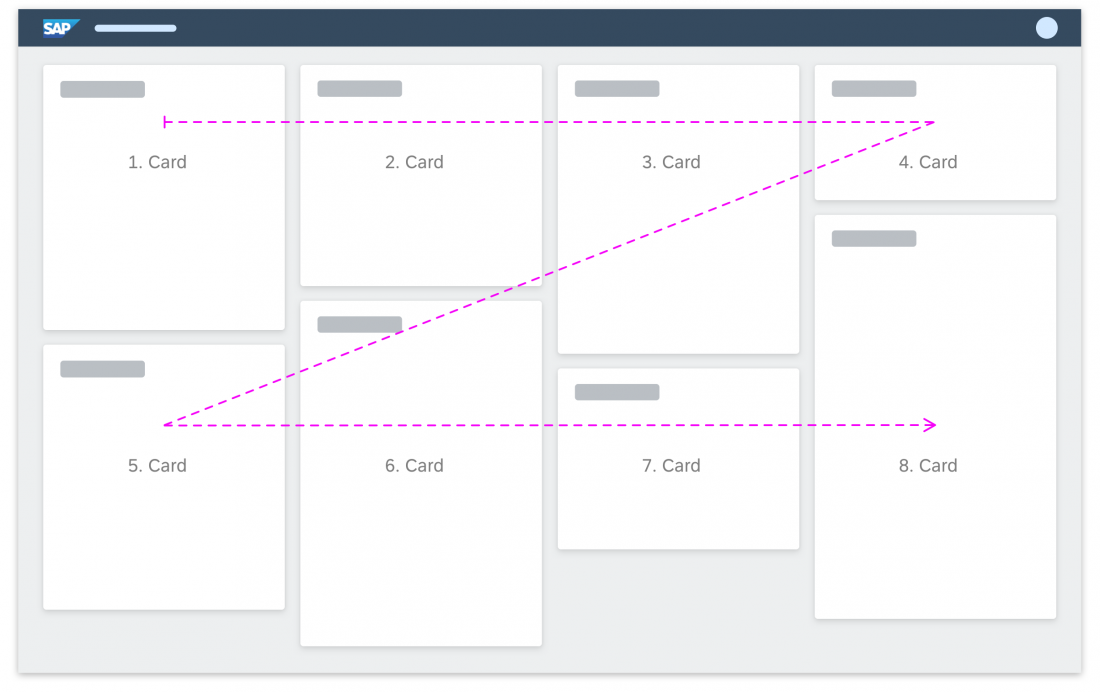
The cards are arranged as a “Z” flow: cards are ordered from left to right, starting with the first card on the top left of the page. For example, if a 5-column layout is reduced to 4-column layout, the fifth card drops to the next row, assuming the leftmost position underneath the first card.

There is no limit on the number of cards included. However, be careful not to overwhelm your users.

For general information on cards, see Cards.

Fixed card layout – Z flow

Card Sizes per Type

The card size is determined by the predefined card characteristics and maximum content for a given card type. As a result, the card types differ in height. The stack card and corresponding quick view card are handled independently.

List Card

The height of list cards can vary, depending on the number of text fields. Show no more than five standard list items and no more than three extended list items on one card. To see the full result set, the user needs to navigate to the parent app.

Standard list item
Standard list item
Extended list item
Extended list item

Bar Chart List Card

The height of  bar chart list cards can vary, depending on the number of text fields. Show no more than five standard/condensed list items and no more than three extended list items on one card. To see the full result set, the user needs to navigate to the parent app.

Standard list item
Standard list item
Condensed list item
Condensed list item
Extended list item
Extended list item

Link List Card (Variant Type “List”)

The link list card with the variant type “list”  is limited to a maximum of six links. There is no limit to the number of links for the variant type “image”.

Table Card

The height of table cards can vary, depending on the number of table cells. Tables are limited to a maximum of 3 columns and 3 rows, with a maximum of 3 lines of text per row. To see the full result set, the user needs to navigate to the parent app.

Rearranging Cards – Behavior

Drag and Drop

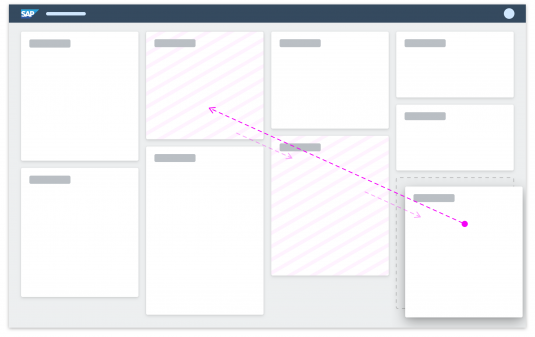
Users can reposition cards on the overview page by dragging them to a different location. As the user drags a card, it swaps places with any cards in its path. As soon as a neighbouring card is touched, the position of that card becomes the new target location for the card being dragged. A dashed line offers a preview of the new position.

To drag a card, the user has to long press on a card instead of just clicking. It doesn’t matter where the cursor is positioned – cards can be dragged from both the header and content areas. The mouse cursor also changes to indicate that the card can be dragged. Releasing the mouse or lifting the finger from the touch surface completes the move. To avoid gaps, cards always snap to the next free space in the row, or to the start of the next row.

In addition, users can personalize their own overview page by hiding cards.

Fixed card layout – Drag and drop

Getting Started

In the fixed card layout, you can’t influence the amount of information on each card. However, you can define the card order. Before you design your overview page, take a look at the best practices, which outline how to best use cards for an optimal user experience.

Responsiveness

The fixed card layout uses padding on both sides. The cards are displayed inside collapsible columns, making the page fully responsive. When the user resizes the browser or uses a smaller screen, the columns containing the cards collapse. To view all the cards, the user just scrolls down. In this way, the layout can accommodate typical laptop screens, larger desktop monitors, and mobile devices.

The width of the cards is tied to the column width. Breakpoints for the different screen resolutions determine whether the column width is 20 or 25 rem. The cards inside the columns adapt their width and content automatically. By contrast, the height of the cards is flexible, and depends on the content and type of card (see Card Sizes per Type).

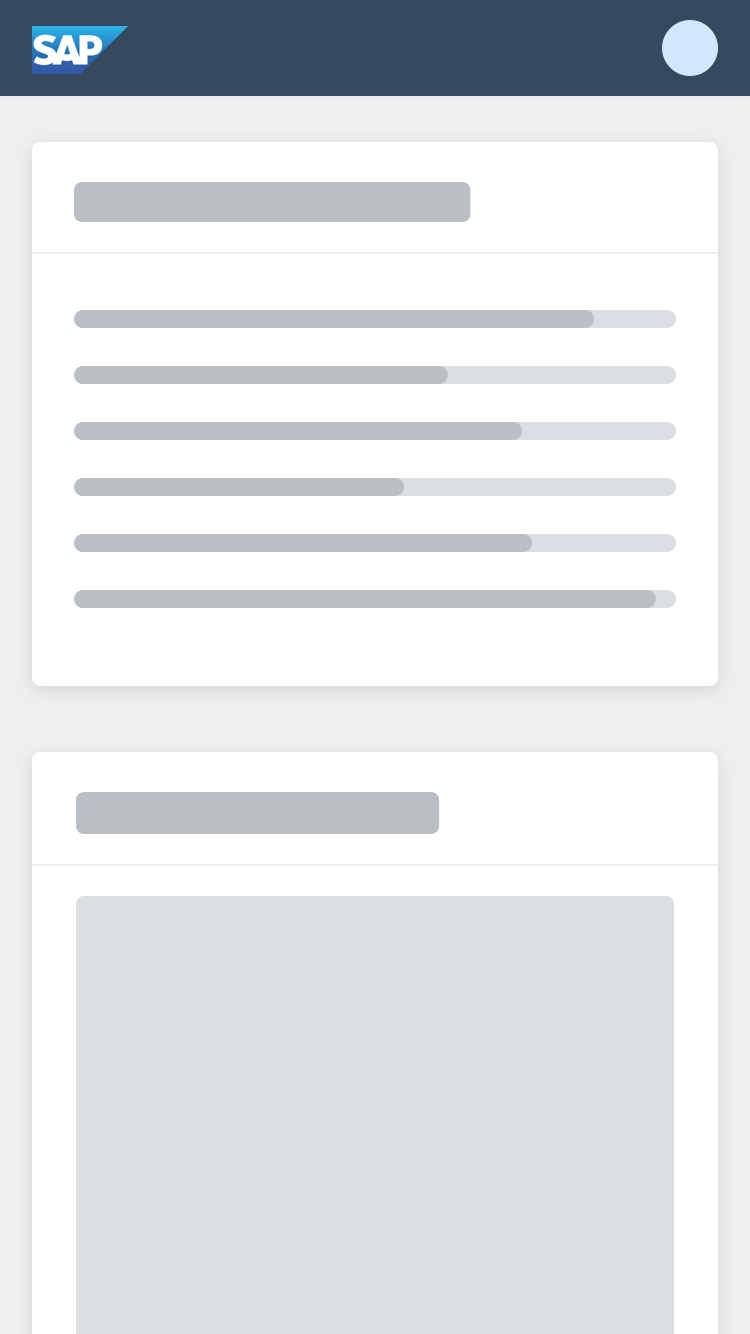
  • Phone: 1 column
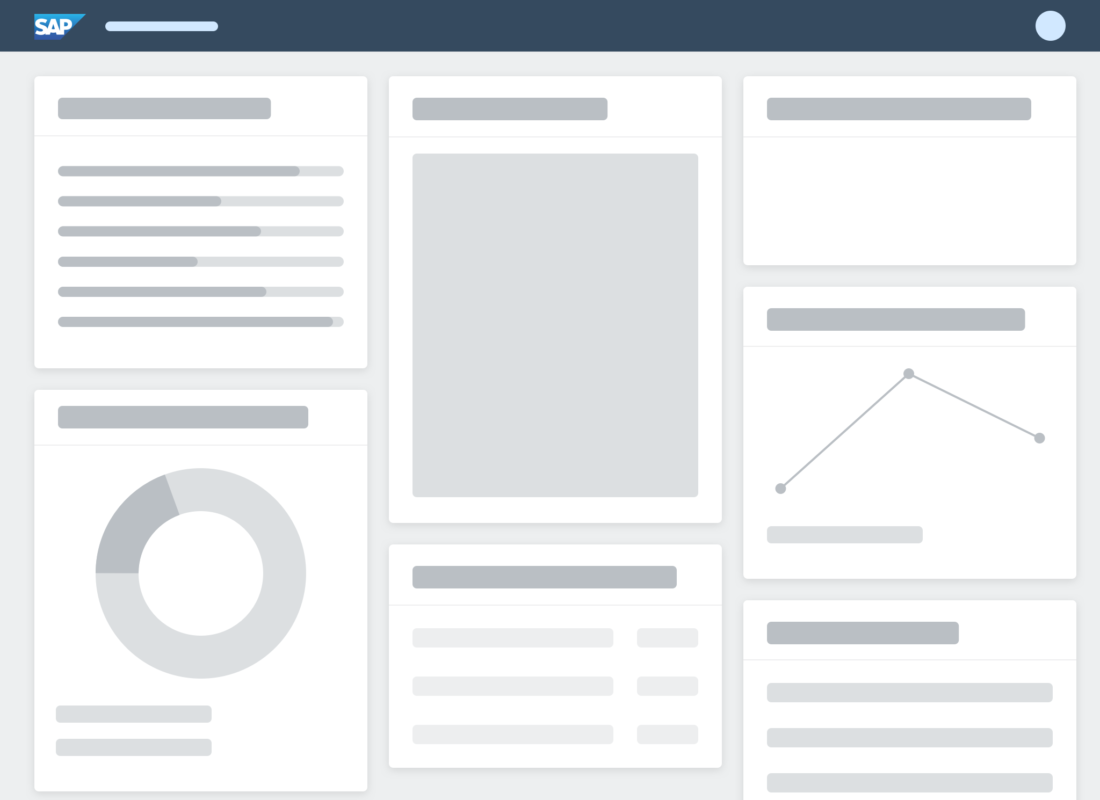
  • Tablet (portrait): 2 columns
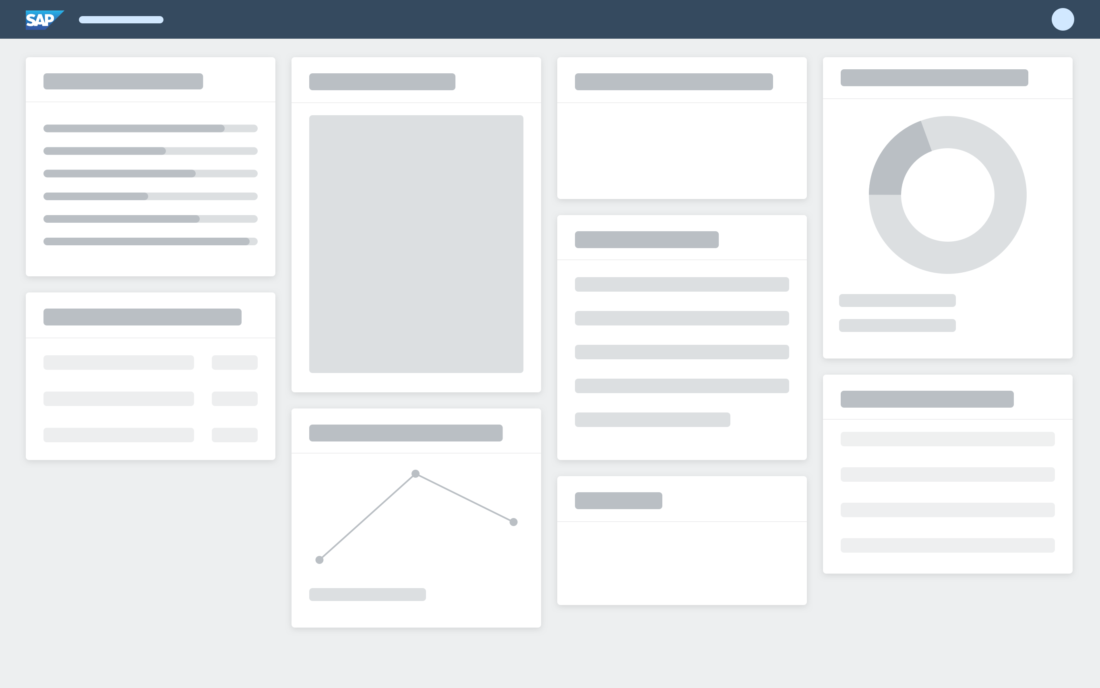
  • Laptop / tablet (landscape): 3 columns
  • Large desktop: 4 columns
  • Extended monitor: 5 columns (maximum)
Fixed card layout – Size S
Fixed card layout – Size M
Fixed card layout – Size L

Resources

Want to dive deeper? Follow the links below to find out more about the SAP Fiori overview page.

Elements and Controls

Implementation