
Chart Header
FUIObjectHeaderChartView
Intro
The chart header displays simple chart data inside an object header. It gives at-a-glance information about the object it is connected to, and it is supported in both compact and regular widths. This chart type can be used only in the object header.
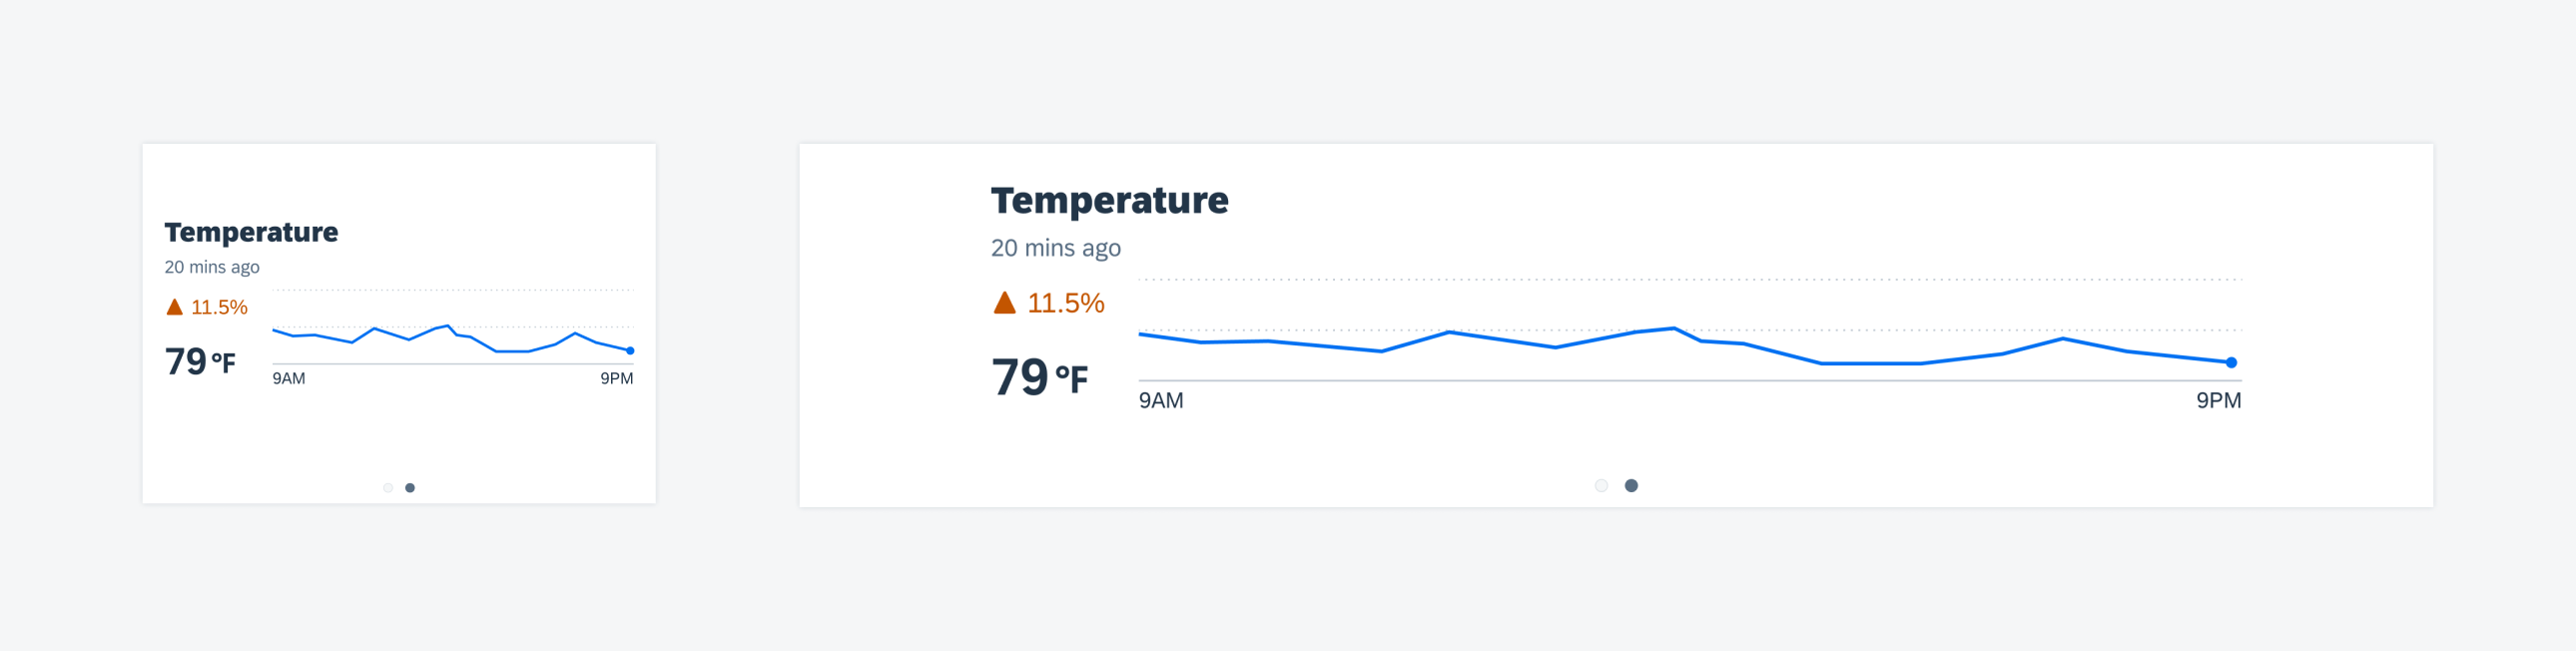
Chart header compact width (left) and regular width (right)
- Use the chart header when simple data, such as a trend, is important to view at a glance.
- Use the chart header to draw attention to one aspect of the object that it’s associated with.
- Use the chart header in the object header.
- Don’t use the chart header to show complex or multi-series data sets.
- Don’t use the chart header if you are including only the title and subtitle.
The chart header can include variations of the following elements. However, one of the analytical components (trend, KPI, or chart plot) must be used for this view.
- Chart title (mandatory)
- Subtitle or time stamp label
- Trend label and icon
- X-axis labels (optional). Only the first and last x-axis labels can be used in this view.
- Y-axis lines. A maximum of three y-axis lines can be shown. There can be no labels on the y-axis in this view.
- Chart data. The SAP Fiori for iOS chart header can be presented only as column or line charts.

Chart header anatomy
The header chart can be read-only or it can allow for navigation on tap to the full-screen, chart floorplan. When navigation is possible, the chart tile should appear in tint color. The entire chart container will be one touch target with a single tap interaction.
If navigation from the header chart is not enabled, it is recommended to provide a chart content table view cell version of the chart within the content area of the screen. This way, if text in the header chart is truncated, or if the chart displays values from a large data set, the user will still be able to view the chart information in greater detail.
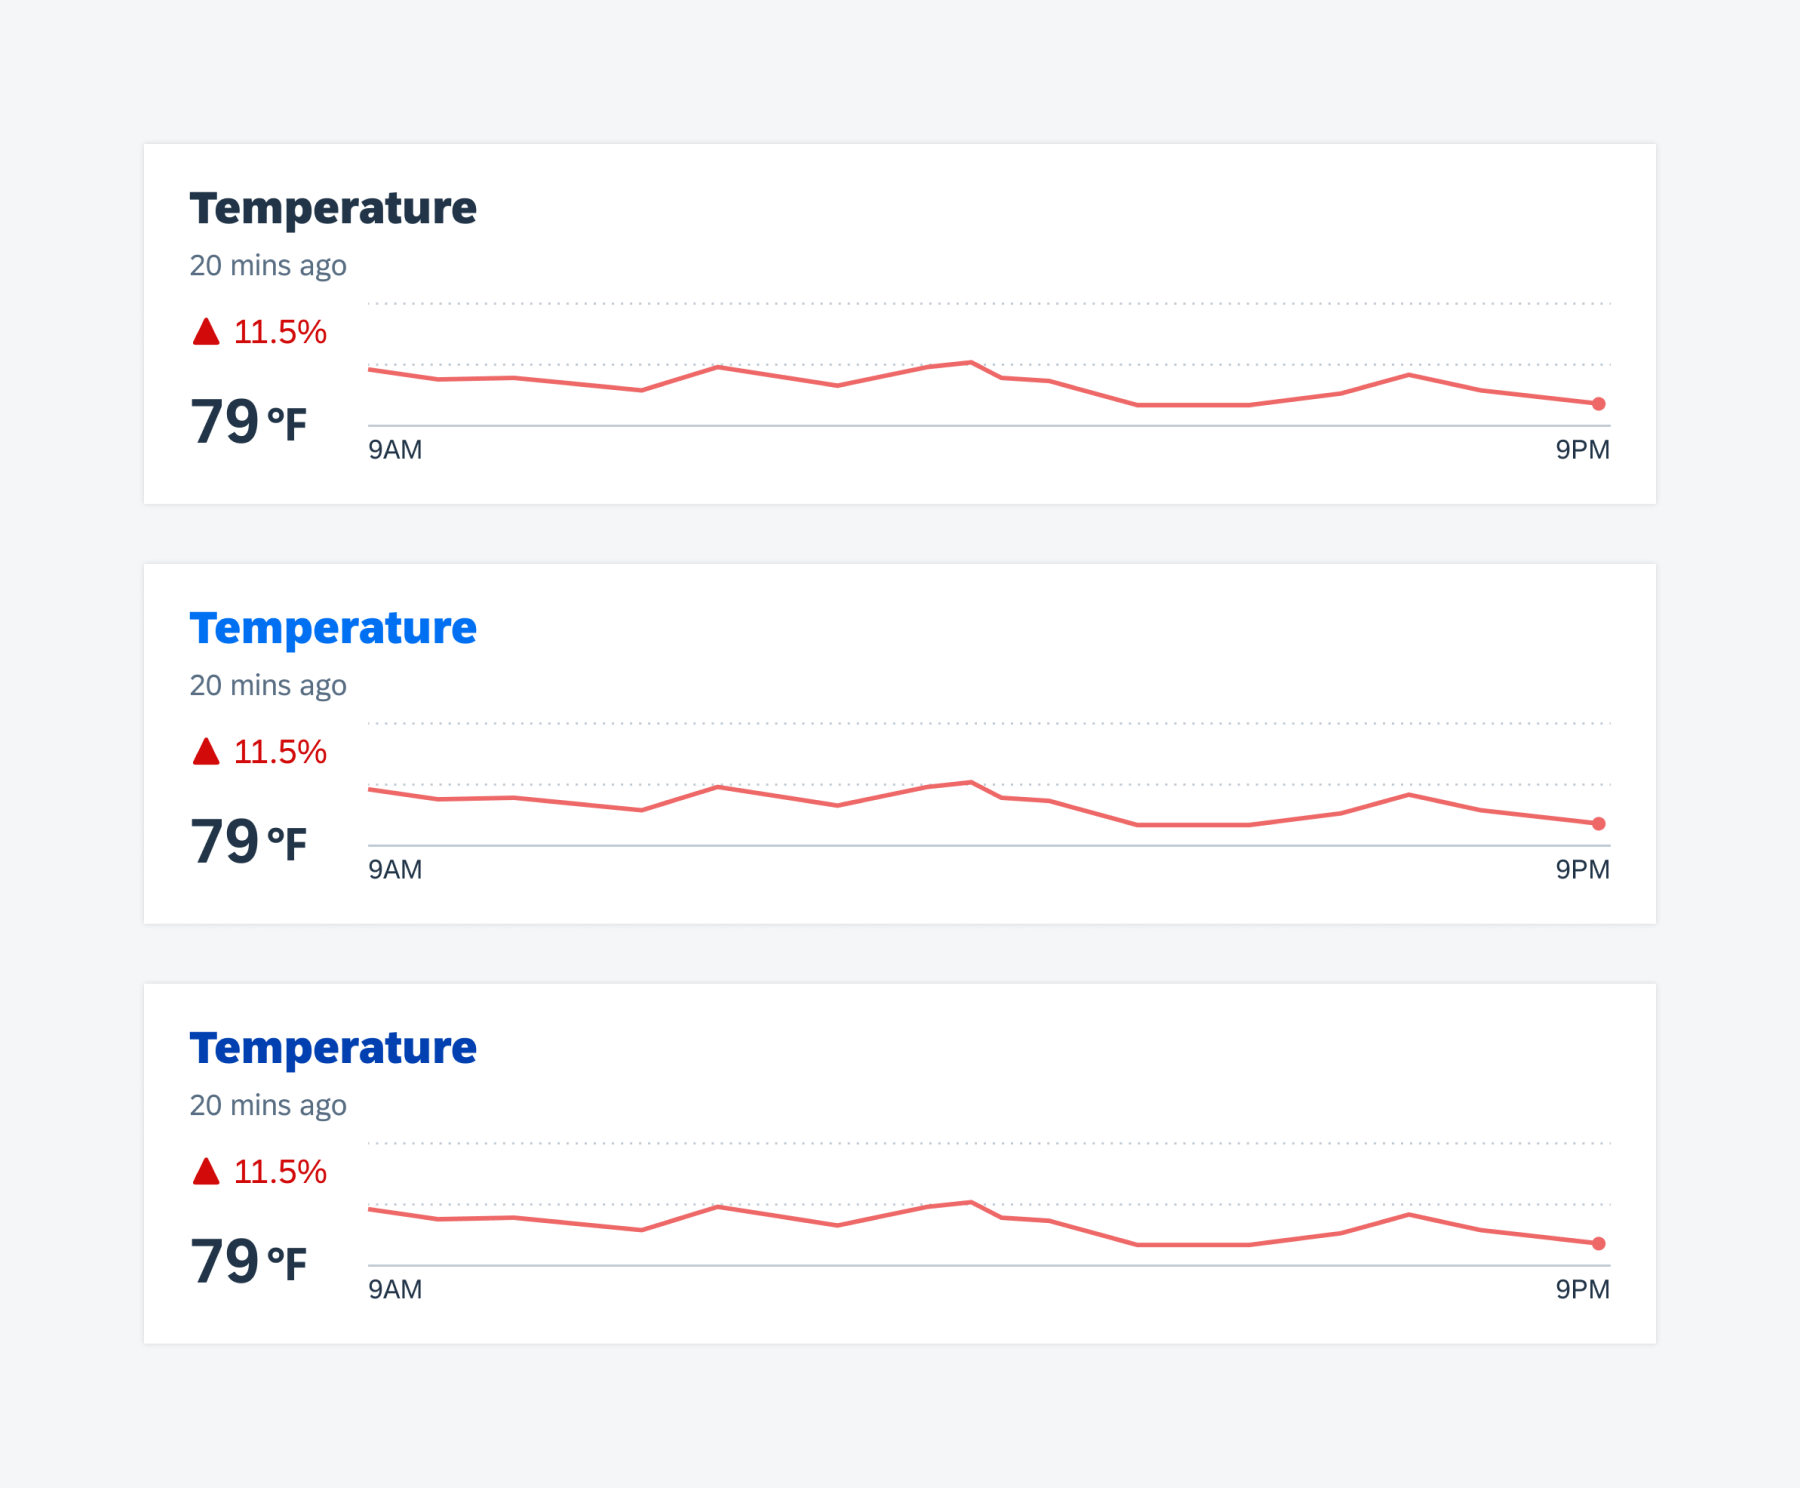
Examples with a non-interactive chart (top), with an interactive chart (middle), and with an interactive chart in tap state (bottom)
Development: FUIObjectHeaderChartView
SAP Fiori for Android: Chart Overview
Related Components/Patterns: Object Header
 Your feedback has been sent to the SAP Fiori design team.